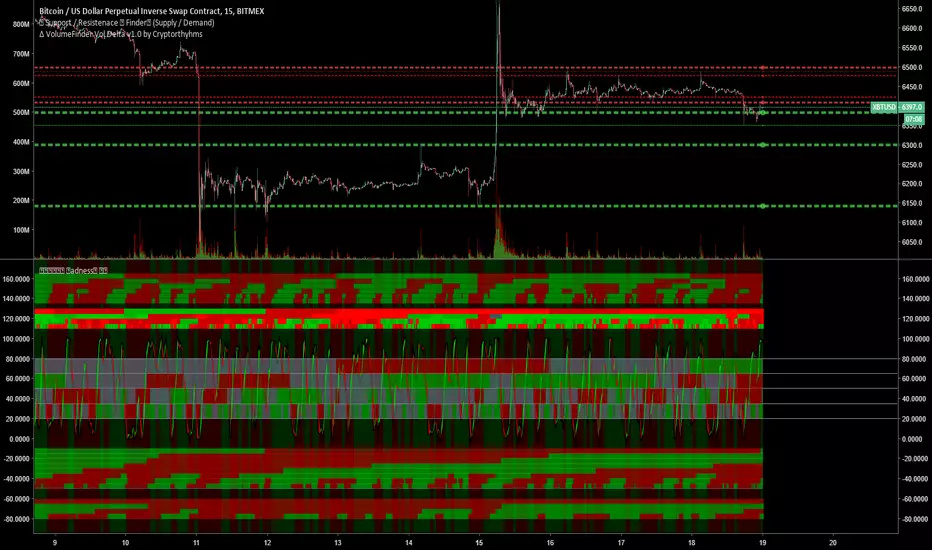
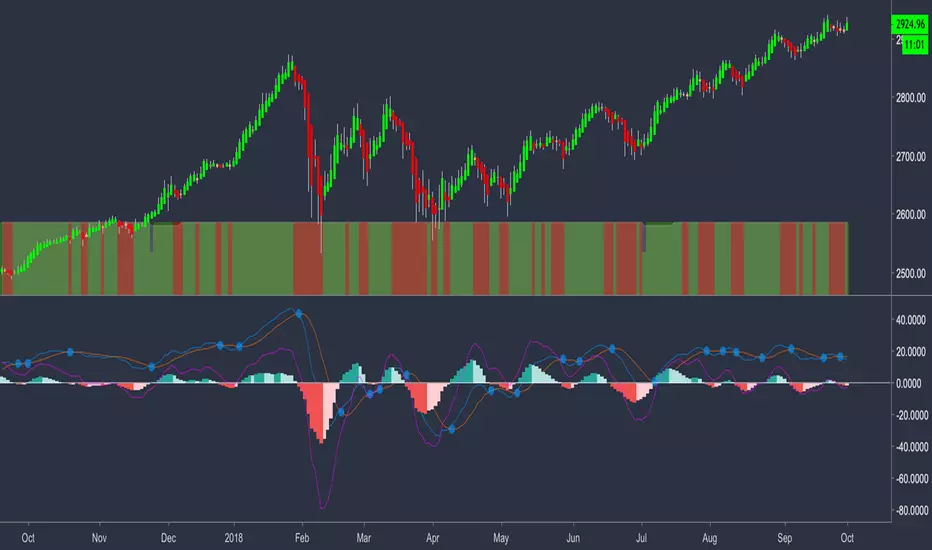
🕟𝕄🕗𝕋🕛𝔽 Madness MTF Grid by 🇨🇷🇾🇵🇹🇴🇷🇹🇭🇾🇭🇲🇸Here is a short description. This indicator being free will not have documentation for ALL things. Just the basics. There are 5 indicators included in it which I will not go into how each one works. There is ALOT of info on all the indicators included in here, just use google for that.
📊For each "row" of colored bands this represents one indicator. This is meant to be used on the 15m (or less) timeframe, and it looks up into higher TF's. It is meant to be maximized, so have this open in one tab and the chart on another. Dual Monitors are best. All options and Time frames are fully configurable inputs.
📈Indicators from top to bottom are:
1.)Polarity Filtration - 6 Timeframes
2.) Price Volume Trend - 4 Timeframes
3.) Stochastic RSI - 4 Timeframe Grid, and Current Timeframe in lines/ribbons
4.) MACD Crossovers - 8 Timeframes
5.)SuperTrend - 4 Timeframes
⏲Inside each larger "band" there are smaller rows. Each of these small rows represents one timeframe (30m, 60, 2h, 4h, etc) What timeframes you choose for them is completely configurable althought the current setup is already ideal to trade on 15m
⏲For these smaller rows the ones on top are highest timeframe(i.e. 4h) and the bottom small rows are lowest timeframe
⏲So each small row is like being able to check that indicator many timeframes at once. This will help you determine overall trends without switching to different timeframes on your chart all the time
📈The last piece of the puzzle is the background color. This background color is whether the chart is going up or down on the 1 hour heiken Ashi candle chart. Heiken ashi always shows up or down based on how they draw the candles, so its another useful trend indicator
👍If you enjoy MTF Madness all I ask in return is that you like the indicator and follow me on tradingview (profile here: www.tradingview.com)
❓If you have any questions, join us in the telegram chat in my signature!
แมคดี (MACD)
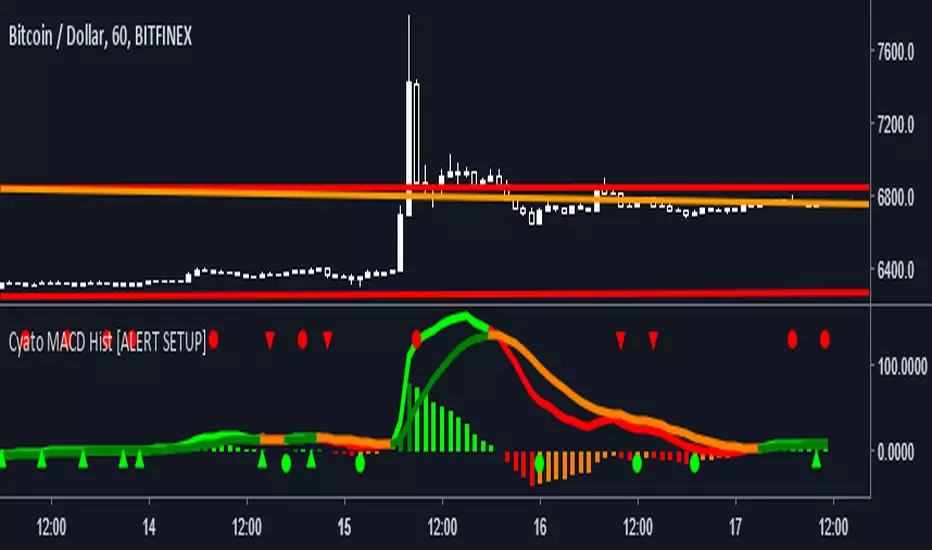
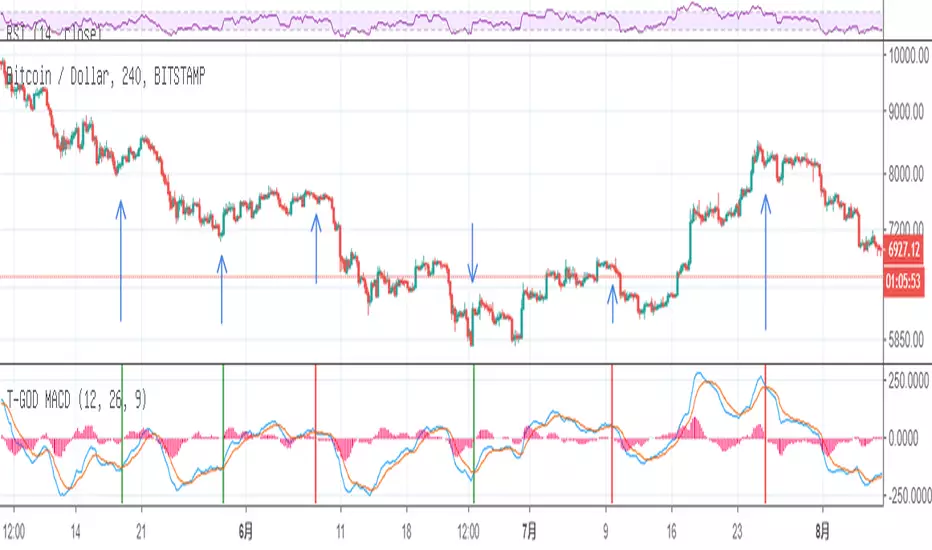
Cyatophilum MACD Hist [ALERT SETUP]Hello, I made a classic MACD Histogram indicator, with custom alerts and parameters though.
Shapes
Green circles : The MACD histogram is reversing, this is a buy (or Long) signal.
Red circles : The MACD histogram is reversing, this is a sell (or Short) signal.
Green Arrow up : The MACD histogram is enduring a bear fakeout. This is a buy signal.
Red Arrow up : The MACD histogram is enduring a bullfakeout. This is a sell signal.
Parameters ( INPUTS )
Classic MACD parameters.
Sensitivity : (1 = really sensitive to reverals and fakeouts - 5 = much less sensitive)
Activate Fakeouts : default is true. Uncheck to deactivate fakeout on chart /!\ will also deactivate fakeout alerts
Alerts (Automated trading alerts : SMS, email, etc.) that you can create :
Buy : a buy signal that will trigger on a bull reversal or a bear fakeout. No more than one buy/sell signal in a row (You will not get multiple buy signals or multiple sell signals in a row)
Sell : a sell signal that will trigger on a bearreversal or a bullfakeout. No more than one buy/sell signal in a row (You will not get multiple buy signals or multiple sell signals in a row)
Buy (Bull Reversal) : a buy signal that will trigger on each bull reversal.
Buy (Bear Fakeout) : a buy signal that will trigger on each bear fakeout.
Sell (Bear Reversal) : a sell signal that will trigger on each bear reversal.
Sell (Bull Fakeout) : a sell signal that will trigger on each bull fakeout.
If you like, leave a comment, thanks! If you find any bug, thanks for telling me!
-----------------------------------------------------------------------------------------------------------------
I am selling access to private scripts and backtests that can be found on my website .
I am also open to commissions : TradingView's PineScript development, reverse engineering.
Thanks.
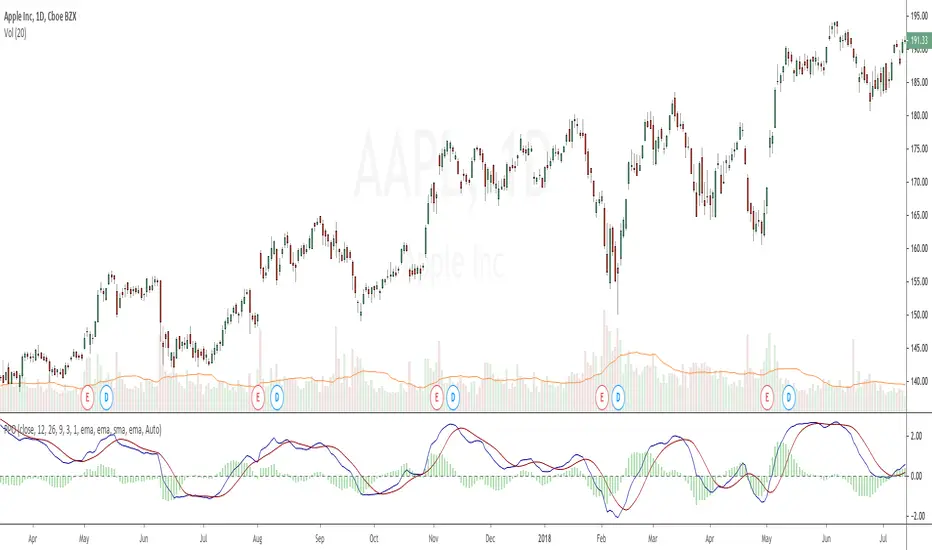
Percentage Price OscillatorThe Percentage Price Oscillator (PPO) is a momentum oscillator that measures the difference between two moving averages as a percentage of the larger moving average. As with its cousin, MACD, the Percentage Price Oscillator is shown with a signal line, a histogram and a center line. Signals are generated with signal line crossovers, center line crossovers, and divergences. More info here and here .
The indicator allows you to change the type of all moving averages (Simple, Exponential, Weighted, Volume-weighted, Triple EMA or a moving average that uses RSI ). The indicator also allows you to volume weight it(turned on by default), which will turn it into an indicator very similar to the Volume-Weighted Moving Average Convergence Divergence (VW-MACD) first used by Buff Pelz Dormeier in 2002 and described in detail in his book "Investing with Volume Analysis: Identify, Follow, and Profit from Trends". If you want to weight the oscillator against the true range instead of volume this is also possible. By default, this will be done automatically for assets that do not support volume. By checking the box "MACD" you can also turn this indicator into a standard MACD indicator.
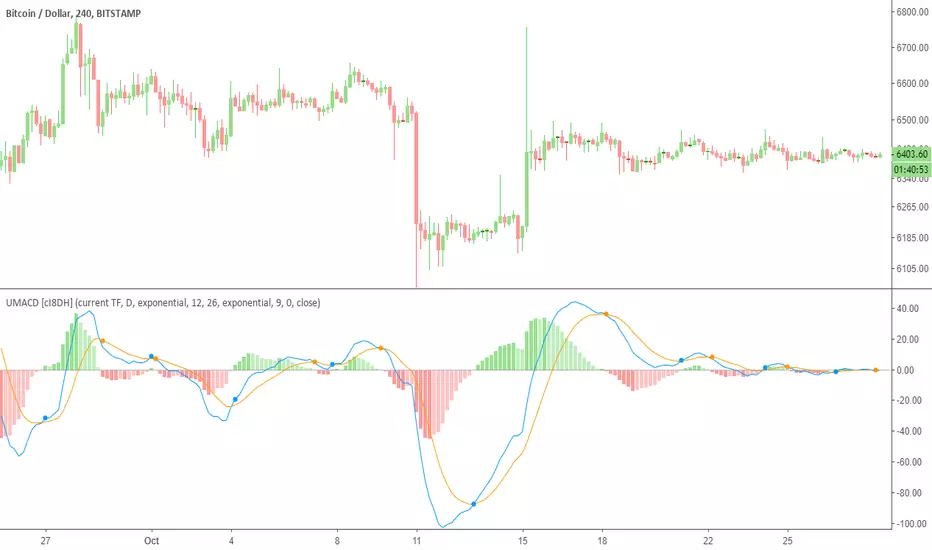
Ultimate MACD (UMACD) [cI8DH]Ultimate MACD ( UMACD ) includes True MACD fix, normalized MACD, multi time frame, bar coloring, and false cross avoidance options. It can also replicate Bill Williams Awesome Oscillator and Accelerator Oscillator. By default, this indicator is configured to work like the built-in MACD indicator. You need to customize it to your liking. Chart below shows example multi time frame setup.
True MACD and normalization
True MACD fix is similar to True RSI fix. The chart below proves that MACD is asymmetrical. This issue is most visible when analyzing charts across wide price ranges. It shows a logical problem in MACD, and most other indicators, as they can give you conflicting signals. For example, it can show long signal for both TRYUSD and its inverse pair USDTRY simultaneously. True MACD fixes this issue as shown in the chart below. Interestingly, this fix also normalizes MACD which is a major improvement upon regular MACD . (FYI, True MACD fix uses a different mechanism than my previous NMACD indicator.)
Avoiding false signals
This feature is very useful to avoid trading during sideways. To use this feature, set the std deviation multiplier option to a number greater than 1. I did some backtests on BTC chart with contract size set to 100% equity. It showed significant improvements for the time frames that I tested. (std deviation multiplier set to 1.5 @1h TF: 4x improvements, @2h: near 2x, 0.7 @4h: 2x, 0.4@12h: 3x, 0.4@daily: 1.5x). I also backtested True MACD fix separately and it showed significant improvement for most time frames.
Bar coloring
Bar coloring works similar to my previous indicators, Ultimate Money Flow and Ultimate RSI , and is subject to change in the future.
Bill Williams Awesome Oscillator and Accelerator Oscillator
Chart below both validates calculations in this indicator and also shows you how you can replicate Bill Williams AO indicators. You can apply all the features added to MACD to these indicators.
Here is a TL;DR list of my indicators to save you some time from looking at my obsolete indicators.
PS: I might publish the asymmetry fix as True MACD or as a general fix to all price-based indicators as an open source script in the future.
MFT MACD Trend [by: Bijan Ajdary]This indicator highlights the market trend Base on Macd...
It's also a multi-time frame indicator, which helps traders to make the best decision.
You can send your feedback and comments to my email address: bj.ajdary@gmail.com
@The_Last_Savior
My Other Scripts in TradingView:

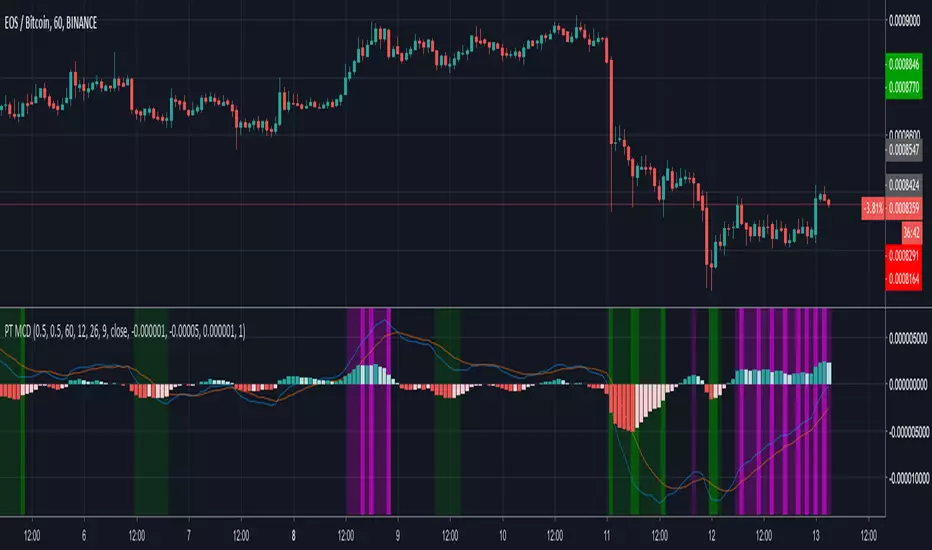
[ProfitTrailer] MACD StudyProfitTrailer buy/sell study for MACD strategy.
The script highlights the region where trailing is most likely to succeed.
DiNapoli Bundle Oscillators 3-in-1DiNapoli Oscillators 3-in-1 is a Bundle that includes the 3 oscillators used by DiNapoli in just 1 single indicator :
DiNapoli MACD (Dema)
DiNapoli Preferred Stochastic
DiNapoli Detrended Oscillator (DOSC)
This Bundle version includes the following features :
Ability to select which Oscillator to plot: MACD, Stochastic or Detrended
Show/Hide the Oscillation Lines
Show Crosses with Signal Line
Add a label to each oscillator for ease of identification
Adapt OB/OS Factor Ratio to each Market
Show OB/OS Levels
Show Preceding OB/OS Cloud
Show Divergences (experimental)
For convenience it also includes Custom Alerts . Now it is possible to get alerts on:
Oscillator Cross
Bullish Oscillator Cross
Bearish Oscillator Cross
OverBought Condition
Entering OverBought Condition
Exiting OverBought Condition
OverSold Condition
Entering OverSold Condition
Exiting OverSold Condition
Possible Regular Divergence
Possible Regular Bullish Divergence
Possible Regular Bearish Divergence
This indicator is meant to be used by professional traders.
If you would like to subscribe , please send me a private message.

DiNapoli MACD (DEMA)DiNapoli MACD (DEMA) is a custom indicator used in the context of identifying the position of strong hands.
This version of the indicator includes the following features :
Show/Hide the Oscillation Lines
Highlight Cross with Signal Line
Show Zero Line
Show Divergences (experimental)
For convenience it also includes Custom Alerts . Now it is possible to get alerts on:
Alert on MACD Cycle Shift
Bullish MACD Signal
Bearish MACD Signal
Possible Regular Divergence
Possible Regular Bullish Divergence
Possible Regular Bearish Divergence
This indicator is meant to be used by professional traders.
If you would like to subscribe , please send me a private message.

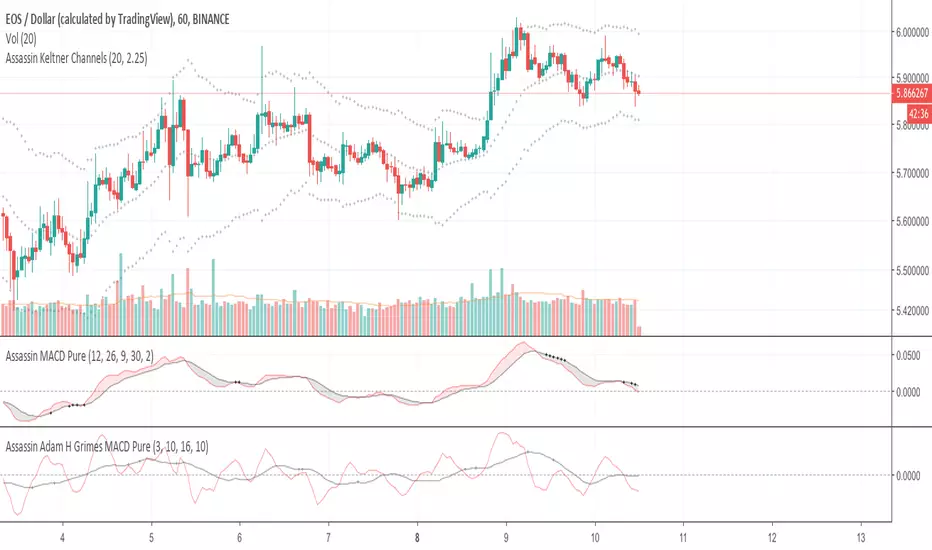
Assassin Adam H Grimes MACD PureMACD LINE = 3-period SMA minus 10-period SMA.
Signal line = 16-period Sma of the fast line.
Plot a zero line for reference.
remove histogram.
use sma instead for standard MACD's ema.
Gray cross for Divergences.
Ichimoku & 2 BB & Multi MA (Ribbon) by Theo ParkThis indicator contains :
Ichimoku
2 Bollinger Bands
6 Moving Averages
and multiple Ribbon MAs.

Multi function MACDMulti function MACD with auto divergence marking and a colorful dif line include pink,red,green and gray which may show the trade of market
多功能MACD,自动标记背离,移植了通达信的吸拉派落到dif线


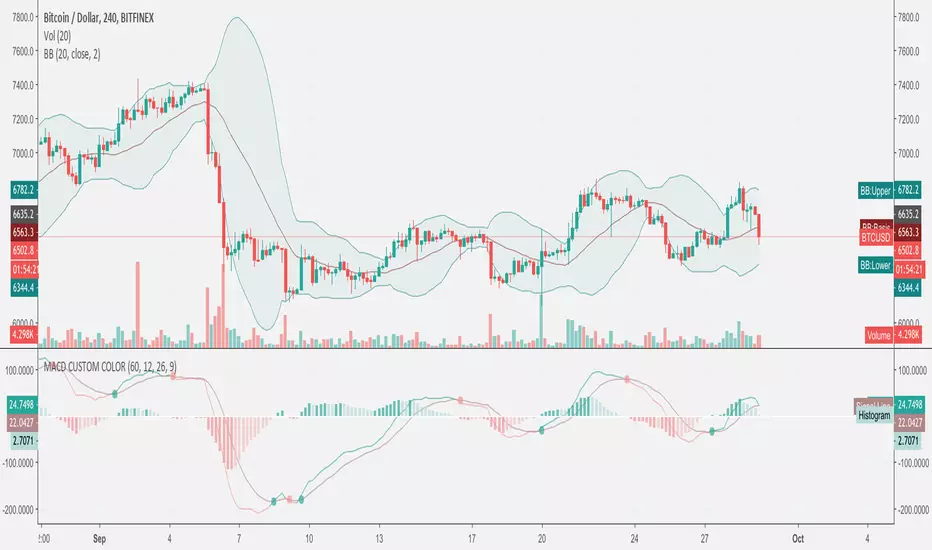
Perfect MACD - Leader + Volume Weighted + ImpulseThis version includes all the improvements:
- Leader line
- Classic histogram
- Impulse histogram (off by default)
- Volume weighted histogram (off by default)
- Cross marked with dots

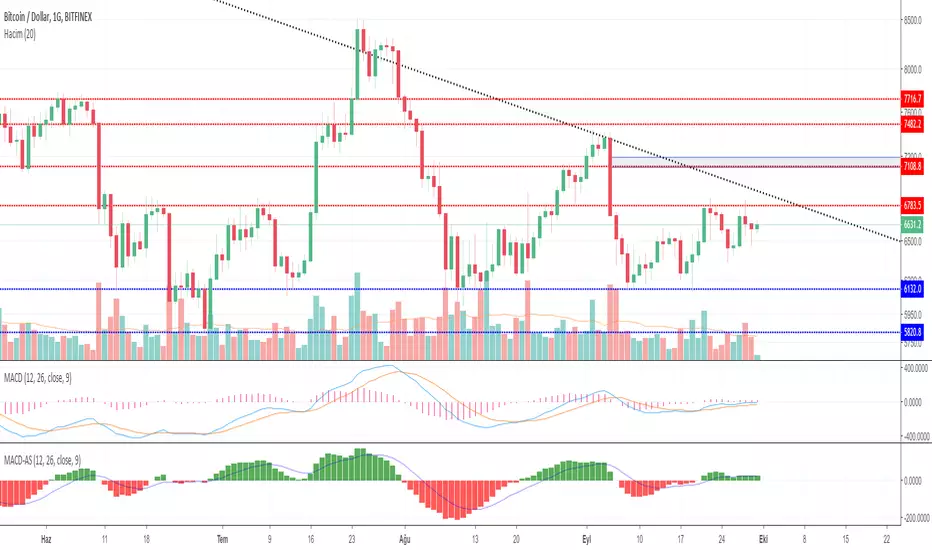
Aspray's Moving Average Convergence/DivergenceAspray's Moving Average Convergence/Divergence a.k.a MACD-AS
MACD-AS better than MACD, because it gives an early signal.
BUY signal: If MACD-AS histogram is red (and big at negative side) and cross over signal line
SELL signal: If MACD-AS histogram is green (and big at positive side) and cross under signal line

MACD Divergence MarkFeatures:
Bright & Dark theme option. Choose the type that you can see clearly.
Customizable MACD length parameters.
Mark all the MACD Divergence signals on your chat!
Getting Started:
Replace your MACD indicator with this one.
Contributing:
You can report bugs or issues under this page.
Any advice would be helpful for improving this indicator's accuracy.
Acknowledgements:


