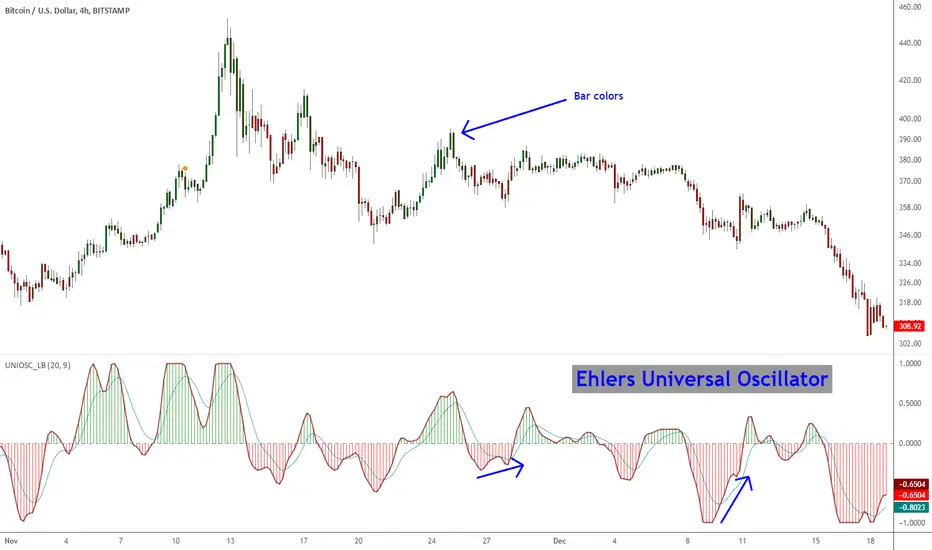
Ehlers Universal Oscillator [LazyBear]Universal Oscillator by Mr. Ehlers is an evolution of his SuperSmoother filter. The new indicator follows the swings in price without introducing extra delay.
It is controlled through one single input – the band edge – which basically is frequency. The smaller it is set, the less lag there is, but you may see lot of whipsaws. Built-in automatic gain control normalizes the output to vary between the range of -1 to +1.
Mr. Ehlers suggests a straightforward system:
- Buy when long-term Universal Oscillator crosses above zero
- Sell when long-term Universal Oscillator crosses below zero
I have added options to draw a signal line, histogram and bar coloring. Bar coloring, if enabled, is done using the histogram color, but you can change it easily to signal_cross by uncommenting a line (check the source).
More info:
Whiter is Brighter - Ehlers
List of my other indicators:
- GDoc: docs.google.com
- Chart:
Lazybear
Vervoort Heiken-Ashi LongTerm Candlestick Oscillator [LazyBear]HACOLT (Heikin Ashi Candles Oscillator Long Term) is a technical indicator designed by Sylvain Vervoort. It is based on Mr.Vervoort's other indicator, HACO (Heikin-Ashi Candles Oscillator - posted here: ).
Optimized for long-term trading, HACOLT shows three levels: -1, 0 and 1. These levels suggest "an open short position", "no open position", and "an open long position", respectively. Passing from a certain level to another is viewed as a trading signal:
- Rising from -1 or 0 to 1 suggests a Long Entry and Short exit;
- Falling from 1 to 0 or -1 suggests a Long Exit;
- Falling from 1 or 0 to -1 indicates a Short Entry.
Fits in nicely with any trading setup as a confirmation indicator
More info:
- tlc.thinkorswim.com
- www.motivewave.com
List of my other indicators:
- GDoc: docs.google.com
- Chart:

Vervoort Heiken Ashi Candlestick OscillatorHeiken-Ashi Candlestick Oscillator (HACO), by Sylvian Vervoort, is a digital oscillator version of the colored candlesticks.
Explanation from Vervoort:
"HACO is not meant to be an automatic trading system, so when there is a buy or sell signal from HACO, make sure it is confirmed by other TA techniques. HACO will certainly aid in signaling buy/sell opportunities and help you hold on to a trade, making it more profitable. The behavior of HACO is closely related to the level and speed of price change. It can be used on charts of any time frame ranging from intraday to monthly."
HACO has 2 configurable length parameters - "UP TEMA length" and "Down TEMA length". Vervoort suggests having them the same value.
I have also added an option to color the bars (overlay mode).
More info:
Trading with the Heiken-Ashi Candlestick Oscillator - Sylvian Vervoort
List of my other indicators:
- GDoc: docs.google.com
- Chart:

No Volume SVAPO [LazyBear]This is a no-volume version of Vervoort's SVAPO. The original version is @
Since it doesn't include volume in its calculations, you can use this on FX.
More info on SVAPO:
More info:
stocata.org
stocata.org
BTW, this is my 150th script. Plenty more to come, my to-publish queue is still full of new stuff :)
For a complete list of my other indicators, do check out the links below:
- GDoc: docs.google.com
- Chart:

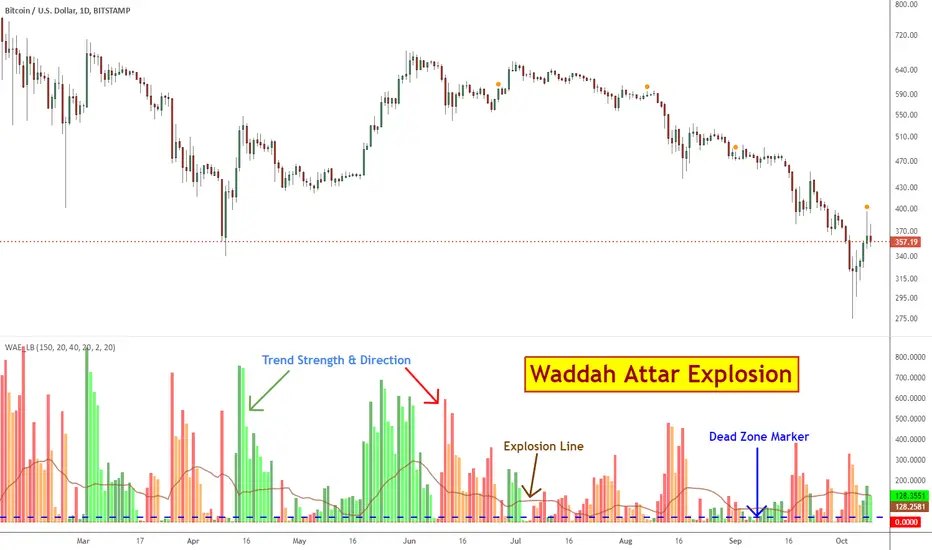
Waddah Attar Explosion [LazyBear]This is a port of a famous MT4 indicator, as requested by user @maximus71. This indicator uses MACD/BB to track trend direction and strength. Author suggests using this indicator on 30mins.
Explanation from the indicator developer:
"Various components of the indicator are:
Dead Zone Line: Works as a filter for weak signals. Do not trade when the red or green histogram is below it.
Histograms:
- Red histogram shows the current down trend.
- Green histogram shows the current up trend.
- Sienna line shows the explosion in price up or down.
Signal for ENTER_BUY: All the following conditions must be met.
- Green histo is raising.
- Green histo above Explosion line.
- Explosion line raising.
- Both green histo and Explosion line above DeadZone line.
Signal for EXIT_BUY: Exit when green histo crosses below Explosion line.
Signal for ENTER_SELL: All the following conditions must be met.
- Red histo is raising.
- Red histo above Explosion line.
- Explosion line raising.
- Both red histo and Explosion line above DeadZone line.
Signal for EXIT_SELL: Exit when red histo crosses below Explosion line. "
All of the parameters are configurable via options page. You may have to tune it for your instrument.
More info:
Author note: www.forex-tsd.com
Video (French): www.youtube.com
List of my other indicators:
- GDoc: docs.google.com
- Chart:
Elder's Market Thermometer [LazyBear]Market temperature, introduced by Dr.Alexander Elder, helps differentiate between sleepy, quiet and hot market periods.
Following is Mr.Elder's explanation on how to use this indicator (from his book "Come in to my Trading Room"):
"When markets are quiet, the adjacent bars tend to overlap. The consensus of value is well established, and the crowd does little buying or selling outside of yesterday’s range. When highs and lows exceed their previous day’s values, they do so only by small margins. Market Thermometer falls and its EMA slants down, indicating a sleepy market. When a market begins to run, either up or down, its daily bars start pushing outside of the previous ranges. The histogram of Market Thermometer grows taller and crosses above its EMA, which soon turns up, confirming the new trend."
"Market Thermometer gives four trading signals, based on the relationship between its histogram and its moving average:
1) The best time to enter new positions is when Market Thermometer falls below its moving average. When Market Thermometer falls below its EMA, it indicates that the market is quiet. If your system flashes an entry signal, try to enter when the market is cooler than usual. When Market Thermometer rises above its moving average, it warns that the market is hot and slippage more likely.
2) Exit positions when Market Thermometer rises to triple the height of its moving average. A spike of Market Thermometer indicates a runaway move. When the crowd feels jarred by a sudden piece of news and surges, it is a good time to take profits. Panics tend to be short-lived, offering a brief opportunity to cash in. If the EMA of Market Thermometer stands at 5 cents, but the Thermometer itself shoots up to 15 cents, take profits. Test these values for the market you are trading.
3) Get ready for an explosive move if the Thermometer stays below its moving average for five to seven trading days. Quiet markets put amateurs to sleep. They become careless and stop watching prices. Volatility and volume fall, and professionals get a chance to run away with the market. Explosive moves often erupt from periods of inactivity.
4) Market Thermometer can help you set a profit target for the next trading day. If you are a short-term trader and are long, add the value of today’s Thermometer EMA to yesterday’s high and place a sell order there. If you are short, subtract the value of the Thermometer’s EMA from yesterday’s low and place an order to cover at that level."
You can configure the "Explosive Move threshold" (default: 3), "Idle Market Threshold" (default: 7) and "Thermometer EMA length" (default: 22) via Options page.
More info:
"Come in to my Trading Room - A complete Guide to Trading" by Dr.Alexander Elder. (Page 162)
List of my other indicators:
- Chart:
- GDoc: docs.google.com

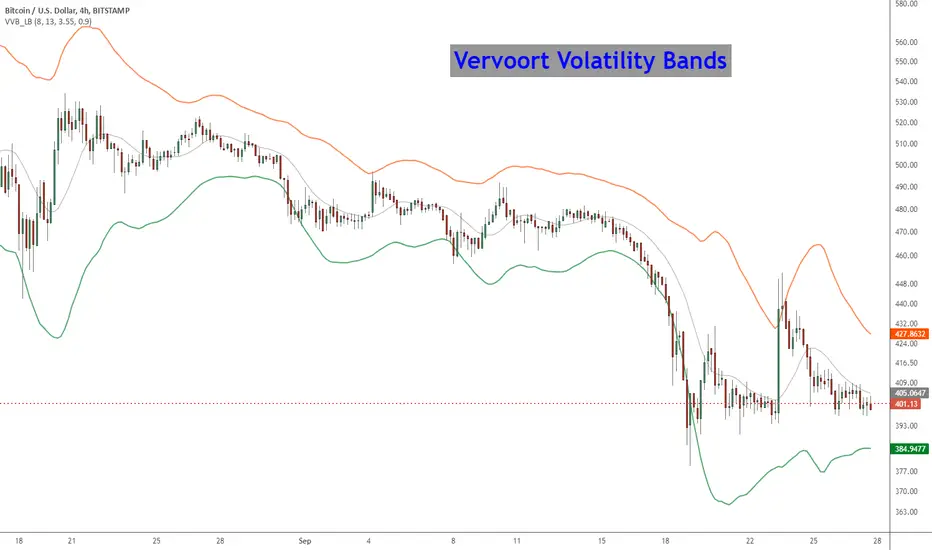
Vervoort Volatility Bands [LazyBear]This is Mr. Vervoort's take on volatility bands. Sticking to his style, he uses highly smoothed data everywhere, also improves on the way the bands are calculated. Is this better than others? I will let you guys decide :)
More info:
www.traders.com
List of my other indicators:
- Chart:
- GDoc: docs.google.com
Short-term Volume And Price Oscillator [LazyBear]Short-term Volume and Price Oscillator (SVAPO), developed by Sylvian Vervroot, combines both Price and Volume to construct an oscillator. In essence, when the price is trending up and volume is increasing, volume is added into the oscillator calculation. Conversely, when price is trending down and volume is increasing, volume will be subtracted from the oscillator. During consolidation phases when price and volume diverge, volume is not used to calculate the oscillator.
Some notes from his book:
- A buy is indicated when the oscillator is below the green line but greater than yesterday’s value.
A sell is indicated when the oscillator is above the red line but less than yesterday’s value.
- The start of a short term up move is signaled by SVAPO when it turns up from below the lower standard
deviation boundary. The same is valid for a short term down move when SVAPO turns down from above the
upper standard deviation boundary.
- Medium term turning points in an up or downtrend are mostly announced with a divergence between price and
SVAPO. In a medium term uptrend, SVAPO will generally continue to move above the 0-reference line.
More info:
stocata.org
stocata.org
Vervroot sometimes uses this with his modified %B oscillator ().
List of my other indicators:
- Chart:
- GDoc: docs.google.com

MACD Leader [LazyBear]Smoothing methods have lag, and since MACD makes use of moving averages, it usually lags behind price. You cannot eliminate lag completely, but one way of working around this is by adding a component of the price/MA difference back to MA. This technique is called Zero-lag (well, almost). "MACD Leader" makes use of this to form a leading signal to MACD.
First proposed by Giorgos E. Siligardos, "Leader" leads normal MACD, especially when significant trend changes are about to take place. This has the following features:
- It is similar to MACD in smoothness.
- It can be plotted along with MACD in the same window using the same scaling.
- It has the ability to lead MACD at critical situations
For detailed discussion on the various divergence patterns, refer to the PDF I have linked in the "More Info" below.
I have provided an option to plot MACD and MACD signal on the same pane. You can enable/disable them via options page.
For Pinescript coders: Try enabling histo on this to compare with normal MACD histo :)
More info:
drive.google.com
List of my other indicators:
- Chart:
- GDoc: docs.google.com

Vervoort Smoothed %b [LazyBear]As we know, %b is a measure of where prices are in relation to the outer Bollinger bands and therefore strongly related to volatility. This can get choppy, though.
Vervoort smoothed this using Zero lag TEMA of custom Heiken-ashi recalculated prices. According to Vervoort, "Smoothed Vervoort %b is often a leading indicator making smooth moves with clear turning points. Normal and hidden divergent moves make it an ideal tool to help find entry and exit points while watching price moving between the Bollinger bands."
More info:
drive.google.com
List of my other indicators:
- Chart:
- GDoc: docs.google.com

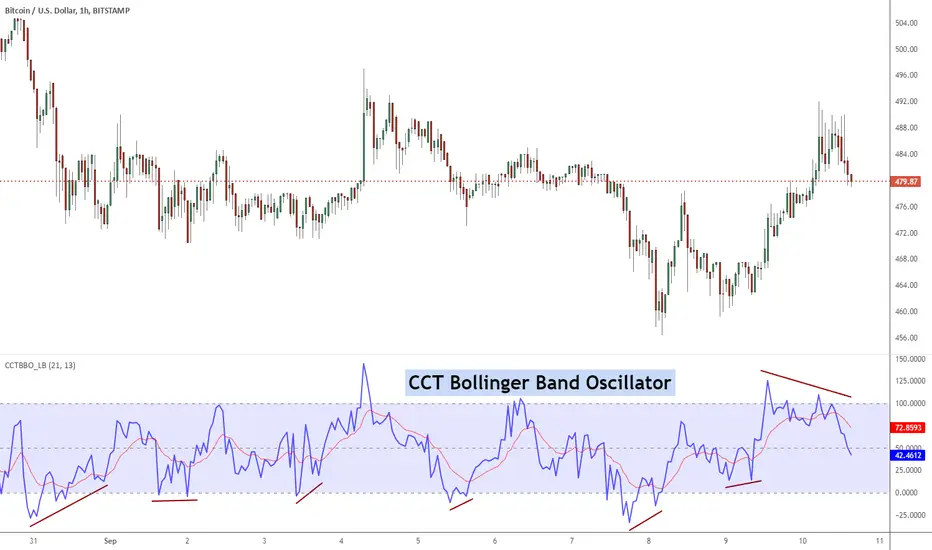
CCT Bollinger Band OscillatorThe CCT Bollinger Band Oscillator (CCTBO), developed by Steve Karnish of Cedar Creek Trading, reconfigures John Bollinger's classic Bollinger Bands (envelopes plotted at two Standard Deviations above and below a moving average) by drawing two parallel lines replacing the envelopes. The parallel lines represent a measurement of two Standard Deviations from the mean and are assigned a value of zero and 100 on the chart.
The indicator represents the price as it travels above and below the mean (50%) and outside the two standard deviations (zero and 100). Penetration of the upper band represents overbought conditions while penetration of the lower band signifies oversold conditions. Usage of the CCT Bollinger Band Oscillator to identify 'failure swings' and 'divergences' can lead to significant reversals.
List of my other indicators:
- Chart:
- GDoc: docs.google.com
Elastic Volume Weighted Moving Average & Envelope [LazyBear]Elastic Volume Weighted Moving Average (eVWMA) is a statistical measure using the volume to define the period of the moving average. The eVWMA can be looked at as an approximation to the average price paid per share. Multiplier is usually the number of shares, but it can be approximated using cumulative sum of volume (Enable it via "Use Cumulative Volume" option) or sum of volume over "n" periods.
I have also added an option to draw eVWMA envelope (eVWMA on HLC).
More info:
christian-fries.de
List of all my indicators:
- Chart:
- GDoc: docs.google.com

Earnings S/R Levels [LazyBear]These levels are based on price around earnings day. I have implemented support for 2 calculation modes:
Mode 1: Level = (low of 1 day prior to earnings + high of 1 day after earnings) / 2.0
Mode 2: Level = (hl2 of 1 day prior to earnings + hl2 of 1 day after earnings + close from earnings day) / 3.0
Chart above shows "Mode 1". Mode can be changed via options page.
This indicator was requested by user @mika2k1ff. I learnt more about this idea from @DanV and @TimWest (Thanks guys :)). BTW, TimWest has an indicators package, "Key Hidden Levels", that has this and more.
Do let me know how you use this, I am very intrigued by the potential this idea shows. Thanks.
For a complete list of my indicators:
- GDoc: docs.google.com
- Chart:

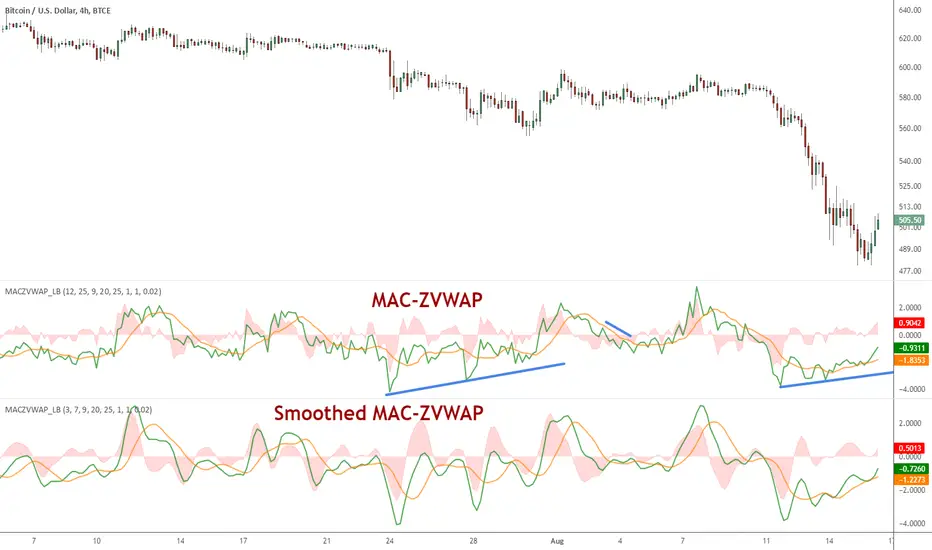
MAC-Z VWAP Indicator [LazyBear]This a modified MAC-Z using Z-VWAP. Since this uses VWAP, the signals are derived indirectly from both volume and price action.
I have also included a way to smooth MACZ-VWAP, you can enable it via options page.
Note that this will not work on any FX pair, as volume is not available.
Referenced indicators:
Z-distance from VWAP:
MAC-Z Indicator:
Z-Score:
Complete list of my indicators:
GDoc: docs.google.com
Chart:
Enhanced Index [LazyBear]The Enhanced Index (EIDX) is a modified William %R that behaves much like the original, to indicate overbought and oversold market conditions.
EIDX has the advantage of
- Reacting more quickly to changes in buying power.
- Predicting market turning points better than other oscillators. Divergences are more pronounced.
List of my other indicators:

Colored Volume Bars [LazyBear]Edgar Kraut proposed this simple colored volume bars strategy for swing trading.
This is how the colors are determined:
- If today’s closing price and volume are greater than 'n' days ago, color today’s volume bar green.
- If today’s closing price is greater than 'n' days ago but volume is not, color today’s volume bar blue.
- Similarly, if today’s closing price and volume is less than 'n' days ago, color today’s volume bar orange.
- If today’s closing price is less than 'n' days ago but volume is not, color today’s volume bar red.
Buy the green or blue volume bars, use a 1% trailing stop, and stand aside on red or orange bars.
As you see, this is more for entry confirmation. I have not tested this on any instrument.
You may have to tune the lookback period for your instrument. Default is 10.
More info:
"A color-based system for short-term trading" - www.traders.com
List of all my indicators:

Z distance from VWAP [LazyBear]This calculates normal distance of price from VWAP. This is a mean reverting idea (something like ZScore), but using both "volume" and "close".
Useful for finding OB/OS areas and potential turning points.
Complete list of my indicators:

Indicator: Intrady Momentum IndexThe Intraday Momentum Index (IMI), developed by Tushar Chande, is a cross-breed between RSI and candlestick analysis. IMI determines the candle type that dominated the recent price action, using that to pinpoint the extremes in intraday momentum.
As the market tries to bottom after a sell off, there are gradually more candles with green bodies, even though prices remain in a narrow range. IMI can be used to detect this shift, because its values will increase towards 70. Similarly, as the market begins to top, there will be more red candles, causing IMI to decline towards 20. When the market is in trading range, IMI values will be in the neutral range of 40 to 60.
Usually intraday momentum leads interday momentum. QStick can show interday momentum, it complements IMI. You will find it in my published indicators.
I have added volatility bands based OB/OS, in addition to static OB/OS levels. You can also turn on IMI Ehlers smoothing. BTW, all parameters are configurable, so do check out the options page.
List of my other indicators:
-
- Google doc: docs.google.com

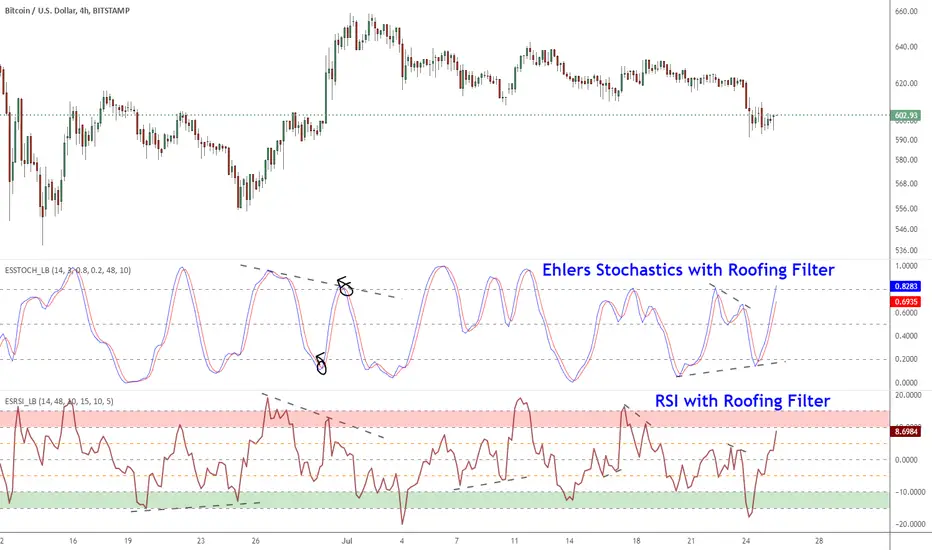
Ehlers Smoothed Stochastic & RSI with Roofing FiltersRoofing filters, first discussed by Mr.John Ehlers, act as a passband, filtering out unwanted noise from market data and accentuating turning points.
I have included 2 indicators with filters enabled. Both support double smoothing via options page. All the parameters are configurable.
Info on Roofing Filter and Ehlers Super Smoother:
----------------------------------------------------
The Ehlers' Roofing Filter is an expansion on Ehlers Super Smoother Filter, both being smoothing techniques based on analog filters. This filter aims at reducing noise in price data.
In Super Smoother Filter, regardless of the time frame used, all waves having cycles of less than 10 bars are considered noise (customizable via options page). The Roofing Filter uses this principle, however, it also creates a so-called "roof" by eliminating wave components having cycles greater than 48 bars which are perceived as "spectral dilation". Thus, the filter only passes those spectral components whose periods are between 10 and 48 bars. This technique noticeably reduces indicator lag and also helps assess turning points more accurately.
More info:
- Spectral dilation paper: www.mesasoftware.com
- John Ehlers presentation: www.youtube.com
------------------------------------------------------
If you want to use RSI %B and Bandwidth, follow this guide to "Make mine" this chart and get access to the source:
drive.google.com
For the complete list of my indicators, check this post:
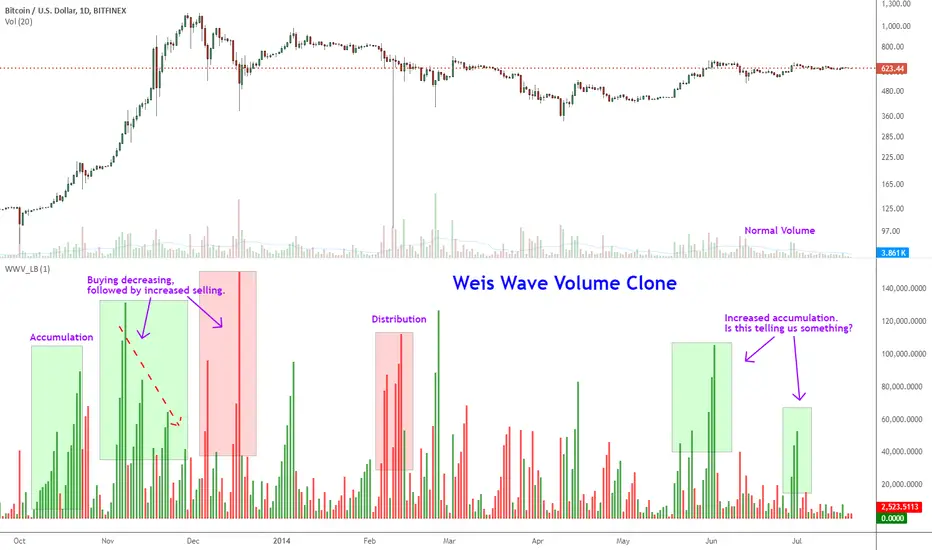
Indicator: Weis Wave Volume [LazyBear]This indicator takes market volume and organizes it into wave charts, clearly highlighting inflection points and regions of supply/demand.
Try tuning this for your instrument (Forex not supported) by adjusting the "Trend Detection Length". This "clubs together" minor waves. If you like an oscillator-kind-of display, enable "ShowDistributionBelowZero" option.
Note: This indicator is a port of a clone of WeisVolumePlugin available for another platform. I don't know how close this is to the original Weis, if any has access to it, do let me know how this compares. Thanks.
More info:
weisonwyckoff.com
Complete list of my indicators:
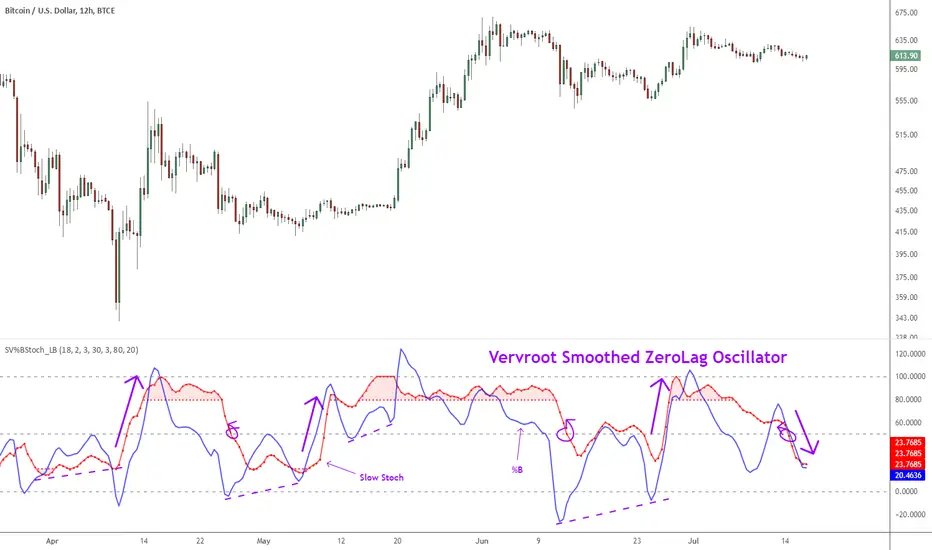
Indicator: Vervoort Smoothed Oscillator [LazyBear]This is Mr. Sylvian Vervoort's take on improving some well-known indicators (%B and Stoch) using smoothing techniques. A combination of TEMA and WMA does a nice job smoothing out %B, derived from zero-lag “Rainbow” data series. The same Rainbow series, averaged with the typical price, smooth the Stochastic K oscillator to produce slowStoch.
Vervroot's strategy for this oscillator (detailed explanation in the reference material below):
- It must be bullish for a buy signal and bearish for a sell signal. This means that both the oscillators must be moving up or down.
- Use the oscillators for detecting divergences. Divergence even in one is still valid.
- Stoch crossing 50 is a good confirmation signal. Momentum usually is an excellent leading indicator, so keep an eye on Stoch.
More info:
www.traders.com
www.scribd.com
Complete list of my indicators (Check the comments, I keep the list updated there):
RSI Bands, RSI %B and RSI BandwidthRSI bands provide an intuitive way of visualizing how the price movement causes RSI to move with in its range (0-100). Upper/Lower bands signify overbought and oversold levels respectively (Default: 70/30, you can customize them via options page). These bands closely match what Constance Brown explains in her book "Technical Analysis for the Trading Professional".
I have also coded up 2 scripts to visualize %B and Bandwidth, just as in BollingerBands. As you can see %B is equivalent to the actual RSI. Along with RSI_Bandwidth and %B, the bands convey a lot of information.
Another tip is to render Bollinger Bands along with RSIBands...endless possibilities :)
I have included all 3 scripts in the same chart, as they are all related. Since TradingView doesn't allow sharing more than one script in the same chart, you can only "Add script" RSI Bands.
If you want to use RSI %B and Bandwidth, follow this guide to "Make mine" this chart and get access to the source:
drive.google.com
For the complete list of my indicators, check this post:

DEnvelope [Better Bollinger Bands]*** ***
Bollinger Bands (BB) usually expand quickly after a volatility increase but contract more slowly as volatility declines. This extended time it takes for BB to contract after a volatility drop can make trading some instruments using BB alone difficult or less profitable.
In the October 1998 issue of "Futures" there is an article written by Dennis McNicholl called "Better Bollinger Bands", in which the author recommends improving BB by modifying:
- the center line formula &
- different equations for calculating the bands.
These bands, called "DEnvelope", follow price more closely and respond faster to changes in volatility with these modifications.
Fore more indicators, check out my "Master Index of indicators" (Also check my published charts page for new ones I haven't added to that list):
More scripts related to DEnvelope:
------------------------------------------------
- DEnvelope Bandwidth: pastebin.com
- DEnvelope %B : pastebin.com
Sample chart with above indicators: www.tradingview.com
