อินไซด์ บาร์
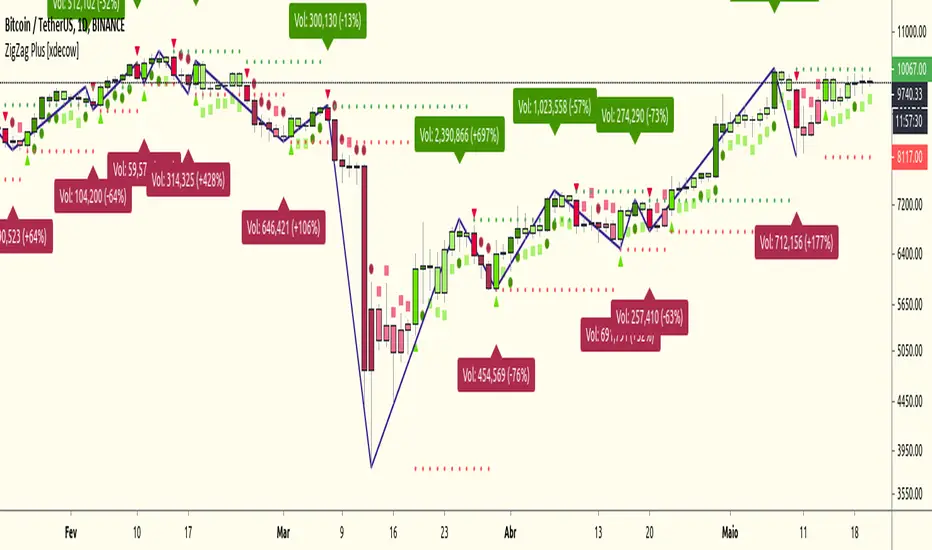
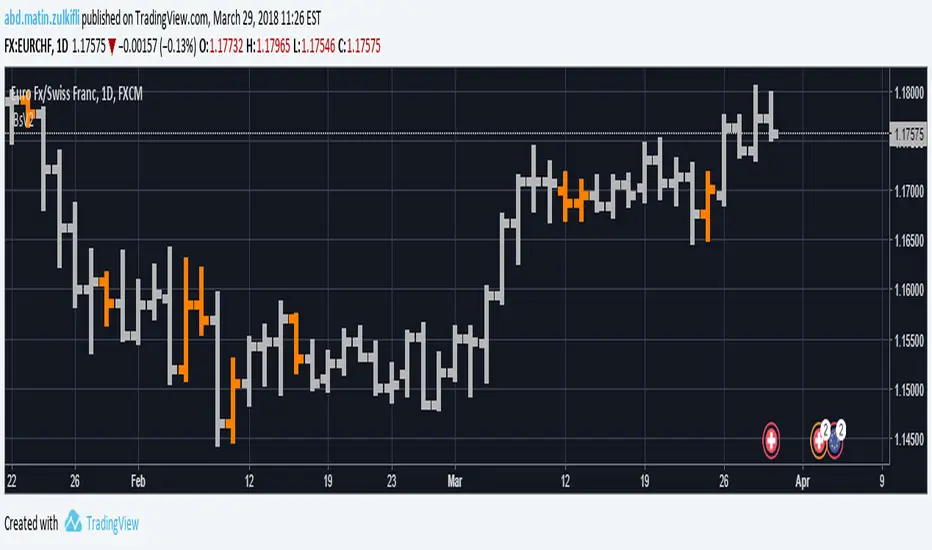
ZigZag Plus [xdecow]A ZigZag Like based on candle close.
A lot of options that can be hide in options.
Triangle/bright - reversal confirmation candle
Circle/dark - higher/lower candle breakout
Square/light - Insidebar
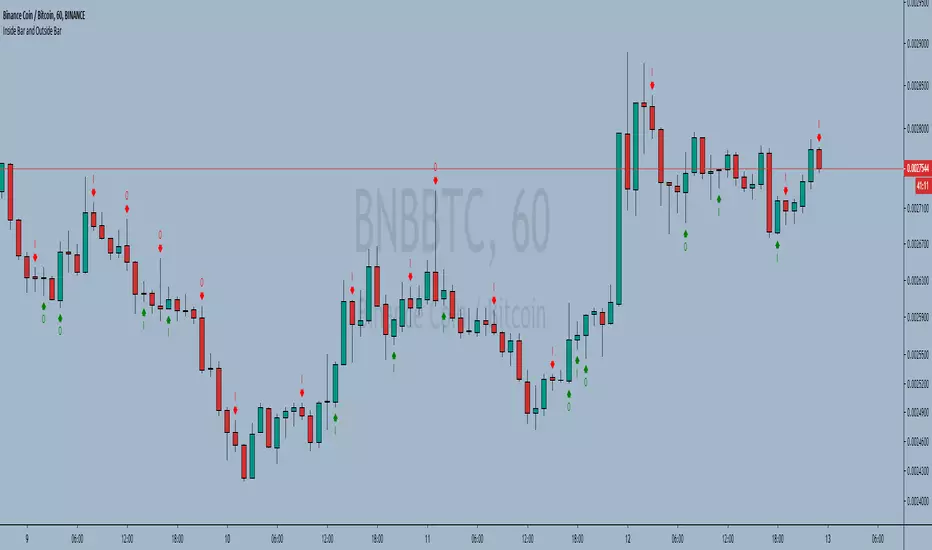
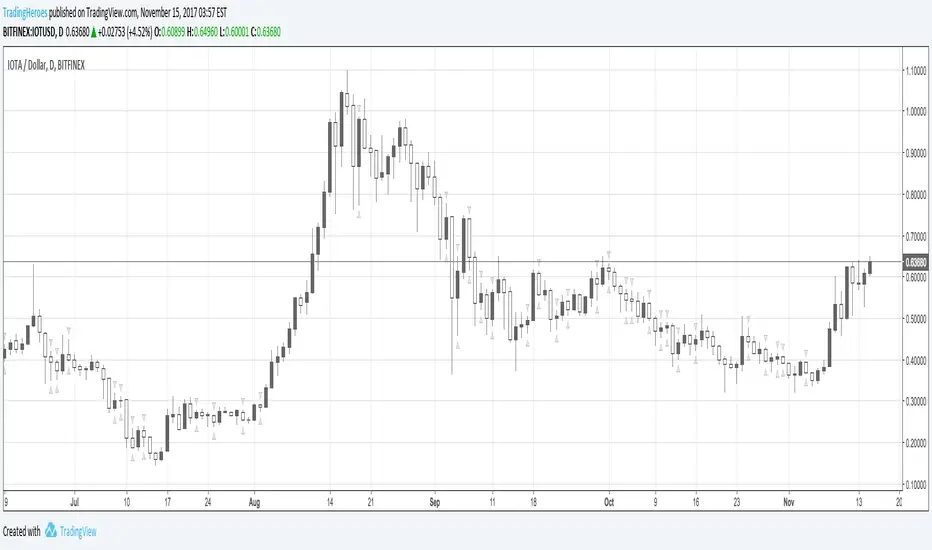
Inside Bar and Outside Bar Simple indicator, to show outside bars and inside bars
inside sellbar = "I" in red color
inside buybar = "I" in green color
Outside sellbar = "O" in red color
Outside buybar = "O" in green color
----------//---------------
PT-BR
Indicador simples, para mostrar outside bars e inside bars
inside sellbar = "I" na cor vermelha
inside buybar = "I" na cor verde
Outside sellbar = "O" na cor vermelha
Outside buybar = "O" na cor verde
Inside BarsMark Inside Bars with a triangle above the calendar. This indicator supports having different colors and alerts for 1, 2 or 3 consecutive inside bars.

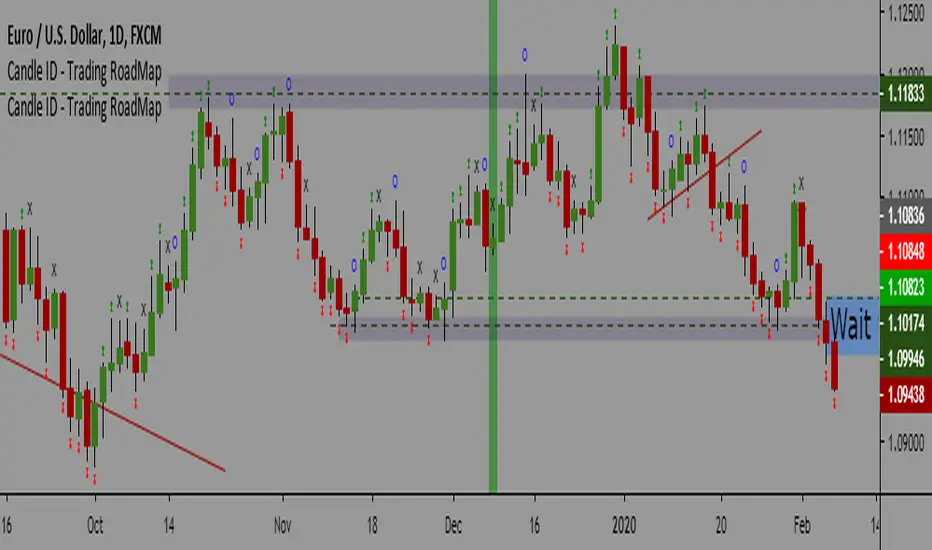
Candle ID - Trading RoadMapCandle ID- Trading RoadMap
Simple Script to show
- Inside Bar
- Outside Bar
- Up Bar: Bar with a Higher Hi in comparison to the previous bar
- Down Bar: Bar with a Lower Low in comparison to the previous bar
Have a peaceful and profitable trading day 😊
Khaled Maziad
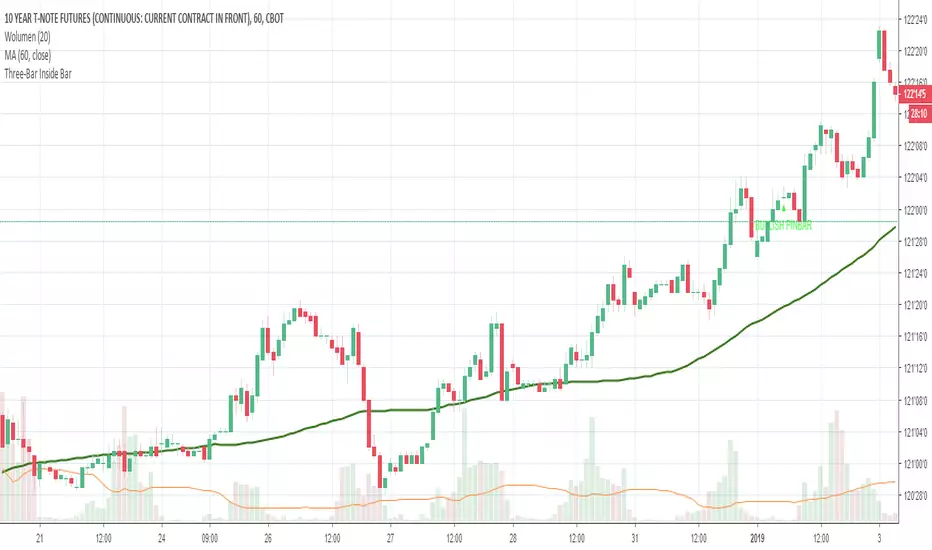
Three-Bar Inside Bar PaternAuthor: Johnan Prathap TASC March 2011
The typical inside bar two-bar view indicates minimal activity in a market. It is defined as a bar (or series of bars) that is completely within the range of the preceding bar; that is, it has a higher low and lower high than the bar immediately before it. Some traders consider a bar an inside bar if the high and low are equal to the previous bar or where there are several consecutive bars within the range of a previous bar.
Many analysts tend to view inside bars as an indication of declining market activity, or possibly a prelude to a large movement in either direction.
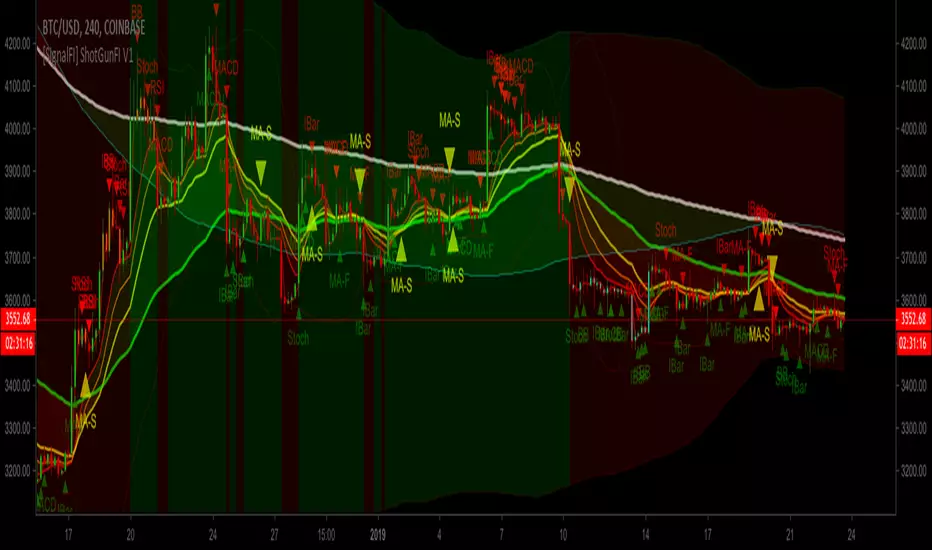
[SignalFI] ShotGunFI V1Welcome to ShotGunFI
In order to help give our members awareness of how major indicators move market price action, we created ShotGunFI. This script provides signals for the following indicators and gives a customizable framework for the user to track how certain indicators impact price and further how those impacts could relate to their overall strategy. We took the major indicators that are used in the market and smashed them into one chart with one indicator so that you can visualize a broad spectrum of strategies that are already driving price action.
This script is enabled with Data Leak and Repaint protection by default. Ensuring that signals are true.
The following indicators are included:
//+RSI Ob/Os Crossover Signals
- Candles are colored Orange and Aqua when RSI is overbought or oversold.
- Arrows and Alerts for crossover 30 and crossunder 70 RSI .
//+Slow Stochastic Signals
- Arrows and Alerts for crossover 20 and crossunder 80 Stoch RSI
//+MACD Bull/Bear Signals
- Arrows and Alerts for MACD Bull and Bear Signal line crossovers
//+MA Cross Bull/Bear Signals
- Arrows and Alerts for MA 1 Cross of MA 1 and MA 1 Cross of MA 4.
By default EMA is enabled, however, we included several other MA types to enhance and expand on this concept.
Included are the following MA types:
Kaufman Adaptive Moving Average ( KAMA )
Hull Moving Average
Smoothed Moving Average
Variable Index Dynamic Average
Fractal Adaptive Moving Average
Fractal Dimension Adaptive Moving Average
Double Exponential Moving Average
Least Squares Moving Average
Coefficient of Variation Weighted Moving Average
Simple Weighted Moving Average
Exponential Moving Average
Weighted Moving Average
Arnaud Legoux Moving Average
Option Types Labels:
"SWMA", "EMA", "WMA", "SMA", "HMA", "KAMA", "SMMA", "VIDYA", "VWMA", "ALMA", "FRAMA", "DEMA", "FDAMA", "LSMA", "COVWMA"
//+BollingBand Bull/Bear Signals
- Arrows and Alerts for lower BB crossover and higher BB crossover
//+Bollinger Band + RSI (BBRSI) Bull/Bear Signals
- Arrows and Alerts for custom higher timeframe Bollinger Band that integrates RSI . 4 Signals total.
//+InsideBar Bull/Bear Signals
- Arrows and Alerts for InsideBar bull/bear break combinations.
ALERTS DISABLED VERSION. Padaone Members Only.
SignalFI was created to help traders and investors to effectively analyze the market based on the Golden Mean Ratio (Fibonacci numbers), plan a trade and ultimately execute it. To help inform and educate market decisions we developed a set of Trading Indicators which are available on TradingView , the most advanced and yet easy to use charting platform available on the web.
SignalFI indicators are just that, indicators. Our indicators are generally configured to use completely historical data (negating repaint), and we advise all alerts created with SignalFI indicators to be fired upon "close" of the current candle. Our indicators can provide valuable context and visualization support when performing market analysis and executing buy and sell decisions. However. we are not financial experts, and all information presented on this site or our other media outlets are for educational purposes only.
For subscription information, visit www.signalfi.net and follow us on twitter.
INSIDE BAR This indicator identifies Inside Bar.
Inside Bar is an indecisive setup where traders are not sure of the direction which is reflected in the bar range which is usually narrower.
The day following Inside Bar usually would be a decisive bar with wide range.
This decisive bar can be exploited if traded with discipline.
The steps to follow are :
At EOD :
1) Use daily charts for locating Inside Bar with this indicator on.
2) Ensure you keep the parameter prev range Vs inside bar as 0.25 irrespective of default value. This means that the previous bar range is greater than the inside bar range by 25%.
3) Try going through all FNO scrips to locate inside bar (as there is no scanner in Trading View).
4) Once an Inside Bar scrip is located, earmark them or send them to watchlist.
5) Now you will have a watchlist with around 5-6 scrips.
Next trading day at market opening:
5) When the market opens, wait till 9.45 am (first half an hour).
6) Mark the first half an hour high and low. These are opening range high and opening range low.
7) If price breaks out decisively on the upside above opening range high, buy with a stop of opening range low. Target can be based on super trend or ema or any other method. If price breaks out decisively on the downside below opening range low, short with a stop of opening range high.
8) Ensure you follow disciplined position sizing.
Good luck.

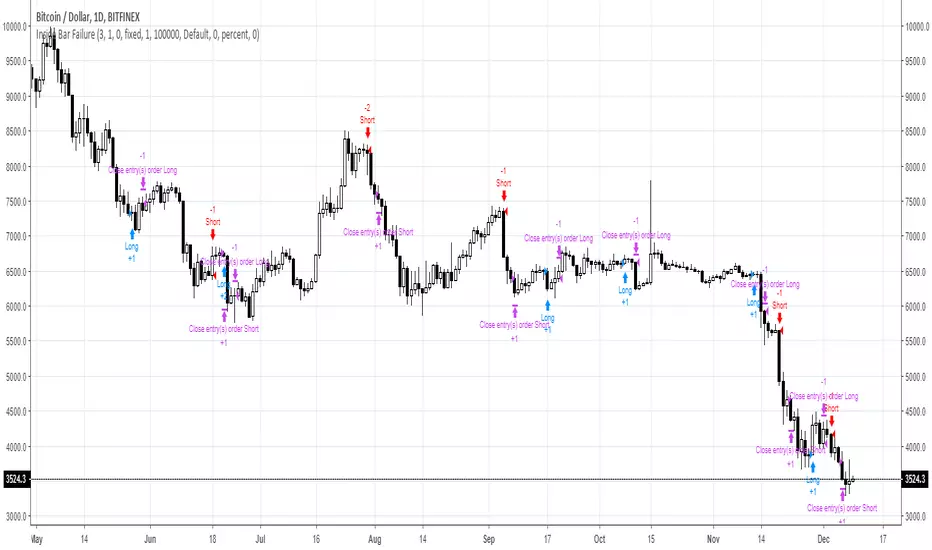
Inside Bar FailureYou can check edge profitability by adjusting the forward looking input, eg. how profitable is this signal after X bars.


Flying Buddha Inside Bars Indicator v1 by JustUncleLDescription:
=============
This indicator plots MAs and paints Triggered Alert Arrows base on Flying Buddha candle patterns.
The “Flying Buddha” Pattern is defined as:
---------------------------------------------
A candlestick chart with two moving averages: the 5 period exponential moving average (fast EMA) and the 10 period simple moving average (slow SMA), both applied to the closing price. The default “Flying Buddha” pattern is any candlestick which:
1. Has a LOW above the fast EMA, when the fast EMA is above the slow SMA (a bearish “Flying Buddha”); or
2. Has a HIGH below the fast EMA, when the fast EMA is below the slow SMA (a bullish “Flying Buddha”).
Alert Trigger:
---------------
A Flying Buddha Alert is triggered on the first candle that is a non-flying Buddha candle after a Flying Buddha Pattern candle sequence. Flying Buddhas can optionally be filtered by InsideBars and PinBars.
The Alert Trigger is optionally filtered by the Directional MA (default=EMA 89), and/or by Minimum Sequence length of Flying Buddhas.
Moving Averages:
------------------
You can select between 11 different types of moving averages, for each MA line in Flying Buddha MAs (fastMA and slowMA) and the Directional Filter MA:
SMA = Simple Moving Average.
EMA = Exponential Moving Average.
WMA = Weighted Moving Average
VWMA = Volume Weighted Moving Average
SMMA = Smoothed Simple Moving Average.
DEMA = Double Exponential Moving Average
TEMA = Triple Exponential Moving Average.
HullMA = Hull Moving Average
SSMA = Ehlers Super Smoother Moving average
ZEMA = Near Zero Lag Exponential Moving Average.
TMA = Triangular (smoothed) Simple Moving Average.
NOTE: This is a concept indicator, I also intend to release a trading BOT suitable for Autoview, based on this concept indicator.

MACD (Moving Average Convergence/Divergence) + Inside BarMACD (Moving Average Convergence/Divergence) + Inside Bar so that free users can have two things in same indicator.
Script is open for everyone.
Check and test the code of Inside Bar and let me know if it is correct.
Feel feel to share.

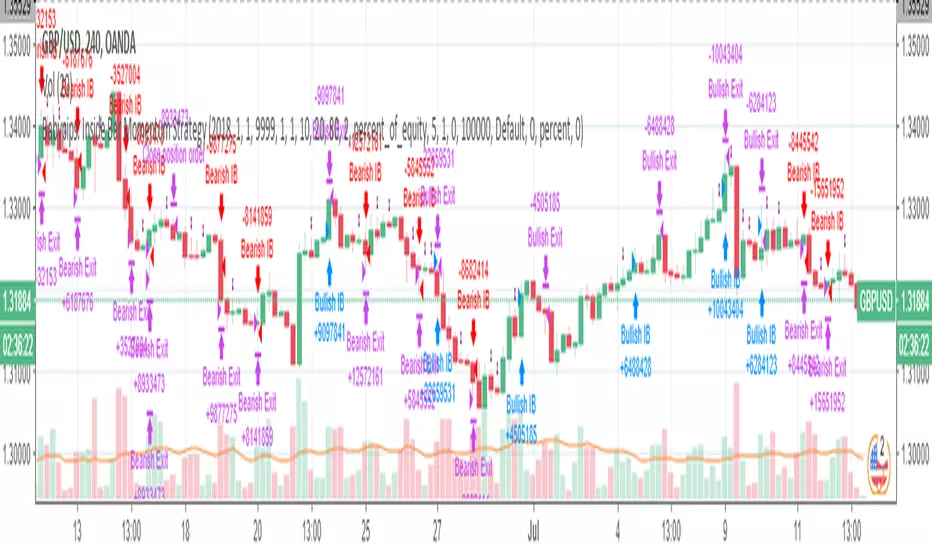
Babypips: Inside Bar Momentum StrategyThe strategy contained in this post comes courtesy of babypips (.com), an excellent resource for all thing forex related. If you are new to trading, the site is definitely worth checking out!
Code commentary and an introduction to Inside Bars are available for this post on the Backtest-Rookies (.com) website.
Note: If you are interested in custom development services, please check out our services page on the Backtest-Rookies site.
Strategy Overview
Inside Bar Momentum Strategy.
Inside Bar Detection
Position sizing based on stoploss distance ( Note: Based on equity and assumes that the account currency is the counter currency.
Stop buys for entries
Takeprofit / Stoplosses for exits
Control Stopbuy, Takeprofit and Stoploss targets with inputs
Control Backtest start/end dates

Inside Bar v2my second attempt in making inside bar indicator only change the color of the inside bar after the bar close (only truly change when new bar is formed) sigh.... i am not a coder anyway.
Multicross - golden/death cross indicator with inside barThis script utilizes five exponential moving averages, golden/death cross flags and inside bars. The EMAs are: 8,13,21,55 and 100. The cross flags appear when: 1st fastest crosses the 2nd fastest, 2nd fastest crosses the 3rd fastest and so on and so forth. Inside The script originated after I watched the youtube video with Philakone talking about swing trades. I started the the four EMAs he used and then decided to add the 100 to add a little more weight to the projected movements. I've noticed sometimes when inside bars and a golden crosses happen simultaneously the movements are more explosive.

Melak's All In One indicator(AIO)This script the following indicators.
Support and Resistance (lines)
MACD Crossover (Crossing arrow under each candle where MACD crosses)
50, 100, 200 Simple Moving Averages (orange lines)
10, 20 Exponential Moving Averages (turquoise and pink lines)
Doji reversals (turquoise candles)
Inside Bar (white diamonds under each inside bar candle)
TD time indicator (numbers on top of candles)

Inside Bars - Rob Dee editCatch Inside Bars with ease with this tool.
Adjust the colour and intensity of the indication candle.

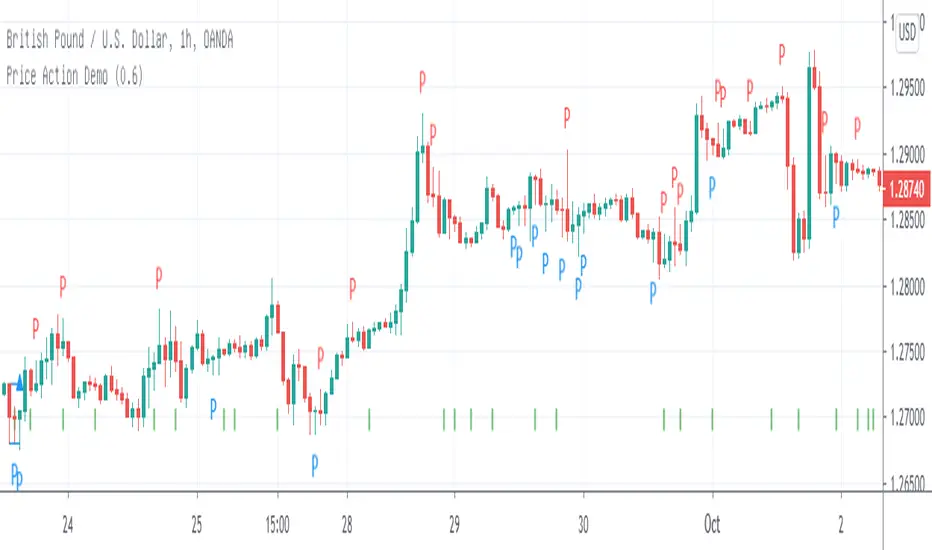
Price-Actionclassic patterns.
daily charts.
CPR-
Green+level=buy
red+level=sell
pinbar
green pinbar+level=buy
red pinbar+level=sell
green ppr+level=buy
ppr-
red ppr+level=sell
IB- and OB-
green IB/OB+level=buy
red IB/OB+level=sell
third bar
green third bar+green cpr+level=buy
red third bar+redcpr+level=sell
3 candles green = buy, tp30 pips(gbpusd,gbpjpy)
3 candles red = sell, tp30 pips. (gbpusd,gbpjpy)

Narrow Range + Inside Day, Short Only Strategy (by ChartArt)This short only strategy determines when there is both a NR7 (narrow range 7, a trading day in which the range is narrower than any of the previous six days), plus a inside day (high of the current day is lower than the high of the previous day and the low of the current day is higher than the low of the previous day) both on the same trading day and enters a short trade when the close is lower than the open and the slope of the simple moving average is downwards, too.
The strategy closes the short trade next time the daily close is lower than the open in any of the next trading days. In addition the NR7ID can be colored (the color is red when the close is lower that day than the open, else the color is green) and the SMA can be drawn with a color based on the direction of the SMA slope. To fine-tune the strategy it is highly recommended to change the period length of the SMA, which determines if the measured SMA slope is downwards or not. In this version 1.1 I made a small change to long only version. By default only the bearish NR7ID days are colored.
Inspiration:
How to trade NR7 and Inside Day Pattern
paststat.com
Code credit:
NR7 indicator script from Tradingview user Lazybear:
pastebin.com
P.S. You can find the 'long only' version of this trading strategy here:

Narrow Range + Inside Day, Long Only Strategy (by ChartArt)This long only strategy determines when there is both a NR7 (narrow range 7, a trading day in which the range is narrower than any of the previous six days), plus a inside day (high of the current day is lower than the high of the previous day and the low of the current day is higher than the low of the previous day) both on the same trading day and enters a long trade when the close is larger than the open and the slope of the simple moving average is upwards, too.
The strategy closes the long trade next time the daily close is larger than the open in any of the next trading days. In addition the NR7ID can be colored (the color is green when the close is larger that day than the open, else the color is red) and the SMA can be drawn with a color based on the direction of the SMA slope. To fine-tune the strategy it is highly recommended to change the period length of the SMA, which determines if the measured SMA slope is upwards or not.
Inspiration:
How to trade NR7 and Inside Day Pattern
paststat.com
Code credit:
NR7 indicator script from Tradingview user Lazybear:
pastebin.com
