Boyen_Multi EMA LTF HTFKey Features:
Short-Term Trend (Lower Timeframe - LTF):
EMA 13: A 13-period EMA that reacts quickly to recent price changes, ideal for capturing short-term momentum and early trend shifts.
EMA 21: A 21-period EMA offering a slightly smoother view of price action, balancing sensitivity and reliability for short-term analysis.
EMA 25: A 25-period EMA providing additional confirmation of short-term trends with a bit more lag for stability.
Medium-Term Trend:
SMA 100: A 100-period SMA that serves as a benchmark for medium-term trend direction, often used to gauge broader market sentiment and key levels.
Long-Term Trend (Higher Timeframe - HTF):
EMA 200: A 200-period EMA, widely recognized as a critical long-term trend indicator, helping traders assess the overall market bias.
SMA 300: A 300-period SMA for an even deeper perspective on long-term price movements, smoothing out noise to highlight major trends.
ค่าเฉลี่ยเคลื่อนที่แบบเอกซ์โพเนนเชียล (EMA)

Black OPS Pro Edition (White Knight) v1.0Black OPS Pro Edition (White Knight) v1.0
Black OPS Pro Edition (White Knight) v1.0 is a professional-grade educational trading tool designed for trend analysis, volatility measurement, and intrabar signal detection. It combines ATR-based volatility tracking, Bollinger Bands, EMA bounces, and stochastic filtering to provide clear visual cues on market movements.
Features:
ATR & Volatility Analysis: Tracks market volatility and directional movement.
Bollinger Bands: Upper, lower, and midline bands with smoothing to identify breakouts and pullbacks.
Trend Detection: Automatically identifies bullish, bearish, and neutral trends.
EMA Bounces: Detects price interactions with multiple EMA levels (1- 200).
Stochastic Filter: Confirms trend signals and helps reduce false alerts.
Visual Signals: Up 🚀 and down 💥 arrows for trend flips, plus EMA bounce indicators ⚔️ 🕵️.
Dashboard: Displays current volatility and trend strength.
Background Coloring: Highlights bullish and bearish periods.
Screen-Fixed Disclaimer: Table at the bottom-right with a permanent educational disclaimer.
User Customization:
Adjust ATR length, volatility lookback, Bollinger Band parameters, EMA settings, and other thresholds to fit your trading style.
Disclaimer:
For educational purposes only. This script does NOT provide financial advice or guarantee profits. Users are fully responsible for their own trading decisions and risk management. Always perform your own analysis before making trades.

Smart Trend IndicatorThis indicator is a decisive tool for identifying the trend of the script.
This trend identifies any change in trend as early as possible.
The indicator works ideally if a pivot or a prior pivot is broken, taking in consideration the EMA 21 and EMA 50 as fast and slow indicators respectively.
The indicator also uses a candle stick holding method to disregard and up and down moves created by volatility which would be a false indication on the chart.
A Combination of indicators such as ichimokou, Ema cross over, holding method and pivot methods make this indicator work as perfectly as possible.

Smart MA Zone Crossover [HMA-EMA]Smart MA Zone Crossover is a trend-following indicator designed to capture early momentum shifts using the crossover between Hull Moving Average (HMA) and Exponential Moving Average (EMA).
The indicator visually highlights trend direction using a dynamic colored zone, making it easy to identify bullish and bearish market phases at a glance.
🔸 Step 1: Moving Average Calculation
HMA (Hull Moving Average) → Faster, smoother, reacts quickly to price
EMA (Exponential Moving Average) → Stable trend reference
Both MA lengths are **fully adjustable** from the settings panel.
🔸 Step 2: Trend Detection
Bullish Trend: HMA is above EMA
Bearish Trend: HMA is below EMA
The area between the two averages is filled with color to visually represent the current trend state.
Step 3: Signal Generation (Non-Repainting)
Signals are generated **only on confirmed crossovers**:
✅ BUY Signal- HMA crosses above EMA
❌ SELL Signal-HMA crosses belowEMA
Signals do **not repaint** and appear only once per crossover.
🔸 Step 4: Visual Customization
Users can enable or disable:
* Moving average lines
* Colored MA zone fill
* Buy/Sell arrows
* Buy/Sell text labels
This allows the indicator to remain **minimal or detailed**, depending on user preference.
🔹 Key Features
✔ Non-repainting logic
✔ Clean crossover-based signals
✔ Customizable HMA & EMA lengths
✔ Optional MA zone fill
✔ Buy/Sell arrows & labels
✔ Works on all timeframes
✔ Beginner-friendly & scalper-ready
🔹 Best Use Cases
* Trend confirmation
* Momentum trading
* Scalping & intraday trading
* Swing trend filtering
For best results, combine with:
* Support & resistance
* Volume
* Higher-timeframe trend
🔹 Disclaimer
This indicator is provided for **educational purposes only**.
It is **not financial advice**. Always backtest and use proper risk management before trading live markets.

ES Signals (Sequencer Labels)Here i am using EMA crossover systems to catch the market. One can use this with their own choice.
Using Some simple rules, we can get some good quality trades! You can see for yourself before trading.
=== HOW TO USE THIS INDICATOR ===
1) Choose your market and timeframe. ( according to their need )
2) Choose if the strategy is long-only or bidirectional.
Don't overthink nobody knows the best answer of market. We're going to test and find out.
After you find a good combination, set up an alert system with the default Exponential Moving Average indicators provided by TradingView.
=== TIPS ===
Change the Time frame according to their need.
i) for intraday 3-5 minute.
ii) 60 minute for 3-4 days View
iii) Daily for positional
Try a Long-Only strategy to see if that performs better.

EMA Slope Angle V2 Auto Threshold# EMA Slope Angle Indicator
## Overview
The EMA Slope Angle Indicator visualizes the Exponential Moving Average (EMA) slope as an angle in degrees, providing traders with a clear, quantitative measure of trend strength and direction. The indicator features **automatic threshold calculation based on Gaussian distribution**, making it adaptive to any market and timeframe.
## Key Features
### 🎯 **Automatic Threshold Calculation (NEW!)**
- **Gaussian Distribution-Based**: Automatically calculates optimal thresholds from the 50% interquartile range (IQR) of historical angle data
- **Asset-Adaptive**: Thresholds adjust to each instrument's unique volatility and price characteristics
- **No Manual Tuning Required**: Simply enable "Use Auto Thresholds" and let the indicator optimize itself
### 📊 **Dynamic EMA Coloring**
- **Color Intensity**: EMA line color intensity reflects slope strength
- **Visual Feedback**:
- Green shades for uptrends (darker = stronger)
- Red shades for downtrends (darker = stronger)
- Gray for flat/neutral conditions
### 📈 **Regime Detection**
- **Three Regimes**: RISING, FALLING, and FLAT
- **Smart Classification**: Based on statistical distribution of angles
- **Non-Repainting**: All calculations use confirmed bars only
### 🔔 **Trend-Shift Signals**
- **Visual Arrows**: Automatic signals when transitioning from FLAT to RISING/FALLING
- **Configurable**: Enable/disable signals as needed
- **Reliable**: Only triggers on significant regime changes
### 📋 **KPI Dashboard**
- **Real-Time Metrics**: Current angle, regime, and last signal
- **Auto-Threshold Display**: Shows calculated thresholds when auto-mode is active
- **Statistics**: Optional angle distribution statistics
- **Clean Layout**: Top-right corner, non-intrusive
### 📊 **Angle Statistics (Optional)**
- **Distribution Analysis**: Histogram of angle ranges
- **Dynamic Buckets**: Automatically adjusts to data distribution when auto-mode is enabled
- **Percentage Breakdown**: See how often each angle range occurs
## Settings
### Main Settings
- **EMA Length**: Period for the Exponential Moving Average (default: 50)
- **Slope Lookback Bars**: Number of bars to calculate slope over (default: 5)
### Angle Settings
- **Use Auto Thresholds**: Enable automatic threshold calculation (recommended!)
- **Analysis Period**: Number of bars to analyze for distribution (default: 500)
- **Manual Thresholds**: Flat, Rising, and Falling triggers (used when auto-mode is off)
- **Max Angle for Color Saturation**: Maximum angle for color intensity scaling
### Display Options
- **Colors**: Customize uptrend, downtrend, and flat colors
- **Show Signals**: Enable/disable trend-shift arrows
- **Show Statistics**: Display angle distribution table
- **Show Dashboard**: Toggle KPI dashboard visibility
## How It Works
### Angle Calculation
The indicator calculates the angle between the current EMA value and the EMA value N bars ago:
```
Angle = arctan((EMA_now - EMA_then) / lookback) × 180° / π
```
### Auto-Threshold Calculation
When enabled, the indicator:
1. Analyzes historical angle data over the specified period
2. Calculates mean and standard deviation
3. Determines thresholds based on the 50% interquartile range (IQR):
- **Flat Threshold**: ±0.674σ (middle 50% of data)
- **Rising Trigger**: 75th percentile (mean + 0.674σ)
- **Falling Trigger**: 25th percentile (mean - 0.674σ)
### Regime Classification
- **FLAT**: Angle within ±Flat Threshold
- **RISING**: Angle ≥ Rising Trigger
- **FALLING**: Angle ≤ Falling Trigger
## Use Cases
### Trend Following
- Identify strong trends (high angle values)
- Spot trend reversals (regime changes)
- Filter trades based on trend strength
### Range Trading
- Detect flat/consolidation periods
- Avoid trading during choppy markets
- Enter when regime shifts from FLAT to RISING/FALLING
### Multi-Timeframe Analysis
- Apply to different timeframes for confirmation
- Use higher timeframe for trend direction
- Use lower timeframe for entry timing
## Tips for Best Results
1. **Enable Auto-Thresholds**: Let the indicator adapt to your instrument
2. **Adjust Analysis Period**: Use more bars for stable markets, fewer for volatile ones
3. **Combine with Price Action**: Use regime changes as confirmation, not standalone signals
4. **Multi-Timeframe**: Check higher timeframes for trend context
5. **Backtest First**: Test settings on historical data before live trading
## Technical Details
- **Non-Repainting**: All calculations use `barstate.isconfirmed`
- **Pine Script v6**: Latest version for optimal performance
- **Efficient**: Minimal computational overhead
- **Customizable**: Extensive settings for fine-tuning
## Version History
**v2.0** (Current)
- Added automatic threshold calculation based on Gaussian distribution
- Dynamic bucket adjustment for statistics
- Enhanced dashboard with auto-threshold display
- Improved regime detection using IQR method
**v1.0**
- Initial release with manual thresholds
- Basic EMA coloring
- Trend-shift signals
- KPI dashboard
## Support
For questions, suggestions, or bug reports, please leave a comment or contact the author.
---
**Disclaimer**: This indicator is for educational purposes only. Past performance does not guarantee future results. Always use proper risk management and never risk more than you can afford to lose.
**Keywords**: EMA, slope, angle, trend, automatic thresholds, Gaussian distribution, regime detection, non-repainting, adaptive

MultiTimeFrame SMA/EMA & clouds [PACHI]This will allow you to plot multiple moving averages and clouds for the current timeframe and also up to 5 from different timeframes

Trend Prediction Meter [PointAlgo]The Trend Prediction Meter & Levels is a composite market-bias and volatility visualization tool designed to summarize trend strength, momentum, price positioning, and volatility into a single normalized score.
It provides a structured framework to interpret directional bias and probable price expansion zones during active market conditions.
Concept Overview
Markets often reflect multiple conditions simultaneously—trend direction, momentum strength, price location within a range, and volatility.
This indicator combines these elements into a unified Bullish Score (0–100), displayed as a meter and supported by projected ATR-based levels.
Rather than focusing on a single signal, the script aims to present context about current market conditions.
Bullish Score Composition (0–100)
The meter represents a weighted blend of multiple market factors:
1. Trend Strength (EMA Structure)
Uses a fast and slow EMA to assess directional bias.
The distance between EMAs is normalized into a trend strength score.
Strong separation indicates directional conviction; compression suggests balance.
2. Momentum Strength (RSI Blend)
Combines a short-term and mid-term RSI.
Helps capture both immediate momentum and broader directional stability.
Higher readings indicate sustained bullish pressure, lower readings indicate bearish pressure.
3. Position Within Recent Range
Measures where price is trading relative to its recent high–low range.
Values near the top of the range reflect strength; values near the bottom reflect weakness.
Mid-range positioning indicates equilibrium.
4. Volume Participation
Compares current volume against its recent average.
Acts as a minor confidence modifier rather than a primary driver.
Each component is normalized and combined using fixed weights to produce a final Bullish Score between 0 and 100.
Bias Classification
The Bullish Score is translated into descriptive market states:
Extreme Bullish
Very Bullish
Bullish
Neutral
Bearish
Very Bearish
These labels describe current bias, not future certainty.
Meter Visualization
The meter plot dynamically changes color based on the score range.
A dashed midline at 50 represents balance.
Background shading highlights strong bullish or bearish dominance zones.
Crossovers of the 50-level indicate shifts in directional control.
ATR-Based Projection Levels:
To provide volatility context, the indicator calculates ATR-based upside and downside reference levels:
Two potential expansion levels (TP1 and TP2) are projected above and below price.
The distance of these levels adapts based on current bias strength.
These levels are contextual reference zones, not fixed targets.
Prediction Dashboard
An optional side table summarizes key readings at the most recent bar:
Symbol
Current bias label
Bullish Score
Current price
ATR value
Upside and downside projection levels
Directional comment (Upside favoured / Downside favoured / Balanced)
This dashboard is designed to provide a quick structural overview without requiring manual calculation.
Signals & Alerts
Built-in alerts are available for:
Bullish bias conditions
Bearish bias conditions
Bullish Score crossing above 50
Bullish Score crossing below 50
Alerts are informational and reflect internal state changes only.
Customization:
Users can adjust:
RSI lengths
EMA lengths
Range lookback period
ATR parameters
Display options for the meter and dashboard
This allows adaptation across different instruments and timeframes.
Usage Notes
Best suited for analytical interpretation rather than standalone decision-making.
Designed to complement price action, structure, or other indicators.
Works across multiple markets where volume and volatility data are available.
Disclaimer :
This indicator is intended for educational and analytical purposes only.
It does not provide investment, trading, or financial advice.
All signals and levels should be validated with independent analysis and appropriate risk management.

MA Crossovers (EMA + SMA)A versatile Moving Average tool designed to spot trends using a hybrid EMA/SMA setup. It provides clear visual signals and an on-chart trade simulator to track potential performance.
Features:
Hybrid Setup: Combines a fast EMA (Length 9) with three SMAs (50, 100, 150) for balanced trend detection.
4 Crossover Alerts: Monitors up to 4 different crossover pairs simultaneously with customizable markers.
Visual P&L Simulator: Automatically draws entry/exit lines and calculates Profit/Loss percentages for the primary crossover, helping you visualize trade potential.
Price Labels: Displays the exact price at every crossover point for precision.
Fully Customizable: extensive control over colors, opacity, line widths, and label positioning to keep your chart clean.

TrendSurfer Pro
TrendSurfer Pro 🚀 - Advanced Multi-Signal Trading Indicator
TrendSurfer Pro is a comprehensive all-in-one trading system that combines multiple proprietary algorithms and technical indicators to identify high-probability trading opportunities across all timeframes.
**Key Features:**
🔹 **Master Trend System** - Identifies major trend reversals using a combination of EMAs, RSI, and custom filters
🔹 **Smart Money Analysis** - Order Blocks detection with Z-Score impulse identification and rejection signals
🔹 **Session-Based Trading** - Tokyo, London, and New York session analysis with automatic breakout/rejection detection
🔹 **IFVG Detection** - Institutional Fair Value Gap identification for precision entries
🔹 **Multi-Timeframe Signals** - Triangle signals with volume analysis and VWAP proximity filtering
🔹 **KCandle/Boost System** - Advanced engulfing pattern detection with golden area projections
🔹 **CCI Signals** - Commodity Channel Index crosses with MACD confirmation filter
🔹 **Take Profit System** 🎯 - Advanced exit system combining 8 technical indicators (RSI, MACD, Stochastic, Bollinger Bands, Supertrend, CCI, EMA Cross, Price Action) with customizable confirmation requirements
**Unique Advantages:**
✅ Yellow Box Filter - Proprietary reversal zone detection
✅ Time Filters - Trade only during your preferred hours
✅ VWAP Integration - All signals respect price position relative to VWAP
✅ Customizable Alerts - Get notified for every signal type
✅ Visual Dashboard - Real-time trend confirmation table
Perfect for day traders, swing traders, and scalpers seeking precise entries and optimal exits! 🚀

Trend Fusion Indicator🎯 Trend Fusion Indicator🎯
Professional trading indicator combining EMA momentum with Supertrend volatility for high-probability signals.
📊KEY FEATURES:
• 9 EMA & Supertrend (10,3) crossover signals
• Visual trend direction with colored fills
• Buy/Sell arrows at crossover points
• Real-time trend tracking
• Clean, professional interface
⚡SIGNAL LOGIC:
✅ BUY: When EMA crosses ABOVE Supertrend
✅ SELL: When EMA crosses BELOW Supertrend
🎨VISUAL INDICATORS:
• Green Zone/Fill: Bullish trend (EMA > Supertrend)
• Red Zone/Fill: Bearish trend (EMA < Supertrend)
• Triangle Arrows: Entry signals
• Background Colors: Trend confirmation
⚙️CUSTOMIZABLE SETTINGS:
• EMA Length (Default: 9)
• Supertrend ATR Length (Default: 10)
• Supertrend Factor (Default: 3.0)
🔔ALERTS INCLUDED:
• Buy Alert: EMA crosses above Supertrend
• Sell Alert: EMA crosses below Supertrend
📈 BEST FOR:
• Swing Trading
• Day Trading
• Trend Following
• Market Reversals
⚠️ DISCLAIMER: This indicator is for educational purposes only.
Trading involves risk. Not financial advice. Use at your own risk.

SB - Ultimate Clean Trend Pro Uses dynamic Moving colour coding for spotting chage of bias. Use set up with keeping VWAP in reference.

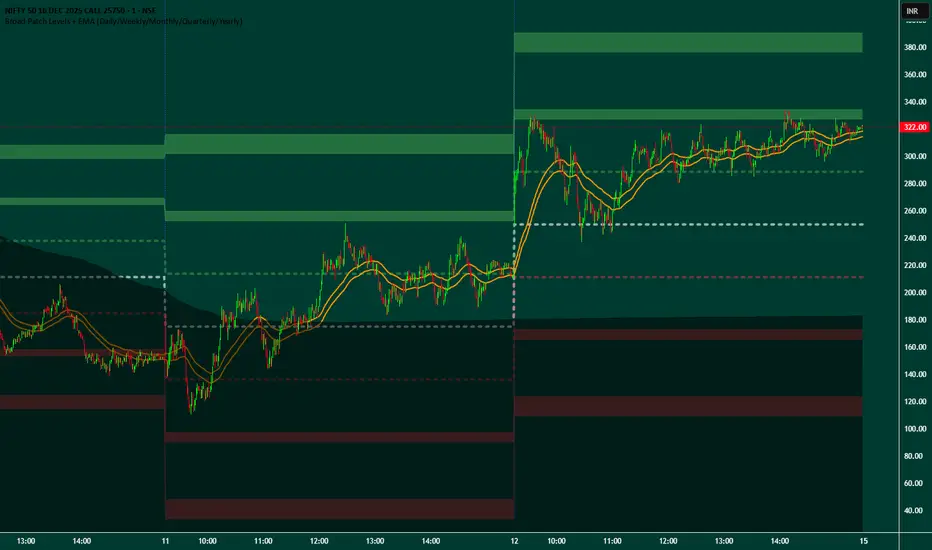
Broad Patch Levels + EMA (Daily/Weekly) with Directional AlertsThis indicator provides dynamic support and resistance levels along with trend guidance using EMA lines for daily or weekly timeframes. It is fully customizable, offering toggles for individual levels, trend lines, and alert notifications.
Key highlights:
Clearly visualize key market levels for potential trade entries and exits.
Monitor trend direction with EMA-based guidance.
Receive alerts when price interacts with important levels or trend zones.
Configurable visibility and alert options for a clean and personalized chart layout.
Ideal for professional traders looking for a structured, easy-to-read market perspective without exposing proprietary methods or calculations.
3 EMA with Alerts 2025This indicator plots three key EMAs (20, 50, and 200) directly on the chart, making it easy to track short-, medium-, and long-term trends. A color-coded table is displayed in the top-right corner for quick reference.
The script also includes smart alerts that trigger only when the state changes:
• 🔵 EMA 20 crossing above EMA 50 & EMA 200 → Bullish signal
• 🔴 EMA 20 crossing below EMA 50 & EMA 200 → Bearish signal
This tool is designed for traders who want clean visuals, reliable alerts, and simplified trend recognition in 2025 markets.

EMA Cross + 12 Indicator Dashboard (Candle Filter)🚀 Ultimate EMA Trend Intelligence + 12-Factor Dashboard
Stop trading blind crossovers. Most moving average strategies fail because they lack context. This script solves that by fusing a robust 6-EMA Trend System with a powerhouse “Consensus Engine” that tracks 12 leading indicators simultaneously.
Unlike standard indicators that repaint or react too fast, this tool utilizes a strict “2-Candle Confirmation Protocol” to filter out market noise and bull/bear traps.
🔥 Why This Indicator Give You an Edge:
🛡️ The “Fakeout Shield” (2-Candle Filter): Every signal is double-checked against the previous bar’s momentum. If the trend isn’t sustained, the signal doesn’t fire. No more getting trapped by wicks.
📊 Institutional-Grade Dashboard: Get a real-time HUD (Heads-Up Display) directly on your chart. Instantly see the bias of RSI, MACD, ADX, Bollinger Bands, Volume, and more without cluttering your screen with oscillating lines.
🎯 High-Probability Confluence: A Buy/Sell signal is ONLY generated when the EMAs cross AND a “Council of 12” indicators agrees on the direction (fully adjustable consensus threshold).
🧠 Smart Volume Integration: Volume must exceed 1.5x the average to validate a move, ensuring you’re trading with the smart money, not against it.
🛠️ Key Features:
6-EMA Ribbon Logic: Covers short-term (9/26) to long-term (60/85/200) trends.
Zero-Repaint Signals: Once a candle closes and the label appears, it stays.
Fully Customizable: Adjust the strictness (e.g., require 8 out of 12 indicators to agree) to fit your trading style—from Scalping to Swing Trading.
Ready to trade with clarity? Add this to your chart and let the consensus guide you.

Ultimate Trading System - DMA/EMA + Volume + Chart PatternsOVERVIEW
Ultimate Trading System (UTS) is a comprehensive technical analysis tool that combines multiple analysis methods into one powerful
indicator. It detects market structure, identifies chart patterns, analyzes volume, and provides actionable trade recommendations.
FEATURES
17 MOVING AVERAGES
• 6 DMAs (Simple): 5, 10, 20, 50, 100, 200
• 11 EMAs (Exponential): 5, 8, 9, 12, 20, 21, 34, 50, 100, 180, 200
• Smart labels with price values
• Golden Cross / Death Cross detection
CHART PATTERN DETECTION
• Triangles: Ascending, Descending, Symmetrical
• Reversals: Head & Shoulders, Double Top, Double Bottom
• Continuation: Bull Flag, Bear Flag
• Confidence scores for each pattern
VOLUME ANALYSIS
• Relative volume vs 20-period average
• Volume trend detection (rising/falling)
• Bullish/Bearish divergence alerts
• Volume confirmation for signals
SMART ANALYSIS TABLE
• Real-time pattern detection
• Probability-based confidence scores
• Clear trade recommendations
• Volume status and divergence warnings
MARKET STRUCTURE DETECTION
• ACCUMULATION - Strong bullish setup
• DISTRIBUTION - Strong bearish setup
• BULL SETUP - Favorable long conditions
• BEAR SETUP - Favorable short conditions
• TRANSITION - Market changing direction
• CHOPPY - Avoid trading
HOW TO USE
1. Check the analysis table for current market bias
2. Look for pattern confirmations (Triangle, H&S, Double Top/Bottom)
3. Verify volume is confirming the move (not diverging)
4. Follow the ACTION recommendation
5. Use MA levels for support/resistance and stop placement
RECOMMENDATIONS
• 80%+ Confidence = Strong signal, consider entry
• 60-80% Confidence = Look for entries on pullbacks
• 40-60% Confidence = Wait for confirmation
• <40% Confidence = Avoid trading
SETTINGS
• Toggle individual MAs on/off
• Customize colors for each MA
• Adjust label offsets
• Set alert sensitivity (Conservative/Medium/Aggressive)
• Show/hide background colors and analysis table
ALERTS
Set alerts for:
• Strong Buy/Sell signals
• Chart pattern detection
• Volume divergences
• Golden/Death crosses
BEST USED ON
• Stocks, Forex, Crypto, Indices
• Timeframes: 5min to Daily
• Works on all markets

EMA Slope Angle# EMA Slope Angle Indicator
A professional, non-repainting overlay indicator that visualizes EMA slope strength as an angle in degrees, providing instant visual feedback through dynamic EMA coloring and comprehensive trend analysis.
## ORIGINALITY
This indicator is original in its approach to slope measurement:
- **Angle-based calculation**: Uses arctangent to calculate slope as an angle in degrees (not percentage), providing a more intuitive measure of trend strength
- **Dynamic visual feedback**: Combines real-time EMA line coloring with regime detection, creating a continuous visual representation of market conditions
- **Comprehensive analysis**: Integrates angle-based trend shift signals with optional statistical analysis in a single, cohesive tool
- **Non-repainting design**: All calculations use confirmed bars only, ensuring reliable, deterministic output
## HOW IT WORKS
The indicator calculates the EMA slope angle using trigonometric functions:
```
Angle = arctan((EMA_current - EMA_past) / lookback_bars) × 180/π
```
This provides an intuitive measure where:
- **Steep angles** = strong trends (visualized with saturated colors)
- **Shallow angles** = weak trends (visualized with lighter colors)
- **Near-zero angles** = flat/consolidation (visualized in gray)
The EMA line color dynamically reflects:
- **Direction**: Green shades for uptrends, red shades for downtrends
- **Strength**: Color intensity based on normalized angle (stronger slopes = more saturated colors)
- **Regime**: Gray for flat conditions when angle is below threshold
## KEY FEATURES
### Dynamic EMA Coloring
- EMA line color changes continuously based on slope strength
- Color intensity reflects trend strength (50-100% opacity range)
- Instant visual feedback without cluttering the chart
### Regime Detection
- Automatically classifies market conditions: **RISING**, **FALLING**, or **FLAT**
- Configurable angle thresholds for regime classification
- Real-time regime updates on confirmed bars only
### Trend-Shift Signals
- Detects transitions from FLAT to RISING/FALLING regimes
- Visual arrows on chart when significant trend shifts occur
- Prevents signal spam by only triggering from FLAT state
- Configurable trigger thresholds for signal sensitivity
### KPI Dashboard
- Real-time angle display (rounded to 1 decimal place)
- Current regime status with color coding
- Last signal tracking (UP/DOWN/NONE)
- Positioned in top-right corner for easy reference
### Advanced Angle Statistics (Optional)
- Detailed breakdown of angle distribution across 9 granular buckets:
- 0-0.2°, 0.2-0.5°, 0.5-1°, 1-1.5°, 1.5-2°, 2-3°, 3-5°, 5-10°, >10°
- Shows count and percentage for each bucket
- Automatically resets on symbol/timeframe changes
- Useful for analyzing historical slope patterns
## SETTINGS
### Main Settings
- **EMA Length**: Period for exponential moving average (default: 50)
- **Slope Lookback Bars**: Number of bars to compare for slope calculation (default: 5)
### Angle Settings
- **Flat Angle Threshold**: Maximum angle for FLAT regime classification (default: 2.0°)
- **Rising Angle Trigger**: Minimum angle to trigger RISING regime and UP signals (default: 1.0°)
- **Falling Angle Trigger**: Maximum angle to trigger FALLING regime and DOWN signals (default: -1.0°)
- **Max Angle for Color Saturation**: Maximum angle for full color intensity (default: 30.0°)
### Display Options
- **Uptrend Color**: Color for rising trends (default: dark green)
- **Downtrend Color**: Color for falling trends (default: dark red)
- **Flat Color**: Color for flat conditions (default: gray)
- **Show Trend-Shift Signals**: Toggle signal arrows on/off (default: true)
- **Show Angle Statistics**: Toggle statistics dashboard on/off (default: false)
## NON-REPAINTING GUARANTEE
- All calculations use confirmed bars only (`barstate.isconfirmed`)
- No future bar references
- No higher timeframe calls using `request.security()`
- Deterministic output - what you see is what you get
- Reliable for backtesting and live trading
## USE CASES
- **Trend Identification**: Instantly identify trend strength and direction at a glance
- **Reversal Detection**: Spot trend reversals early through regime changes
- **Trade Filtering**: Filter trades based on slope strength and regime
- **Consolidation Monitoring**: Identify flat market conditions for range trading
- **Pattern Analysis**: Study historical angle distributions to understand market behavior
- **Momentum Assessment**: Gauge trend momentum through visual color intensity
## LIMITATIONS
- Angle calculation depends on EMA length and lookback period settings
- Regime classification is based on configurable thresholds - adjust to match your trading style
- Signals only trigger when transitioning from FLAT state to prevent spam
- Statistics reset on symbol/timeframe changes (by design)
- Color intensity is normalized to max angle setting - adjust for your market's typical ranges
## TECHNICAL NOTES
- Uses Pine Script v6
- Overlay indicator (plots on price chart)
- No external dependencies
- Compatible with all TradingView chart types
- Works on all timeframes and symbols
## DISCLAIMER
This indicator is designed for visual trend analysis and educational purposes. Always combine with other technical analysis tools, fundamental analysis, and proper risk management strategies. Past performance does not guarantee future results. Trading involves risk of loss.
---
**Perfect for**: Swing traders, day traders, trend followers, and market analysts seeking intuitive trend strength visualization.

EMA/Volume/Institutional Candle (Deep)This indicator is designed for short-term swing trading and intraday trend identification using a combination of EMA structure, momentum shifts, volume confirmation, and institutional footprint analysis.
🔹 Key Features
1. EMA Trend Framework (9, 20, 50, 200)
✔ EMA 9 & EMA 20: Ultra-short-term momentum; ideal for fast trend shifts.
✔ EMA 50: Medium-term trend guide; helps identify pullbacks vs. reversals.
✔ EMA 200: Long-term trend bias and major dynamic support/resistance.
2. EMA 9/20 Crossover Signal
✔ Bullish Crossover → EMA 9 crossing above EMA 20 indicates momentum expansion and early trend reversal.
✔ Bearish Crossover → EMA 9 crossing below EMA 20 shows momentum weakening and possible short-side opportunity.
3. High-Volume Zone Detection
✔ Highlights candles with volume spikes above average, signaling institutional interest.
✔ Useful for identifying breakout validity, liquidity grabs, or trap candles.
4. Institutional Candles (Smart Money Footprint)
✔ Automatically marks institutional order blocks, imbalance zones, or large displacement candles.
✔ Helps traders identify where smart money entered the market and potential mitigation zones.
🎯 How This Indicator Helps You Trade
✔ Quickly spot trend direction with multi-EMA alignment
✔ Identify high-probability entries with EMA 9/20 crossover + volume confirmation
✔ Find institutional zones for sniper-style entries
✔ Filter fake breakouts using volume spikes
✔ Perfect for stocks, indices, crypto, and forex

DR/IDR, fractals, break + EMA Clouds + VWAPThis indicator is a powerful, multi-layered trading tool that combines three distinct forms of market analysis—volume, trend, and opening volatility—onto a single chart.
1. Opening Range Breakout (ORB) System
This is the foundation of the indicator, designed to capture the initial volatility and set key price boundaries for the trading day.
Time Focus: The indicator's primary analysis is centered on a specific, user-defined time period (default is 9:30 AM to 10:30 AM New York Time). Nothing related to the ORB drawing will appear on the chart before this session starts.
Wick High/Low (The Trigger): These lines track the absolute highest and lowest prices reached during the time window. They define the full extent of the initial range and are used to determine when a genuine breakout occurs.
Body High/Low (The Range & Targets): These lines track the highest and lowest open/close prices of the candles within the session. This area forms the central, shaded zone, representing the core consolidation area.
Range Shading: The background between the Body High and Body Low is shaded, but this visual feature only appears during the active forming time window (e.g., 9:30 AM to 10:30 AM) to maintain chart clarity.
Fractals: While the range is forming, the indicator detects 5-bar Williams Fractal patterns that occur inside the range. These small triangles (▲ or ▼) highlight minor reversal points established by the early trading action.
Breakout Signal: After the user-defined time window closes, the indicator waits. If a subsequent candle's price moves above the Wick High or below the Wick Low, a "BREAK" label is displayed on that candle. It is programmed to label only the first decisive break in each direction per day.
Extension Targets: When a breakout occurs, target lines are automatically projected above the Body High (for a bullish break) or below the Body Low (for a bearish break). The distance between these targets is calculated based on a user-defined fraction (e.g., 0.5 steps) of the total height of the Body Range.
Line Cutoff: For tidiness, you can set a "Stop Time" (e.g., 4:00 PM) after which the ORB lines will automatically disappear.
2. EMA Clouds (Trend and Momentum)
Four distinct Exponential Moving Average (EMA) clouds are plotted to provide a dynamic, multi-speed view of the market's trend and momentum.
Structure: Each "Cloud" is the shaded area between two EMAs (one shorter length and one longer length). The indicator includes four customizable pairs (defaulting to common settings like 8/9, 8/14, 34/50, and 14/21).
Trend Coloring: The clouds are color-coded:
Bullish (Greenish): The shorter EMA is trading above the longer EMA, signaling upward momentum.
Bearish (Reddish): The shorter EMA is trading below the longer EMA, signaling downward momentum.
Application: These clouds are used to confirm the overall market direction or identify potential zones of support and resistance.
3. Volume-Weighted Average Price (VWAP)
The VWAP is a crucial anchor for measuring the market's efficiency throughout the trading day.
Function: It calculates the average price of the asset, giving more weight to prices where higher volume was traded.
Context: It helps traders quickly determine if the current price is trading at a premium (above VWAP) or a discount (below VWAP) relative to the day's volume.
Reset: The VWAP line automatically resets at the beginning of each trading day.
Customization: The VWAP line can be toggled on or off, and its color and width are fully adjustable.

Triple Moving Average's EMA/SMAThis Pine Script in its final v5 version is a fundamental visual tool that supports traders in quickly identifying the trend and sentiment.
Key Script Goal
This script's primary objective is flexible multi-timeframe analysis of the trend.
The script serves as a universal set of three independent moving averages, which is intended to help you with the visual assessment of the market context:
EMA (20 periods): Serves as dynamic support/resistance for short-term sentiment. It is highly sensitive to recent price action.
SMA1 (50 periods): Typically acts as a medium-term trend indicator. It is often used to identify corrections.
SMA2 (100 periods): Provides a long-term perspective. Its slope and position relative to the price indicate the dominant structural trend.
The script is a base for every trader who relies on technical analysis and Price Action, utilizing moving averages as dynamic S/R levels.

Trinity Ultimate 10 MA Ribbons)I got tired of trying to find a multi MA ribbon that could also color change and allow different types, if it exists then I could not find it... So here it is...
The **Trinity Ultimate 10 MA Ribbon** is a highly customizable, professional-grade moving average ribbon that combines extreme flexibility with beautiful visual feedback. Designed for traders who want full control without sacrificing clarity, it allows you to build a ribbon using up to ten completely independent moving averages — each with its own length, type, color, thickness, and visibility setting — while automatically coloring both the lines and the fills according to bullish or bearish conditions.
### Key Features
- Ten fully independent moving averages that can be mixed and matched exactly as you want.
- Each MA has its own selectable type: EMA (default), SMA, WMA, HMA, RMA, VWMA, or ALMA — perfect for combining fast EMAs with a slow HMA or a classic 200-period SMA.
- Every single MA line automatically changes color in real time: bright green when price is above the MA (bullish) and red when price is below the MA (bearish), making trend strength instantly visible across all timeframes.
- Smart, reactive ribbon fills that appear only between consecutive enabled MAs. Turn any MA on or off and the fills instantly adjust — no gaps, no broken bands, no manual rework.
- Nine layered fills with individually adjustable transparency (default is gradually increasing transparency from the fastest to the slowest MA), creating a smooth, depth-like ribbon effect that looks stunning on any chart background.
- Fill color itself is dynamic: green for bullish candles (close > open) and red for bearish candles, or you can customize both colors to any shade you prefer.
- Full control over every visual element: base colors, line thickness (1–10), lengths, and show/hide toggles for each of the ten MAs.
- Clean and lightweight code that compiles instantly in Pine Script v5 and works on all markets and timeframes without lag.
In short, this is the most flexible and visually informative moving-average ribbon available on TradingView today. Whether you want a classic 9-EMA ribbon, a Guppy-style multiple-timeframe setup, a hybrid EMA/HMA mix, or just three or four key levels, the indicator adapts perfectly while always telling you at a glance where the bulls and bears are in control.

Quicksilver Master Terminal [Institutional]Overview
The Quicksilver Master Terminal is a comprehensive data visualization interface designed to bring institutional-grade market awareness to the retail chart. It replaces the need for multiple cluttered indicators by consolidating Trend, Momentum, Volatility, and Structure into a single Heads-Up Display (HUD).
Designed by Quicksilver Algo Systems, this tool is engineered for precision scalpers and prop firm traders who require instant situational awareness without switching timeframes.
Features
1. The Institutional HUD (Heads-Up Display)
Located in the top-right corner, this live dashboard provides real-time metrics on:
Market Structure: Instantly identifies if the asset is in a Bullish or Bearish regime relative to the 200 EMA.
Momentum Status: Tracks overbought/oversold conditions using smoothed Stochastic logic.
Volatility (ATR): Displays live Average True Range data for precise Stop Loss placement.
Volume Flow: Detects institutional volume spikes (1.5x average).
2. The Trend Cloud
A dynamic visual ribbon that fills the space between the Fast EMA (50) and Slow EMA (200).
Green Cloud: Strong Bullish Trend (Look for Longs).
Red Cloud: Strong Bearish Trend (Look for Shorts).
Cross: Visual warning of trend reversals.
3. Sniper Signal Logic
The script paints "INSTITUTIONAL BUY" and "INSTITUTIONAL SELL" labels only when high-probability confluence occurs:
Exhaustion: Stochastic RSI breaches extreme levels (<20 or >80).
Confirmation: Price action aligns with Heikin Ashi smoothing to filter noise.
Momentum: Fast %K crosses Slow %D.
How to Use
For Scalping (1m - 5m): Wait for the Trend Cloud to align with the Signal. Take "BUY" signals only when the Cloud is Green.
For Risk Management: Use the live "Volatility" number in the HUD to set your Stop Loss (e.g., 1.5x the current Volatility value).
About the Developer
This script is part of the Quicksilver Ecosystem. We build algorithmic solutions focused on capital preservation and risk management for funded traders.
Disclaimer: This tool is for educational market analysis only. Past performance is not indicative of future results.

MA and EMA Cross [Pure Strategy]Simple EMA/SMA Crossover
This indicator signals BUY or SELL entries when the Fast EMA crosses the Slow SMA.
✅ Best For: Catching the start of strong trends.
⚠️ Warning: May give false signals in sideways (choppy) markets.
💡 Tip: Use this as a secondary confirmation for your existing strategy, rather than a standalone tool.
