Institutional Execution Engine v3 [Nishith Rajwar]
Institutional Execution Engine v3
Market-Structure-Driven Execution Framework (Indicator + Strategy Hybrid)
The **Institutional Execution Engine v3** is a professional-grade execution framework designed to model **how institutional participants interact with liquidity, volatility regimes, and market structure**.
It is built for **index traders, crypto traders, and systematic intraday participants** who require **non-repainting, forward-validated signals** with strict risk control.
This is **not a mashup of indicators**.
Every module is purpose-built and interacts through a unified execution pipeline.
---
🔍 Core Concepts & Methodology
1️⃣ Market Structure & POI Engine
* Identifies **Points of Interest (POIs)** using swing structure, volatility context, and liquidity positioning
* POIs are **confirmed only after bar close** (strict non-repaint enforcement)
* Adaptive pivot sensitivity based on selected execution preset
2️⃣ Liquidity-Aware Scoring System
Each potential trade is filtered through a **multi-factor execution score**, including:
* Structural alignment
* Volatility normalization (ATR regime)
* Liquidity reaction quality
* Directional efficiency
Trades are only allowed when the **minimum institutional score threshold** is met.
3️⃣ Regime Detection (Forward-Walk Safe)
The engine dynamically classifies market conditions into execution regimes:
* Trending
* Rotational
* Mean-reverting
Regime detection is **forward-walk compatible** and does **not leak future data**.
4️⃣ Risk-First Execution Model
* ATR-normalized stop placement
* R-multiple-based take-profit targeting
* Optional **single-trade-per-session guard**
* Strategy engine includes **open-trade protection** to prevent over-execution
5️⃣ Strategy + Indicator Hybrid
This script can be used in **two ways**:
* **Indicator mode** → discretionary execution with visual POIs, signals, and context
* **Strategy mode** → systematic backtesting with full TradingView Strategy Tester support
Both modes share the **same execution logic** (no divergence).
---
⚙️ Preset-Driven Architecture
Built-in execution presets auto-configure internal parameters without changing core logic:
* **Scalp (Index)**
* **Daytrade (Index)**
* **Crypto Intraday**
* **Institutional Research (FWalk)**
Presets adjust pivot sensitivity, score thresholds, ATR behavior, and risk profile — while preserving execution integrity.
---
## 🚫 Non-Repainting & Data Integrity
* No look-ahead bias
* No future bar references
* No repainting signals
* VWAP and regime logic reset correctly per session
* Safe handling of strategy.opentrades to avoid execution errors
All signals are **bar-close confirmed**.
---
📊 Who This Is For
✔ Index traders (NIFTY / BANKNIFTY / SENSEX)
✔ Crypto intraday traders
✔ Systematic traders validating execution logic
✔ Traders who value **structure + liquidity + risk discipline** over indicators
---
⚠️ Disclaimer
This script is a **research and execution framework**, not financial advice.
Always forward-test and adapt risk parameters to your instrument and timeframe.
---
**Author:** Nishith Rajwar
**Version:** v3
**Execution Philosophy:** Trade where institutions execute — not where indicators react.
รูปแบบชาร์ต

Ribbon Cross Strategy This strategy uses a simple moving-average ribbon crossover system with a customizable entry filter. You can choose whether trades trigger near the fast or slow average, allowing flexibility in capturing early or confirmed trend moves.
It’s best suited for index trading on intraday timeframes , helping identify short-term trend reversals and continuations with clear visual cues and backtestable logic.

ARVEXV1“Failed Reversal – Opposite Candle Only (No Doji/Hammer/Hanging Man)”:
This strategy captures failed reversal attempts where the current candle is opposite to the previous candle and volume is higher. It enters long if a bearish candle fails to break a previous bullish candle’s low, and short if a bullish candle fails to break a previous bearish candle’s high. Signals are canceled for Doji, Hammer, or Hanging Man candles. Entries only, fully backtestable.

ARVEX V1“Failed Reversal – Opposite Candle Only (No Doji/Hammer/Hanging Man)”:
This strategy captures failed reversal attempts where the current candle is opposite to the previous candle and volume is higher. It enters long if a bearish candle fails to break a previous bullish candle’s low, and short if a bullish candle fails to break a previous bearish candle’s high. Signals are canceled for Doji, Hammer, or Hanging Man candles. Entries only, fully backtestable.

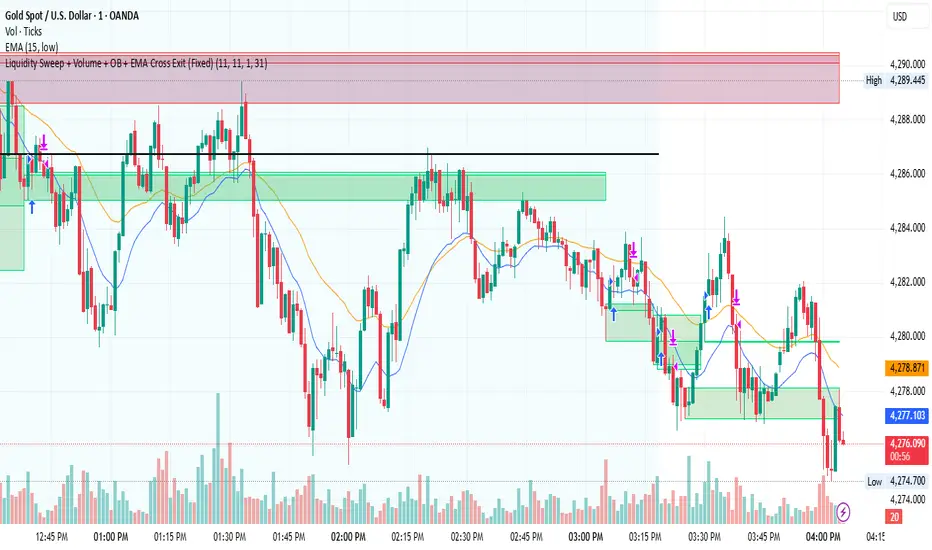
Liquidity Sweep + Volume + OB + EMA Cross Exit This strategy is a smart-money–inspired trading system designed to capture high-probability reversals after liquidity is taken from the market.
It combines liquidity sweeps, volume confirmation, order block validation, and a dynamic EMA-based exit to control risk and let profits run.
Core Concept
Institutions first take liquidity, then move price in the real direction.
This strategy aims to enter after liquidity is swept and price shows confirmation.
1️⃣ Liquidity Sweep Detection
2️⃣ Volume Confirmation
3️⃣ Order Block Identification
4️⃣ EMA Trend Filter (Optional Entry Bias)
5️⃣ Trade Entry Logic
6️⃣ Exit Strategy – EMA Cross Exit
Benefits:
Lets strong trends run
Exits automatically when momentum weakens
Adapts to different market conditions
🛡 Risk & Trade Management
One trade at a time (anti-overtrading logic)
Early exit if trade moves against position after a few bars
Opposite signal forces exit
EMA cross provides trend-based exit
GOLD 5m PA ScalperXAUUSD 5-Minute Price Action Scalper with HTF Confirmation
This Pine Script is a trend-following scalping strategy designed specifically for XAUUSD (Gold) on the 1,3,5-minute timeframe.
Its main goal is to reduce noise and false signals by combining lower-timeframe price action with higher-timeframe (15-minute) structure.
CORE IDEA
Trade only in the direction of the dominant trend and only when price reacts from a strong higher-timeframe Order Block.

MNO_2Step_Strategy_MOU_KAKU (Publish-Clear)//@version=5
strategy("MNO_2Step_Strategy_MOU_KAKU (Publish-Clear)", overlay=true, pyramiding=0,
max_labels_count=500, max_lines_count=500,
initial_capital=100000,
default_qty_type=strategy.percent_of_equity, default_qty_value=10)
// =========================
// Inputs
// =========================
emaSLen = input.int(5, "EMA Short (5)")
emaMLen = input.int(13, "EMA Mid (13)")
emaLLen = input.int(26, "EMA Long (26)")
macdFast = input.int(12, "MACD Fast")
macdSlow = input.int(26, "MACD Slow")
macdSignal = input.int(9, "MACD Signal")
macdZeroTh = input.float(0.2, "MOU: MACD near-zero threshold", step=0.05)
volLookback = input.int(5, "Volume MA days", minval=1)
volMinRatio = input.float(1.3, "MOU: Volume ratio min", step=0.1)
volStrong = input.float(1.5, "Strong volume ratio (Breakout/KAKU)", step=0.1)
volMaxRatio = input.float(3.0, "Volume ratio max (filter)", step=0.1)
wickBodyMult = input.float(2.0, "Pinbar: lowerWick >= body*x", step=0.1)
pivotLen = input.int(20, "Resistance lookback", minval=5)
pullMinPct = input.float(5.0, "Pullback min (%)", step=0.1)
pullMaxPct = input.float(15.0, "Pullback max (%)", step=0.1)
breakLookbackBars = input.int(5, "Pullback route: valid bars after break", minval=1)
// --- Breakout route (押し目なし初動ブレイク) ---
useBreakoutRoute = input.bool(true, "Enable MOU Breakout Route (no pullback)")
breakConfirmPct = input.float(0.3, "Break confirm: close > R*(1+%)", step=0.1)
bigBodyLookback = input.int(20, "Break candle body MA length", minval=5)
bigBodyMult = input.float(1.2, "Break candle: body >= MA*mult", step=0.1)
requireCloseNearHigh = input.bool(true, "Break candle: close near high")
closeNearHighPct = input.float(25.0, "Close near high threshold (% of range)", step=1.0)
allowMACDAboveZeroInstead = input.bool(true, "Breakout route: allow MACD GC above zero instead")
// 表示
showEMA = input.bool(true, "Plot EMAs")
showMouLabels = input.bool(true, "Show MOU/MOU-B labels")
showKakuLabels = input.bool(true, "Show KAKU labels")
showDebugTbl = input.bool(true, "Show debug table (last bar)")
showStatusLbl = input.bool(true, "Show status label (last bar always)")
locChoice = input.string("Below Bar", "Label location", options= )
lblLoc = locChoice == "Below Bar" ? location.belowbar : location.abovebar
// =========================
// 必ず決済が起きる設定(投稿クリア用)
// =========================
enableTPSL = input.bool(true, "Enable TP/SL")
tpPct = input.float(2.0, "Take Profit (%)", step=0.1, minval=0.1) // ←投稿クリア向けに近め
slPct = input.float(1.0, "Stop Loss (%)", step=0.1, minval=0.1) // ←投稿クリア向けに近め
maxHoldBars = input.int(30, "Max bars in trade (force close)", minval=1)
entryMode = input.string("MOU or KAKU", "Entry trigger", options= )
// ✅ 保険:トレード0件を避ける(投稿クリア用)
// 1回でもクローズトレードができたら自動で沈黙
publishAssist = input.bool(true, "Publish Assist (safety entry if 0 trades)")
// =========================
// EMA
// =========================
emaS = ta.ema(close, emaSLen)
emaM = ta.ema(close, emaMLen)
emaL = ta.ema(close, emaLLen)
plot(showEMA ? emaS : na, color=color.new(color.yellow, 0), title="EMA 5")
plot(showEMA ? emaM : na, color=color.new(color.blue, 0), title="EMA 13")
plot(showEMA ? emaL : na, color=color.new(color.orange, 0), title="EMA 26")
emaUpS = emaS > emaS
emaUpM = emaM > emaM
emaUpL = emaL > emaL
goldenOrder = emaS > emaM and emaM > emaL
above26_2days = close > emaL and close > emaL
baseTrendOK = (emaUpS and emaUpM and emaUpL) and goldenOrder and above26_2days
// =========================
// MACD
// =========================
= ta.macd(close, macdFast, macdSlow, macdSignal)
macdGC = ta.crossover(macdLine, macdSig)
macdUp = macdLine > macdLine
macdNearZero = math.abs(macdLine) <= macdZeroTh
macdGCAboveZero = macdGC and macdLine > 0 and macdSig > 0
macdMouOK = macdGC and macdNearZero and macdUp
macdBreakOK = allowMACDAboveZeroInstead ? (macdMouOK or macdGCAboveZero) : macdMouOK
// =========================
// Volume
// =========================
volMA = ta.sma(volume, volLookback)
volRatio = volMA > 0 ? (volume / volMA) : na
volumeMouOK = volRatio >= volMinRatio and volRatio <= volMaxRatio
volumeStrongOK = volRatio >= volStrong and volRatio <= volMaxRatio
// =========================
// Candle patterns
// =========================
body = math.abs(close - open)
upperWick = high - math.max(open, close)
lowerWick = math.min(open, close) - low
pinbar = (lowerWick >= wickBodyMult * body) and (lowerWick > upperWick) and (close >= open)
bullEngulf = close > open and close < open and close >= open and open <= close
bigBull = close > open and open < emaM and close > emaS and (body > ta.sma(body, 20))
candleOK = pinbar or bullEngulf or bigBull
// =========================
// Resistance / Pullback route
// =========================
res = ta.highest(high, pivotLen)
pullbackPct = res > 0 ? (res - close) / res * 100.0 : na
pullbackOK = pullbackPct >= pullMinPct and pullbackPct <= pullMaxPct
brokeRes = ta.crossover(close, res )
barsSinceBreak = ta.barssince(brokeRes)
afterBreakZone = (barsSinceBreak >= 0) and (barsSinceBreak <= breakLookbackBars)
pullbackRouteOK = afterBreakZone and pullbackOK
// =========================
// Breakout route (押し目なし初動ブレイク)
// =========================
breakConfirm = close > res * (1.0 + breakConfirmPct / 100.0)
bullBreak = close > open
bodyMA = ta.sma(body, bigBodyLookback)
bigBodyOK = bodyMA > 0 ? (body >= bodyMA * bigBodyMult) : false
rng = math.max(high - low, syminfo.mintick)
closeNearHighOK = not requireCloseNearHigh ? true : ((high - close) / rng * 100.0 <= closeNearHighPct)
mou_breakout = useBreakoutRoute and baseTrendOK and breakConfirm and bullBreak and bigBodyOK and closeNearHighOK and volumeStrongOK and macdBreakOK
mou_pullback = baseTrendOK and volumeMouOK and candleOK and macdMouOK and pullbackRouteOK
mou = mou_pullback or mou_breakout
// =========================
// KAKU (Strict): 8条件 + 最終三点
// =========================
cond1 = emaUpS and emaUpM and emaUpL
cond2 = goldenOrder
cond3 = above26_2days
cond4 = macdGCAboveZero
cond5 = volumeMouOK
cond6 = candleOK
cond7 = pullbackOK
cond8 = pullbackRouteOK
all8_strict = cond1 and cond2 and cond3 and cond4 and cond5 and cond6 and cond7 and cond8
final3 = pinbar and macdGCAboveZero and volumeStrongOK
kaku = all8_strict and final3
// =========================
// Entry (strategy)
// =========================
entrySignal = entryMode == "KAKU only" ? kaku : (mou or kaku)
canEnter = strategy.position_size == 0
newEntryKaku = canEnter and kaku and entrySignal
newEntryMouB = canEnter and (not kaku) and mou_breakout and entrySignal
newEntryMou = canEnter and (not kaku) and mou_pullback and entrySignal
// --- Publish Assist(保険エントリー) ---
// 条件が厳しすぎて「トレード0件」だと投稿時に警告が出る。
// closedtradesが0の間だけ、軽いEMAクロスで1回だけ拾う(その後は沈黙)。
assistFast = ta.ema(close, 5)
assistSlow = ta.ema(close, 20)
assistEntry = publishAssist and strategy.closedtrades == 0 and canEnter and ta.crossover(assistFast, assistSlow)
// 実エントリー
if newEntryKaku or newEntryMouB or newEntryMou or assistEntry
strategy.entry("LONG", strategy.long)
// ラベル(視認)
if showMouLabels and newEntryMou
label.new(bar_index, low, "猛(IN)", style=label.style_label_up, color=color.new(color.lime, 0), textcolor=color.black)
if showMouLabels and newEntryMouB
label.new(bar_index, low, "猛B(IN)", style=label.style_label_up, color=color.new(color.lime, 0), textcolor=color.black)
if showKakuLabels and newEntryKaku
label.new(bar_index, low, "確(IN)", style=label.style_label_up, color=color.new(color.yellow, 0), textcolor=color.black)
if assistEntry
label.new(bar_index, low, "ASSIST(IN)", style=label.style_label_up, color=color.new(color.aqua, 0), textcolor=color.black)
// =========================
// Exit (TP/SL + 強制クローズ)
// =========================
inPos = strategy.position_size > 0
tpPx = inPos ? strategy.position_avg_price * (1.0 + tpPct/100.0) : na
slPx = inPos ? strategy.position_avg_price * (1.0 - slPct/100.0) : na
if enableTPSL
strategy.exit("TP/SL", from_entry="LONG", limit=tpPx, stop=slPx)
// 最大保有バーで強制決済(これが「レポート無し」回避の最後の保険)
var int entryBar = na
if strategy.position_size > 0 and strategy.position_size == 0
entryBar := bar_index
if strategy.position_size == 0
entryBar := na
forceClose = inPos and not na(entryBar) and (bar_index - entryBar >= maxHoldBars)
if forceClose
strategy.close("LONG")
// =========================
// 利確/損切/強制クローズのラベル
// =========================
closedThisBar = (strategy.position_size > 0) and (strategy.position_size == 0)
avgPrev = strategy.position_avg_price
tpPrev = avgPrev * (1.0 + tpPct/100.0)
slPrev = avgPrev * (1.0 - slPct/100.0)
hitTP = closedThisBar and high >= tpPrev
hitSL = closedThisBar and low <= slPrev
// 同一足TP/SL両方は厳密に判断できないので、表示は「TP優先」で簡略(投稿ギリギリ版)
if hitTP
label.new(bar_index, high, "利確", style=label.style_label_down, color=color.new(color.lime, 0), textcolor=color.black)
else if hitSL
label.new(bar_index, low, "損切", style=label.style_label_up, color=color.new(color.red, 0), textcolor=color.white)
else if closedThisBar and forceClose
label.new(bar_index, close, "時間決済", style=label.style_label_left, color=color.new(color.gray, 0), textcolor=color.white)
// =========================
// Signals (猛/猛B/確)
// =========================
plotshape(showMouLabels and mou_pullback and not kaku, title="MOU_PULLBACK", style=shape.labelup, text="猛",
color=color.new(color.lime, 0), textcolor=color.black, location=lblLoc, size=size.tiny)
plotshape(showMouLabels and mou_breakout and not kaku, title="MOU_BREAKOUT", style=shape.labelup, text="猛B",
color=color.new(color.lime, 0), textcolor=color.black, location=lblLoc, size=size.tiny)
plotshape(showKakuLabels and kaku, title="KAKU", style=shape.labelup, text="確",
color=color.new(color.yellow, 0), textcolor=color.black, location=lblLoc, size=size.small)
// =========================
// Alerts
// =========================
alertcondition(mou, title="MNO_MOU", message="MNO: MOU triggered")
alertcondition(mou_breakout, title="MNO_MOU_BREAKOUT", message="MNO: MOU Breakout triggered")
alertcondition(mou_pullback, title="MNO_MOU_PULLBACK", message="MNO: MOU Pullback triggered")
alertcondition(kaku, title="MNO_KAKU", message="MNO: KAKU triggered")
alertcondition(assistEntry, title="MNO_ASSIST_ENTRY", message="MNO: ASSIST ENTRY (publish safety)")
// =========================
// Status label(最終足に必ず表示)
// =========================
var label status = na
if showStatusLbl and barstate.islast
label.delete(status)
statusTxt =
"MNO RUNNING " +
"ClosedTrades: " + str.tostring(strategy.closedtrades) + " " +
"BaseTrend: " + (baseTrendOK ? "OK" : "NO") + " " +
"MOU: " + (mou ? "YES" : "no") + " (猛=" + (mou_pullback ? "Y" : "n") + " / 猛B=" + (mou_breakout ? "Y" : "n") + ") " +
"KAKU: " + (kaku ? "YES" : "no") + " " +
"VolRatio: " + (na(volRatio) ? "na" : str.tostring(volRatio, format.mintick)) + " " +
"Pull%: " + (na(pullbackPct) ? "na" : str.tostring(pullbackPct, format.mintick)) + " " +
"Pos: " + (inPos ? "IN" : "OUT")
status := label.new(bar_index, high, statusTxt, style=label.style_label_left, textcolor=color.white, color=color.new(color.black, 0))
// =========================
// Debug table(最終足のみ)
// =========================
var table t = table.new(position.top_right, 2, 14, border_width=1, border_color=color.new(color.white, 60))
fRow(_name, _cond, _r) =>
bg = _cond ? color.new(color.lime, 70) : color.new(color.red, 80)
tx = _cond ? "OK" : "NO"
table.cell(t, 0, _r, _name, text_color=color.white, bgcolor=color.new(color.black, 0))
table.cell(t, 1, _r, tx, text_color=color.white, bgcolor=bg)
if showDebugTbl and barstate.islast
table.cell(t, 0, 0, "MNO Debug", text_color=color.white, bgcolor=color.new(color.black, 0))
table.cell(t, 1, 0, "", text_color=color.white, bgcolor=color.new(color.black, 0))
fRow("BaseTrend", baseTrendOK, 1)
fRow("MOU Pullback", mou_pullback, 2)
fRow("MOU Breakout", mou_breakout, 3)
fRow("Break confirm", breakConfirm, 4)
fRow("Break big body", bigBodyOK, 5)
fRow("Break close high", closeNearHighOK, 6)
fRow("Break vol strong", volumeStrongOK, 7)
fRow("Break MACD", macdBreakOK, 8)
fRow("KAKU all8", all8_strict, 9)
fRow("KAKU final3", final3, 10)
fRow("AssistEntry", assistEntry, 11)
fRow("ClosedTrades>0", strategy.closedtrades > 0, 12)

just takesi TimeMNO_2Step_Strategy_MOU_KAKU (Publish-Clear)//@version=5
strategy("MNO_2Step_Strategy_MOU_KAKU (Publish-Clear)", overlay=true, pyramiding=0,
max_labels_count=500, max_lines_count=500,
initial_capital=100000,
default_qty_type=strategy.percent_of_equity, default_qty_value=10)
// =========================
// Inputs
// =========================
emaSLen = input.int(5, "EMA Short (5)")
emaMLen = input.int(13, "EMA Mid (13)")
emaLLen = input.int(26, "EMA Long (26)")
macdFast = input.int(12, "MACD Fast")
macdSlow = input.int(26, "MACD Slow")
macdSignal = input.int(9, "MACD Signal")
macdZeroTh = input.float(0.2, "MOU: MACD near-zero threshold", step=0.05)
volLookback = input.int(5, "Volume MA days", minval=1)
volMinRatio = input.float(1.3, "MOU: Volume ratio min", step=0.1)
volStrong = input.float(1.5, "Strong volume ratio (Breakout/KAKU)", step=0.1)
volMaxRatio = input.float(3.0, "Volume ratio max (filter)", step=0.1)
wickBodyMult = input.float(2.0, "Pinbar: lowerWick >= body*x", step=0.1)
pivotLen = input.int(20, "Resistance lookback", minval=5)
pullMinPct = input.float(5.0, "Pullback min (%)", step=0.1)
pullMaxPct = input.float(15.0, "Pullback max (%)", step=0.1)
breakLookbackBars = input.int(5, "Pullback route: valid bars after break", minval=1)
// --- Breakout route (押し目なし初動ブレイク) ---
useBreakoutRoute = input.bool(true, "Enable MOU Breakout Route (no pullback)")
breakConfirmPct = input.float(0.3, "Break confirm: close > R*(1+%)", step=0.1)
bigBodyLookback = input.int(20, "Break candle body MA length", minval=5)
bigBodyMult = input.float(1.2, "Break candle: body >= MA*mult", step=0.1)
requireCloseNearHigh = input.bool(true, "Break candle: close near high")
closeNearHighPct = input.float(25.0, "Close near high threshold (% of range)", step=1.0)
allowMACDAboveZeroInstead = input.bool(true, "Breakout route: allow MACD GC above zero instead")
// 表示
showEMA = input.bool(true, "Plot EMAs")
showMouLabels = input.bool(true, "Show MOU/MOU-B labels")
showKakuLabels = input.bool(true, "Show KAKU labels")
showDebugTbl = input.bool(true, "Show debug table (last bar)")
showStatusLbl = input.bool(true, "Show status label (last bar always)")
locChoice = input.string("Below Bar", "Label location", options= )
lblLoc = locChoice == "Below Bar" ? location.belowbar : location.abovebar
// =========================
// 必ず決済が起きる設定(投稿クリア用)
// =========================
enableTPSL = input.bool(true, "Enable TP/SL")
tpPct = input.float(2.0, "Take Profit (%)", step=0.1, minval=0.1) // ←投稿クリア向けに近め
slPct = input.float(1.0, "Stop Loss (%)", step=0.1, minval=0.1) // ←投稿クリア向けに近め
maxHoldBars = input.int(30, "Max bars in trade (force close)", minval=1)
entryMode = input.string("MOU or KAKU", "Entry trigger", options= )
// ✅ 保険:トレード0件を避ける(投稿クリア用)
// 1回でもクローズトレードができたら自動で沈黙
publishAssist = input.bool(true, "Publish Assist (safety entry if 0 trades)")
// =========================
// EMA
// =========================
emaS = ta.ema(close, emaSLen)
emaM = ta.ema(close, emaMLen)
emaL = ta.ema(close, emaLLen)
plot(showEMA ? emaS : na, color=color.new(color.yellow, 0), title="EMA 5")
plot(showEMA ? emaM : na, color=color.new(color.blue, 0), title="EMA 13")
plot(showEMA ? emaL : na, color=color.new(color.orange, 0), title="EMA 26")
emaUpS = emaS > emaS
emaUpM = emaM > emaM
emaUpL = emaL > emaL
goldenOrder = emaS > emaM and emaM > emaL
above26_2days = close > emaL and close > emaL
baseTrendOK = (emaUpS and emaUpM and emaUpL) and goldenOrder and above26_2days
// =========================
// MACD
// =========================
= ta.macd(close, macdFast, macdSlow, macdSignal)
macdGC = ta.crossover(macdLine, macdSig)
macdUp = macdLine > macdLine
macdNearZero = math.abs(macdLine) <= macdZeroTh
macdGCAboveZero = macdGC and macdLine > 0 and macdSig > 0
macdMouOK = macdGC and macdNearZero and macdUp
macdBreakOK = allowMACDAboveZeroInstead ? (macdMouOK or macdGCAboveZero) : macdMouOK
// =========================
// Volume
// =========================
volMA = ta.sma(volume, volLookback)
volRatio = volMA > 0 ? (volume / volMA) : na
volumeMouOK = volRatio >= volMinRatio and volRatio <= volMaxRatio
volumeStrongOK = volRatio >= volStrong and volRatio <= volMaxRatio
// =========================
// Candle patterns
// =========================
body = math.abs(close - open)
upperWick = high - math.max(open, close)
lowerWick = math.min(open, close) - low
pinbar = (lowerWick >= wickBodyMult * body) and (lowerWick > upperWick) and (close >= open)
bullEngulf = close > open and close < open and close >= open and open <= close
bigBull = close > open and open < emaM and close > emaS and (body > ta.sma(body, 20))
candleOK = pinbar or bullEngulf or bigBull
// =========================
// Resistance / Pullback route
// =========================
res = ta.highest(high, pivotLen)
pullbackPct = res > 0 ? (res - close) / res * 100.0 : na
pullbackOK = pullbackPct >= pullMinPct and pullbackPct <= pullMaxPct
brokeRes = ta.crossover(close, res )
barsSinceBreak = ta.barssince(brokeRes)
afterBreakZone = (barsSinceBreak >= 0) and (barsSinceBreak <= breakLookbackBars)
pullbackRouteOK = afterBreakZone and pullbackOK
// =========================
// Breakout route (押し目なし初動ブレイク)
// =========================
breakConfirm = close > res * (1.0 + breakConfirmPct / 100.0)
bullBreak = close > open
bodyMA = ta.sma(body, bigBodyLookback)
bigBodyOK = bodyMA > 0 ? (body >= bodyMA * bigBodyMult) : false
rng = math.max(high - low, syminfo.mintick)
closeNearHighOK = not requireCloseNearHigh ? true : ((high - close) / rng * 100.0 <= closeNearHighPct)
mou_breakout = useBreakoutRoute and baseTrendOK and breakConfirm and bullBreak and bigBodyOK and closeNearHighOK and volumeStrongOK and macdBreakOK
mou_pullback = baseTrendOK and volumeMouOK and candleOK and macdMouOK and pullbackRouteOK
mou = mou_pullback or mou_breakout
// =========================
// KAKU (Strict): 8条件 + 最終三点
// =========================
cond1 = emaUpS and emaUpM and emaUpL
cond2 = goldenOrder
cond3 = above26_2days
cond4 = macdGCAboveZero
cond5 = volumeMouOK
cond6 = candleOK
cond7 = pullbackOK
cond8 = pullbackRouteOK
all8_strict = cond1 and cond2 and cond3 and cond4 and cond5 and cond6 and cond7 and cond8
final3 = pinbar and macdGCAboveZero and volumeStrongOK
kaku = all8_strict and final3
// =========================
// Entry (strategy)
// =========================
entrySignal = entryMode == "KAKU only" ? kaku : (mou or kaku)
canEnter = strategy.position_size == 0
newEntryKaku = canEnter and kaku and entrySignal
newEntryMouB = canEnter and (not kaku) and mou_breakout and entrySignal
newEntryMou = canEnter and (not kaku) and mou_pullback and entrySignal
// --- Publish Assist(保険エントリー) ---
// 条件が厳しすぎて「トレード0件」だと投稿時に警告が出る。
// closedtradesが0の間だけ、軽いEMAクロスで1回だけ拾う(その後は沈黙)。
assistFast = ta.ema(close, 5)
assistSlow = ta.ema(close, 20)
assistEntry = publishAssist and strategy.closedtrades == 0 and canEnter and ta.crossover(assistFast, assistSlow)
// 実エントリー
if newEntryKaku or newEntryMouB or newEntryMou or assistEntry
strategy.entry("LONG", strategy.long)
// ラベル(視認)
if showMouLabels and newEntryMou
label.new(bar_index, low, "猛(IN)", style=label.style_label_up, color=color.new(color.lime, 0), textcolor=color.black)
if showMouLabels and newEntryMouB
label.new(bar_index, low, "猛B(IN)", style=label.style_label_up, color=color.new(color.lime, 0), textcolor=color.black)
if showKakuLabels and newEntryKaku
label.new(bar_index, low, "確(IN)", style=label.style_label_up, color=color.new(color.yellow, 0), textcolor=color.black)
if assistEntry
label.new(bar_index, low, "ASSIST(IN)", style=label.style_label_up, color=color.new(color.aqua, 0), textcolor=color.black)
// =========================
// Exit (TP/SL + 強制クローズ)
// =========================
inPos = strategy.position_size > 0
tpPx = inPos ? strategy.position_avg_price * (1.0 + tpPct/100.0) : na
slPx = inPos ? strategy.position_avg_price * (1.0 - slPct/100.0) : na
if enableTPSL
strategy.exit("TP/SL", from_entry="LONG", limit=tpPx, stop=slPx)
// 最大保有バーで強制決済(これが「レポート無し」回避の最後の保険)
var int entryBar = na
if strategy.position_size > 0 and strategy.position_size == 0
entryBar := bar_index
if strategy.position_size == 0
entryBar := na
forceClose = inPos and not na(entryBar) and (bar_index - entryBar >= maxHoldBars)
if forceClose
strategy.close("LONG")
// =========================
// 利確/損切/強制クローズのラベル
// =========================
closedThisBar = (strategy.position_size > 0) and (strategy.position_size == 0)
avgPrev = strategy.position_avg_price
tpPrev = avgPrev * (1.0 + tpPct/100.0)
slPrev = avgPrev * (1.0 - slPct/100.0)
hitTP = closedThisBar and high >= tpPrev
hitSL = closedThisBar and low <= slPrev
// 同一足TP/SL両方は厳密に判断できないので、表示は「TP優先」で簡略(投稿ギリギリ版)
if hitTP
label.new(bar_index, high, "利確", style=label.style_label_down, color=color.new(color.lime, 0), textcolor=color.black)
else if hitSL
label.new(bar_index, low, "損切", style=label.style_label_up, color=color.new(color.red, 0), textcolor=color.white)
else if closedThisBar and forceClose
label.new(bar_index, close, "時間決済", style=label.style_label_left, color=color.new(color.gray, 0), textcolor=color.white)
// =========================
// Signals (猛/猛B/確)
// =========================
plotshape(showMouLabels and mou_pullback and not kaku, title="MOU_PULLBACK", style=shape.labelup, text="猛",
color=color.new(color.lime, 0), textcolor=color.black, location=lblLoc, size=size.tiny)
plotshape(showMouLabels and mou_breakout and not kaku, title="MOU_BREAKOUT", style=shape.labelup, text="猛B",
color=color.new(color.lime, 0), textcolor=color.black, location=lblLoc, size=size.tiny)
plotshape(showKakuLabels and kaku, title="KAKU", style=shape.labelup, text="確",
color=color.new(color.yellow, 0), textcolor=color.black, location=lblLoc, size=size.small)
// =========================
// Alerts
// =========================
alertcondition(mou, title="MNO_MOU", message="MNO: MOU triggered")
alertcondition(mou_breakout, title="MNO_MOU_BREAKOUT", message="MNO: MOU Breakout triggered")
alertcondition(mou_pullback, title="MNO_MOU_PULLBACK", message="MNO: MOU Pullback triggered")
alertcondition(kaku, title="MNO_KAKU", message="MNO: KAKU triggered")
alertcondition(assistEntry, title="MNO_ASSIST_ENTRY", message="MNO: ASSIST ENTRY (publish safety)")
// =========================
// Status label(最終足に必ず表示)
// =========================
var label status = na
if showStatusLbl and barstate.islast
label.delete(status)
statusTxt =
"MNO RUNNING " +
"ClosedTrades: " + str.tostring(strategy.closedtrades) + " " +
"BaseTrend: " + (baseTrendOK ? "OK" : "NO") + " " +
"MOU: " + (mou ? "YES" : "no") + " (猛=" + (mou_pullback ? "Y" : "n") + " / 猛B=" + (mou_breakout ? "Y" : "n") + ") " +
"KAKU: " + (kaku ? "YES" : "no") + " " +
"VolRatio: " + (na(volRatio) ? "na" : str.tostring(volRatio, format.mintick)) + " " +
"Pull%: " + (na(pullbackPct) ? "na" : str.tostring(pullbackPct, format.mintick)) + " " +
"Pos: " + (inPos ? "IN" : "OUT")
status := label.new(bar_index, high, statusTxt, style=label.style_label_left, textcolor=color.white, color=color.new(color.black, 0))
// =========================
// Debug table(最終足のみ)
// =========================
var table t = table.new(position.top_right, 2, 14, border_width=1, border_color=color.new(color.white, 60))
fRow(_name, _cond, _r) =>
bg = _cond ? color.new(color.lime, 70) : color.new(color.red, 80)
tx = _cond ? "OK" : "NO"
table.cell(t, 0, _r, _name, text_color=color.white, bgcolor=color.new(color.black, 0))
table.cell(t, 1, _r, tx, text_color=color.white, bgcolor=bg)
if showDebugTbl and barstate.islast
table.cell(t, 0, 0, "MNO Debug", text_color=color.white, bgcolor=color.new(color.black, 0))
table.cell(t, 1, 0, "", text_color=color.white, bgcolor=color.new(color.black, 0))
fRow("BaseTrend", baseTrendOK, 1)
fRow("MOU Pullback", mou_pullback, 2)
fRow("MOU Breakout", mou_breakout, 3)
fRow("Break confirm", breakConfirm, 4)
fRow("Break big body", bigBodyOK, 5)
fRow("Break close high", closeNearHighOK, 6)
fRow("Break vol strong", volumeStrongOK, 7)
fRow("Break MACD", macdBreakOK, 8)
fRow("KAKU all8", all8_strict, 9)
fRow("KAKU final3", final3, 10)
fRow("AssistEntry", assistEntry, 11)
fRow("ClosedTrades>0", strategy.closedtrades > 0, 12)

Smart Money Bot [MTF Confluence Edition]Uses multi-time frame analysis and supply and demand strategy.
Best used when swing trading.

Simple ICT Sweep + FVG (LuxAlgo Swings FIXED)something i created if anyone can improve it or change for better visual

Optimized BTC Mean Reversion (RSI 20/65)📈 Optimized BTC Mean Reversion (RSI 20/65)
Optimized BTC Mean Reversion (RSI 20/65) is a rule-based trading strategy designed to capture mean-reversion moves in strong market structures, primarily optimized for Bitcoin, but adaptable to other liquid cryptocurrencies.
The strategy combines RSI extremes, Stochastic momentum, and EMA trend filtering to identify high-probability reversal zones while maintaining strict risk management.
🔍 Strategy Logic
This system focuses on entering trades when price temporarily deviates from equilibrium, while still respecting the broader trend.
✅ Long Conditions
RSI below 20 (oversold)
Stochastic below 25
Price trading above the 200 EMA (or within a controlled deviation)
Designed to buy sharp pullbacks in bullish conditions
❌ Short Conditions
RSI above 65 (overbought)
Stochastic above 75
Price trading below the 200 EMA
Designed to sell relief rallies in bearish conditions
🛡 Risk Management
Fixed Stop Loss: 4%
Fixed Take Profit: 6%
Risk/Reward: 1 : 1.5
No pyramiding (single position at a time)
Full equity position sizing (adjustable)
All exits are predefined at entry, ensuring consistency and emotional discipline.
📊 Indicators Used
200 EMA – Trend direction filter
RSI (14) – Mean-reversion trigger (20 / 65 levels)
Stochastic Oscillator – Momentum confirmation
👁 Visual Features
EMA plotted directly on chart
Real-time Stop Loss, Take Profit, and Entry Price lines
Clear long/short entry markers
Works on all timeframes (optimized for intraday and swing trading)
🔔 Alerts
Long entry alerts
Short entry alerts
(Perfect for automation or discretionary execution)
⚠️ Disclaimer
This strategy is intended for educational and research purposes only. Past performance does not guarantee future results. Always test on a demo account and adjust risk parameters to your own trading plan.

Hammer Strategy (CLOSE ON NEXT BAR) [WORKING]Adjustable hammer and inverted hammer candle
Ham? INV? is the hammer
Entry on HAM, INV OR HAM?, INV? close next bar

Hammer Breakout (Adjustable RR)Hammer candle detection and strat for back testing.
diamond indicates a detected hammer candle, the position is entered at the hammer candle close.
Stop loss below the hammer candle wick.
Adjustbale rr based on the distance to the stop (bottom of wick)

Double&Triple Pattern[TS_Indie]📌 Description – Double & Triple Pattern Indicator
The Double & Triple Pattern Indicator is developed to help traders systematically and clearly identify Double Top, Double Bottom, Triple Top, and Triple Bottom chart patterns.
⚙️ Core Logic & Working Mechanism
The Double & Triple Pattern Indicator is built on the concept of price swing formation, based on the logic of Trend Entry_0 , which focuses on structured market analysis and price action behavior.
The indicator detects three main swing points (Swing 1, Swing 2, and Swing 3). A Fibonacci Box is then created using Swing A and Swing B as reference points to define the swing detection zone.
When all three swings remain inside the defined Fibonacci Box, the structure is considered a valid Price Action setup.
The indicator then plots key lines on the chart:
➩ Break Line – used to confirm the signal (confirmation)
➩ Cancel Line – used to invalidate the price action if price moves against the conditions
➛ When price breaks the Break Line , the structure is confirmed and a Pending Order is placed at Swing B , with the Stop Loss set at Swing 1.
➛ If price breaks the Cancel Line first, the price action structure is immediately invalidated.
⚙️ Fibonacci Entry Zone & Change SL Settings
➩ When Fibo Entry Zone is set to 0, the Pending Order is placed directly at Swing B.
➩ When the value is greater than 0, the Pending Order is calculated using Fibonacci levels drawn from Swing B to the Stop Loss level.
➩ Change SL allows switching the Stop Loss reference between Swing 1 and Swing A.
⚙️ Min & Max Control for Swing Size : xATR
When enabling Control Size Swing : xATR , the indicator filters Swing B based on the defined Min and Max range.
This allows traders to selectively test larger or smaller swing-based price actions , depending on their trading strategy.
⭐ Pending Order Cancellation Conditions
A Pending Order will be canceled under the following conditions:
1.A new Price Action signal appears on either the Buy or Sell side.
2.When Time Session is enabled, the Pending Order is canceled once price exits the selected session.
🕹 Order Management Rule
When there is an active open position, the indicator restricts the creation of new Pending Orders to prevent overlapping positions.
💡 Double Pattern Example
💡 Triple Pattern Example
⚠️ Disclaimer
This indicator is designed for technical analysis purposes only and does not constitute investment advice.
Users should apply proper risk management and make decisions at their own discretion.
🥂 Community Sharing
If you find parameter settings that work well or produce strong statistical results, feel free to share them with the community so we can improve and develop this indicator together.

Capitulation Detector StrategyA multi-factor capitulation detector designed to identify exhaustion points in extended trends. It focuses on fading capitulation moves after multi-leg trends with extreme volume and price extension.
━━━━━━━━━━━━━━━━━━━━━━━━━━━━━━━━━━━━━━━━
THE CONCEPT
Capitulation occurs when the last holders give up — panic selling into lows or euphoric buying into highs. These moments create asymmetric opportunities because:
Sentiment becomes maximally skewed
Weak hands are flushed out
Price deviates far from equilibrium
The "fuel" for continuation is exhausted
━━━━━━━━━━━━━━━━━━━━━━━━━━━━━━━━━━━━━━━━
THE 6 FACTORS
Trend Persistence — Price stays on one side of 38 EMA for 12+ bars, confirming a sustained directional move
Acceleration — Price stays on one side of 5 EMA for 3+ bars, showing the move is accelerating into exhaustion
Volume Spike — Current bar volume ≥ 2x the 20-bar average
Body Expansion — Candle body ≥ 1.5x average, showing conviction/panic in the move
Extension — Price is 2+ ATR away from the 38 EMA, indicating overextension from equilibrium
Multi-Leg Structure — At least 3 consecutive lower lows (for longs) or higher highs (for shorts)
━━━━━━━━━━━━━━━━━━━━━━━━━━━━━━━━━━━━━━━━
SIGNAL LOGIC
Bullish Capitulation: 4+ factors align + price below 38 EMA + down candle + volume spike
Bearish Capitulation: 4+ factors align + price above 38 EMA + up candle + volume spike
The strategy enters counter-trend, fading the exhaustion move.
━━━━━━━━━━━━━━━━━━━━━━━━━━━━━━━━━━━━━━━━
EXIT OPTIONS
ATR-based stop loss (default: 2 ATR)
ATR-based take profit (default: 3 ATR)
Optional trailing stop
Time filter for session-specific trading
━━━━━━━━━━━━━━━━━━━━━━━━━━━━━━━━━━━━━━━━
BEST PRACTICES
Works best on liquid instruments with clean trends
More reliable after 3+ legs in the trend
Higher conviction when daily AND intraday timeframes align
"The bigger and more extended, the better"
Consider VWAP as additional confirmation (not coded here)
━━━━━━━━━━━━━━━━━━━━━━━━━━━━━━━━━━━━━━━━
SETTINGS GUIDE
Min Score: Increase for fewer, higher-quality signals
Volume Spike Multiplier: 2x; increase for stricter filter
Extension ATR: Higher values = more overextended setups only
Trend Bars Min: Higher values = longer established trends required
━━━━━━━━━━━━━━━━━━━━━━━━━━━━━━━━━━━━━━━━
ALERTS
Bullish Capitulation (potential long)
Bearish Capitulation (potential short)
━━━━━━━━━━━━━━━━━━━━━━━━━━━━━━━━━━━━━━━━
DISCLAIMER
This is a counter-trend strategy — inherently higher risk than trend-following. Always use proper position sizing and risk management. Backtest thoroughly on your specific instruments and timeframes.


ORB Strategy: Extensions & Custom SL (EOD & Live Lines)That's a great request. Since you've now built a complex Pine Script Strategy with several user-configurable risk management, targeting, and exit options, the description should focus on the systematic rules used for entering, managing, and exiting trades.
Here is a clear, written description of the trading strategy you have built:
Trading Strategy Description: ORB Extension Breakout with Custom Stop, Live Tracking, and EOD Exit
This strategy is a systematic, momentum-based system designed for intraday trading. It operates on the principle of an Opening Range Breakout (ORB), utilizing the initial market consolidation to project high-probability targets, while offering multiple methods for managing risk and enforcing a mandatory end-of-day closure.
1. Market Identification (The Opening Range)
The strategy first defines the market's initial boundaries and volatility:
Session Window: The strategy calculates the Opening Range (OR) over a user-defined time period (default: 9:30 AM to 10:30 AM New York Time).
ORB Levels: Two key price levels are established and locked once the time window closes:
Wick High/Low: The absolute highest and lowest prices of the session. These serve as the entry trigger lines.
Body High/Low (Shaded Range): The highest and lowest open/close prices of the session. The height of this range is used as the basis for calculating all targets and stops.
2. Entry Rule (The Breakout)
The strategy waits passively for a breakout that confirms direction and ensures the move has not yet reached its immediate target.
Trigger Condition: A trade is signaled when a candle closes either:
Above the Wick High (for a Long entry).
Below the Wick Low (for a Short entry).
Constraint (Fresh Breakout): The entry is invalidated if the breakout candle's price action (High for Long, Low for Short) has already touched or surpassed the projected Take Profit (0.5 Extension) level before the candle closes.
Execution: The entry is a Market Order executed on the candle that meets the trigger conditions, subject to a user-defined Entry Delay (default 0 bars).
Direction Control: The user can select to trade Long Only, Short Only, or Both.
3. Exit and Risk Management
All trades are placed with simultaneous Take Profit and Stop Loss orders (a bracket order) upon entry.
A. Take Profit (TP)
The Take Profit is set at the 0.5 Extension of the Shaded Range (Body Range).
Calculation: The distance from the Body High/Low to the TP level is exactly 50% of the total height of the Shaded Range.
B. Stop Loss (SL)
The Stop Loss is dynamically calculated based on a user-selected method for risk control:
Range 0.5 (Body Range): The SL is placed an equal distance (0.5 times the Body Range height) outside the opposite side of the Body Range.
ATR Multiple: The Stop Loss distance is calculated as a user-defined Multiplier times the Average True Range (ATR).
Recent Swing Low/High: The Stop Loss is placed based on a structural low (for Long) or high (for Short) within a user-defined lookback period.
C. End-of-Day (EOD) Exit
Any open position is forced closed at the market price if it is still open when the user-defined closing time (default: 16:00 HHMM) is reached. This prevents carrying intraday risk overnight.
4. Visualization
The strategy includes comprehensive visual cues for analysis:
ORB Drawing: Displays the Wick High/Low and the shaded Body Range.
Breakout Signals: Highlights the specific bar where the validated entry signal occurs.
Closed Trades: Draws persistent lines for the Entry and Exit prices of the last few closed trades.
Live Open Trades: Draws persistent lines for the current Entry Price, active Take Profit Level, and active Stop Loss Level for any open position.

DR/IDR Break .5 TPDR/IDR Extension Breakout with Custom Stop
This strategy is a systematic, counter-trend, and momentum-based system designed for intraday trading. It operates on the principle of an Opening Range Breakout (ORB), utilizing the initial market consolidation to project high-probability targets, while offering multiple methods for managing risk.
1. Market Identification (The Opening Range)
The strategy begins by defining the market's initial boundaries and volatility:
Session Window: The strategy calculates the Opening Range (OR) over a user-defined time period (default: 9:30 AM to 10:30 AM New York Time).
ORB Levels: Two key price levels are established and locked once the time window closes:
Wick High/Low: The absolute highest and lowest prices of the session. These serve as the entry trigger lines.
Body High/Low (Shaded Range): The highest and lowest open/close prices of the session. The height of this range is used to calculate the Take Profit and Stop Loss levels.
2. Entry Rule (The Breakout)
The strategy is passive until the range is violated, looking for a strong move out of the consolidation area.
Trigger Condition: A trade is signaled when a candle closes either:
Above the Wick High (for a Long entry).
Below the Wick Low (for a Short entry).
Execution: The entry is a Market Order executed on the candle that meets the trigger condition, subject to a user-defined Entry Delay (default 0 bars, meaning the entry is taken immediately upon the breakout candle's close).
Direction Control: The user can select to trade Long Only, Short Only, or Both.
3. Exit and Risk Management
All trades are placed with simultaneous Take Profit and Stop Loss orders (a bracket order) once the entry is filled.
A. Take Profit (TP)
The Take Profit is set at the 0.5 Extension of the Shaded Range (Body Range).
Calculation: The distance from the Body High/Low to the TP level is exactly 50% of the total height of the Shaded Range.
B. Stop Loss (SL)
The Stop Loss is dynamically calculated based on a user-selected method for risk control:
Range 0.5 (Body Range): The Stop Loss is placed an equal distance (0.5 times the Body Range height) outside the opposite side of the Body Range.
Example (Long): If entry is above the Wick High, the SL is set 0.5 times the Body Range height below the Body Low.
ATR Multiple: The Stop Loss distance is determined by the asset's recent volatility.
Calculation: The distance is calculated as a user-defined Multiplier (default 2.0) times the Average True Range (ATR).
Recent Swing Low/High: The Stop Loss is placed based on a structural level defined by recent price action.
Long Entry: SL is placed at the Lowest Swing Low within a user-defined lookback period.
Short Entry: SL is placed at the Highest Swing High within a user-defined lookback period.
Summary of Workflow
The market sets the Wick and Body boundaries (e.g., 9:30–10:30 AM).
Price breaks and closes beyond a Wick boundary, triggering a signal.
The trade enters after the specified delay.
A bracket order is placed: TP is fixed at the 0.5 Extension, and SL is set based on the user's chosen risk method.
The trade is closed upon reaching either the TP or the SL level.

Multi-MA + RSI Pullback Strategy (Jordan)1️⃣ Strategy logic I’ll code
From your screenshots:
Indicators
• EMAs: 600 / 200 / 100 / 50
• RSI: length 6, levels 80 / 20
Rules (simplified so a script can handle them):
• Use a higher-timeframe trend filter (15m or 1h) using the EMAs.
• Take entries on the chart timeframe (you can use 1m or 5m).
• Long:
• Higher-TF trend is up.
• Price is pulling back into a zone (between 50 EMA and 100 EMA on the entry timeframe – this approximates your 50–61% retrace).
• RSI crosses below 20 (oversold).
• Short:
• Higher-TF trend is down.
• Price pulls back between 50 & 100 EMAs.
• RSI crosses above 80 (overbought).
• Exits: ATR-based stop + take-profit with adjustable R:R (2:1 or 3:1).
• Max 4 trades per day.
News filter & “only trade gold” you handle manually (run it on XAUUSD and avoid news times yourself – TradingView can’t read the economic calendar from code).

Strategia S&P 500 vs US10Y Yield (od 2000)This strategy explores the macroeconomic relationship between the equity market (S&P 500) and the debt market (10-Year Treasury Yield). Historically, rapid spikes in bond yields often exert downward pressure on equity valuations, leading to corrections or bear markets.
The goal of this strategy is capital preservation. It attempts to switch to cash when yields are rising too aggressively and re-enter the stock market when the bond market stabilizes.

Strategia S&P 500 vs US10Y YieldThis strategy explores the macroeconomic relationship between the equity market (S&P 500) and the debt market (10-Year Treasury Yield). Historically, rapid spikes in bond yields often exert downward pressure on equity valuations, leading to corrections or bear markets.
The goal of this strategy is capital preservation. It attempts to switch to cash when yields are rising too aggressively and re-enter the stock market when the bond market stabilizes.

Keltner Channels Strategy NewThe strategy is chenging the same as an original copy, but this one is for tests, so I will publish it and check results

N1E_UTBOATN1E_UTBOAT
ATR trailing stop
Optional Heikin Ashi source
Buy/Sell signals based on a crossover of price vs ATR trailing stop
Strategy long/short entries
