UT Bot + LinReg Candles (Dual Sensitivity)
Script Description:
This indicator combines the popular UT Bot Alerts system with Linear Regression Candles (open source) for enhanced trend detection and trading signals in one singel script. The UT Bot features independent, then 2 x ATR sensitivity and periods controls for buy and sell signals, allowing you to fine-tune entries and exits to match your strategy. The script also overlays colored Linear Regression Candles with an optional signal line, helping you visually identify trend strength and direction. All calculations are performed on standard chart prices (no Heikin Ashi). Suitable for all asset classes and timeframes.
Eample setting for usdjpy 5 min chart for repeated buy and sell singnals based on trend:
BUY ATR period 300 multiplier 1
SELL ATR period 1 multiplier 2
Disclaimer:
This script is for informational and educational purposes only. It is not financial advice. Use at your own risk; the author assumes no responsibility for any trading results or losses.
Credits goes to to Ugurvu for linreg candles and quantnomad for UT Bot alerts that make this script possible.
Author: Patrick
รูปแบบชาร์ต

Logistic Regression ICT FVG🚀 OVERVIEW
Welcome to the Logistic Regression Fair Value Gap (FVG) System — a next-gen trading tool that blends precision gap detection with machine learning intelligence.
Unlike traditional FVG indicators, this one evolves with each bar of price action, scoring and filtering gaps based on real market behavior.
🔧 CORE FEATURES
✨ Smart Gap Detection
Automatically identifies bullish and bearish Fair Value Gaps using volatility-aware candle logic.
📊 Probability-Based Filtering
Uses logistic regression to assign each gap a confidence score (0 to 1), showing only high-probability setups.
🔁 Real-Time Retest Tracking
Continuously watches how price interacts with each gap to determine if it deserves respect.
📈 Multi-Factor Assessment
Evaluates RSI, MACD, and body size at gap formation to build a full context snapshot.
🧠 Self-Learning Engine
The logistic regression model updates on each bar using gradient descent, refining its predictions over time.
📢 Built-In Alerts
Get instant alerts when a gap forms, gets retested, or breaks.
🎨 Custom Display Options
Control the color of bullish/bearish zones, and toggle on/off probability labels for cleaner charts.
🚩 WHAT MAKES IT DIFFERENT
This isn’t just another box-drawing indicator.
While others mark every imbalance, this system thinks before it draws — using statistical modeling to filter out noise and prioritize high-impact zones.
By learning from how price behaves around gaps (not just how they form), it helps you trade only what matters — not what clutters.
⚙️ HOW IT WORKS
1️⃣ Detection
FVGs are identified using ATR-based thresholds and sharp wick imbalances.
2️⃣ Behavior Monitoring
Every gap is tracked — and if respected enough times, it becomes part of the elite training set.
3️⃣ Context Capture
Each new FVG logs RSI, MACD, and body size to provide a feature-rich context for prediction.
4️⃣ Prediction (Logistic Regression)
The model predicts how likely the gap is to be respected and assigns it a probability score.
5️⃣ Classification & Alerts
Gaps above the threshold are plotted with score labels, and alerts trigger for entry/respect/break.
⚙️ CONFIGURATION PANEL
🔧 System Inputs
• Max Retests – How many times a gap must be respected to train the model
• Prediction Threshold – Minimum score to show a gap on the chart
• Learning Rate – Controls how fast the model adapts (default: 0.009)
• Max FVG Lifetime – Expiration duration for unused gaps
• Show Historic Gaps – Show/hide expired or invalidated gaps
🎨 Visual Options
• Bullish/Bearish Colors – Set gap colors to fit your chart style
• Confidence Labels – Show probability scores next to FVGs
• Alert Toggles – Enable alerts for:
– New FVG detected
– FVG respected (entry)
– FVG invalidated (break)
💡 WHY LOGISTIC REGRESSION?
Traditional FVG tools rely on candle shapes.
This system relies on probability — by training on RSI, MACD, and price behavior, it predicts whether a gap will act as a true liquidity zone.
Logistic regression lets the system continuously adapt using new data, making it more accurate the longer it runs.
That means smarter signals, fewer false positives, and a clearer view of where real opportunities lie.

The Essa System V1.5The Essa System V1.5
Overview
The Essa System is a comprehensive trading strategy and backtesting tool designed for traders who use market structure and Fibonacci retracements. It automatically identifies significant trading ranges, calculates key retracement levels, and then backtests a complete trading strategy based on entries at these levels.
This is more than just an indicator; it's a full suite of analytical tools designed to help you develop, test, and analyze a complete trading plan directly on your chart.
How It Works
The system's logic is based on a classic price action concept:
Range Detection: First, it automatically identifies a significant trading range by finding the highest high and lowest low based on pivot points over a user-defined lookback period.
Fibonacci Analysis: Once the range direction (bullish or bearish) is established, the script calculates and displays key Fibonacci retracement levels (50%, 61.8%, 70.5%, and 78.6%).
Trade Execution: The system then looks for historical and live trading opportunities, entering a trade when the price pulls back to one of the enabled Fibonacci levels. All trades are managed with a predefined Stop Loss and Take Profit in pips.
Key Features
Automatic Range & Fibonacci Analysis: Automatically draws the primary trading range and key Fib levels, updating as market structure evolves.
Historical Backtesting: Plots all historical trade entries based on the strategy rules, allowing for a complete performance review over the chosen chart history.
Detailed Trade Visuals: Displays active trades on the chart with clear lines and boxes for entry, stop loss, and take profit zones.
Advanced Session Filtering: Allows you to isolate trades to specific market sessions (London, New York, Asia) with timezone support and daily trade limits.
Built-in Risk Management: A cornerstone of the system. It automatically calculates the required position size for each trade based on your specified Account Size, Risk Percentage, and Stop Loss.
Comprehensive Performance Tables: The script includes two powerful analytical tables:
Trade Helper Table: Shows the status of live or potential upcoming trades, including entry/SL/TP prices and the calculated position size.
History Table: Logs all recent trades and calculates key statistics like Profit Factor, Win Rate, and the overall PnL impact on your account balance.
Customizable Strategy: Fine-tune every aspect of the strategy with inputs for the lookback period, SL/TP in pips, which Fib levels are tradable, and a cooldown timer to prevent over-trading.
How to Use
Add the indicator to your chart.
Navigate to the settings and, under "Account Settings," configure your Account Size and Risk Per Trade (%). This is essential for the PnL and position sizing calculations to be meaningful.
Under "Session Filter Settings," adjust the sessions you wish to trade.
Analyze the historical trades and the performance tables to understand the strategy's behaviour on your chosen asset and timeframe.
Disclaimer: This is a tool for strategy analysis and backtesting. It is not financial advice. Past performance is not indicative of future results. Always use proper risk management.

Altcoin Liquidity Flow Score - Big Moves Only//@version=6
indicator("Altcoin Liquidity Flow Score - Big Moves Only", overlay=false)
// Pull weekly macro data
walcl = request.security("FRED:WALCL", "W", close)
rrp = request.security("FRED:RRPONTSYD", "W", close)
tga = request.security("FRED:WDTGAL", "W", close)
hyg = request.security("AMEX:HYG", "W", close)
total3 = request.security("CRYPTOCAP:TOTAL3", "W", close)
usdt_d = request.security("CRYPTOCAP:USDT.D", "W", close)
// Calculate week-over-week change
delta_liquidity = ta.change(walcl + rrp - tga)
delta_rrp = ta.change(rrp)
delta_hyg = ta.change(hyg)
delta_total3 = ta.change(total3)
delta_usdt_d = ta.change(usdt_d)
// Compute raw score
raw_score = delta_liquidity - delta_rrp + delta_hyg + delta_total3 - delta_usdt_d
// Apply 3-week smoothing
score = ta.ema(raw_score, 3)
// Define threshold for major liquidity shift
threshold = 2.0
// Plot score + background for only strong signals
plot(score, title="Liquidity Flow Score (Smoothed)", color=color.teal, linewidth=2)
hline(0, "Zero Line", color=color.gray)
bgcolor(score > threshold ? color.new(color.green, 85) : score < -threshold ? color.new(color.red, 85) : na)

我的策略
The specific implementation of the dominant_cycle function needs to be done using ta.ht_dominant_cycle_period or by calculating the rate of change of the phase, which requires detailed technical processing in actual coding.
How to use the "Market Mathieu Oscillator":
• Green background (stable zone): The market is likely to be in a consolidation or mean reversion state. Trend strategies are riskier, while range trading or option seller strategies may be more dominant.
• Yellow background (warning zone): The market has entered a "flammable" state where resonance may occur. Counter-trend trading should be reduced, and preparations for potential breakthroughs should be started, tightening stops.
• Red background (unstable/resonance zone): **Highest alert! ** This shows that the market is not only "flammable", but also has a "spark" (strong driving force). This is the stage where the trend is most likely to accelerate and sustain itself. Counter-trend operations should be strictly avoided, and trend-following strategies should be actively adopted.
• Q Oscillator:
• The rising q value means that emotions are moving to extremes and the "fuel" of the trend is increasing.
• The q-value is falling, indicating that sentiment is returning to neutrality and the "fuel" of the trend is decreasing, which may indicate the exhaustion of the trend or the beginning of consolidation.
• When the q-value exceeds the red threshold line, it indicates that the driving force is extremely strong, which is one of the necessary conditions for entering the red background.
The "Market Mathieu Oscillator" is an innovative attempt to transform a profound physical and financial theory into an intuitive decision-making aid available on TradingView through a proxy and simplified approach. It cannot make precise quantitative predictions like theoretical models, but it provides a whole new dimension to observe the market: it no longer focuses solely on the price itself, but on the relationship between the "force" that drives the price and the "rhythm" of the market itself. Through this lens, traders can better understand when the market may turn from stability to turbulence, and make more strategic decisions.

CCI Trading SystemCCI Trading System with Signal Bar Coloring
Overview
This indicator combines the classic Commodity Channel Index (CCI) oscillator with visual signal detection and bar coloring to help traders identify potential momentum shifts and trading opportunities.
Features
CCI Oscillator Display: Shows CCI values in a separate pane with customizable period length
Adjustable Thresholds: User-defined buy and sell levels (default: -100 buy, +100 sell)
Visual Signal Detection: Triangle markers indicate crossover points
Bar Coloring: Highlights only the bars where actual buy/sell signals occur
Zone Highlighting: Background colors show overbought/oversold conditions
Real-time Information Table: Displays current CCI value, thresholds, and signal status
Built-in Alerts: Notification system for signal generation
How It Works
The indicator generates signals based on CCI threshold crossovers:
Buy Signal: Triggered when CCI crosses above the buy threshold (lime bar coloring)
Sell Signal: Triggered when CCI crosses below the sell threshold (red bar coloring)
Input Parameters
CCI Length: Period for CCI calculation (default: 20)
Buy Threshold: Level for buy signal generation (default: -100)
Sell Threshold: Level for sell signal generation (default: +100)
Enable Bar Coloring: Toggle for chart bar coloring
Show Signals: Toggle for signal markers
Usage Guidelines
Adjust thresholds based on your trading timeframe and volatility preferences
Use in conjunction with other technical analysis tools for confirmation
Consider market context and trend direction when interpreting signals
The -200/+200 levels serve as additional reference points for extreme conditions
Educational Purpose
This indicator is designed for educational and analysis purposes. It demonstrates how CCI can be used to identify potential momentum shifts in price action. The visual elements help traders understand the relationship between CCI values and price movements.
Risk Disclaimer
This indicator is a technical analysis tool and does not guarantee profitable trades. Past performance does not indicate future results. Always conduct your own analysis and consider risk management principles. Trading involves substantial risk of loss and is not suitable for all investors.
Technical Notes
Uses Pine Script v5
Plots CCI with standard deviation-based calculation
Includes crossover/crossunder functions for signal generation
Features conditional bar coloring for signal visualization
Incorporates alert conditions for automated notifications
This script is open source and available for modification and educational use.

minchang volume tradingCondition
Point color
Volume ≥ 3× MA(24)
Violet
Volume ≥ 1.5× MA(24)
Red
Volume < 1.5× MA(24) & bullish
White
Volume < 1.5× MA(24) & bearish
Black

CipherMatrix Dashboard (MarketCipher B)Pre-compute MarketCipher-B values for each fixed timeframe (5 m, 15 m, 30 m, 60 m, 4 H, Daily).
Pass those values into plotRow() instead of calling request.security() inside the helper—removes the style warning.
Added explicit range parameters to table.clear(dash, 0, 0, 2, 6) to satisfy v6’s argument requirement.
This version should compile without the previous warnings/errors. Swap in your real MarketCipher-B histogram when you’re ready, and the dashboard is good to go!


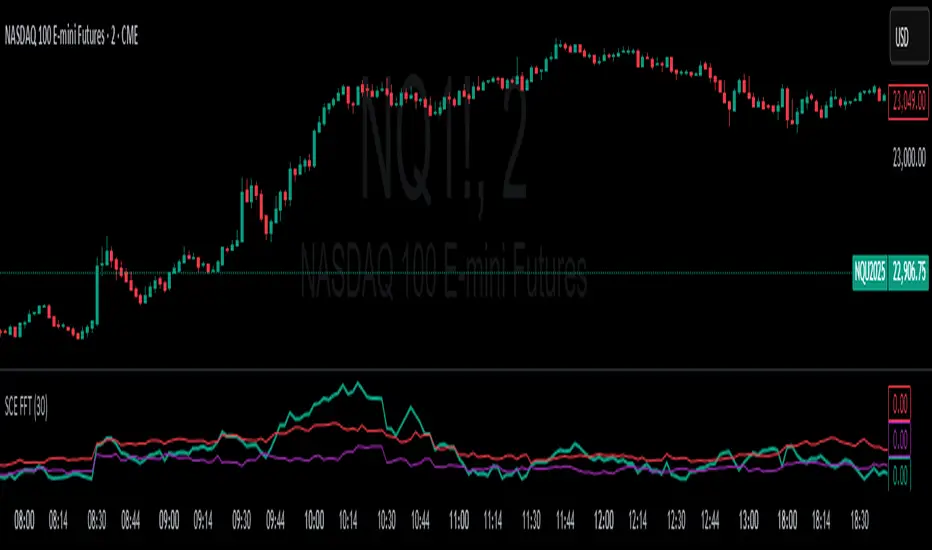
Fast Fourier Transform [ScorsoneEnterprises]The SCE Fast Fourier Transform (FFT) is a tool designed to analyze periodicities and cyclical structures embedded in price. This is a Fourier analysis to transform price data from the time domain into the frequency domain, showing the rhythmic behaviors that are otherwise invisible on standard charts.
Instead of merely observing raw prices, this implementation applies the FFT on the logarithmic returns of the asset:
Log Return(𝑚) = log(close / close )
This ensures stationarity and stabilizes variance, making the analysis statistically robust and less influenced by trends or large price swings.
For a user-defined lookback window 𝑁:
Each frequency component 𝑘 is computed by summing real and imaginary projections of log-returns multiplied by complex exponential functions:
𝑒^−𝑖𝜃 = cos(𝜃)−𝑖sin(𝜃)
where:
θ = 2πkm / N
he result is the magnitude spectrum, calculated as:
Magnitude(𝑘) = sqrt(Real_Sum(𝑘)^2 + Imag_Sum(𝑘)^2)
This spectrum represents the strength of oscillations at each frequency over the lookback period, helping traders identify dominant cycles.
Visual Analysis & Interpretation
To give traders context for the FFT spectrum’s values, this script calculates:
25th Percentile (Purple Line)
Represents relatively low cyclical intensity.
Values below this threshold may signal quiet, noisy, or trendless periods.
75th Percentile (Red Line)
Represents heightened cyclical dominance.
Values above this threshold may indicate significant periodic activity and potential trend formation or rhythm in price action.
The FFT magnitude of the lowest frequency component (index 0) is plotted directly on the chart in teal. Observing how this signal fluctuates relative to its percentile bands provides a dynamic measure of cyclical market activity.
Chart examples
In this NYSE:CL chart, we see the regime of the price accurately described in the spectral analysis. We see the price above the 75th percentile continue to trend higher until it breaks back below.
In long trending markets like NYSE:PL has been, it can give a very good explanation of the strength. There was confidence to not switch regimes as we never crossed below the 75th percentile early in the move.
The script is also usable on the lower timeframes. There is no difference in the usability from the different timeframes.
Script Parameters
Lookback Value (N)
Default: 30
Defines how many bars of data to analyze. Larger N captures longer-term cycles but may smooth out shorter-term oscillations.
SuperPerformance_V1.2📊 SUPER PERFORMANCE INDICATOR
A comprehensive performance analysis tool that compares your stock against selected indices and tracks sector performance across multiple timeframes.
🎯 MAIN FEATURES
✅ Stock Performance Table
• Compares stock vs index performance across 1D, 5D, 10D, 20D, 50D, 200D periods
• Shows ✓/✗ indicators for outperformance tracking
• Displays percentage gains/losses with color coding (green=positive, red=negative)
• Calculates conviction score based on outperformance across timeframes
• Provides performance difference between stock and index
✅ Sector Performance Table
• Ranks top 5 performing sectors across different timeframes
• Shows real-time sector performance with percentage changes
• Tracks 19 major Indian market sectors
• Customizable time periods (1D, 5D, 10D, 20D, 60D)
✅ Sector Display Box
• Shows current stock's sector classification
• Customizable positioning and styling
• Optional sector abbreviations
🔧 CUSTOMIZATION OPTIONS
📋 Display Settings
• Dark/Light mode toggle
• Show/hide individual tables
• Mini mode for compact view
• Index selection (default: NIFTYMIDSML400)
📊 Table Controls
• Enable/disable specific columns and rows
• Adjustable table size (tiny/small/normal/large)
• 9 positioning options for each table
• Color customization for backgrounds and text
🎨 Advanced Features
• Conviction scoring system (Perfect/Solid/Good/Ok/Weak/Poor)
• Real-time performance tracking
• Multi-timeframe analysis
• Sector rotation insights
📈 CONVICTION LEVELS
• Perfect: Outperforms in all periods
• Solid: Outperforms in 67%+ periods
• Good: Outperforms in 50%+ periods
• Ok: Outperforms in 33%+ periods
• Weak: Outperforms in some periods
• Poor: Underperforms in all periods
⚙️ HOW TO USE
1. Add indicator to your chart
2. Select comparison index in Display Settings
3. Customize visible columns/rows as needed
4. Position tables on screen
5. Analyze green ✓ (outperforming) vs red ✗ (underperforming)
6. Use conviction score for overall performance assessment
🎯 IDEAL FOR
• Relative strength analysis
• Sector rotation strategies
• Performance benchmarking
• Indian equity markets
Note: Designed specifically for NSE/Indian market analysis with pre-configured sector indices.


Breakout LabelsThis script labels the highest price of the lowest candle over a period of time. It then labels any bullish breakouts where the close price is higher than the high of the lowest candle.

FULLY FUNCTIONAL INDICATOR TESTER🎯 Purpose:
A comprehensive strategy testing framework designed to evaluate custom indicators and trading signals with professional-grade risk management and signal detection capabilities.
✨ Key Features:
Multiple Signal Detection Methods - Value changes, crossovers, threshold-based triggers
Advanced Confluence Filtering - Multi-source confirmation system with lookback periods
Professional Risk Management - Static TP/SL, break-even functionality, position sizing
Custom Exit Signals - Independent exit logic for refined strategy testing
Visual Feedback System - Clear signal plots and real-time status monitoring
Flexible Input Sources - Connect any custom indicator or built-in study
🔧 How to Use:
Connect your indicator outputs to the Entry/Exit source inputs
Select appropriate signal detection method for your indicator type
Configure risk parameters (TP/SL/Break-even)
Enable confluence filters if needed for additional confirmation
Backtest and analyze results with built-in performance metrics
📈 Signal Detection Options:
Value Change: Detects when indicator values change
Crossover Above/Below: Traditional crossover signals
Threshold Triggers: Value-based entry/exit levels
⚙️ Technical Specifications:
Compatible with Pine Script v6
Overlay strategy with position tracking
Real-time performance monitoring table
Configurable margin requirements
Full backtesting compatibility
⚠️ Important Notes:
This is a testing framework - not financial advice
Always validate signals in demo environment first
Past performance does not guarantee future results
Use proper risk management in live trading
🔄 Updates:
Enhanced signal detection algorithms
Improved confluence logic
Added break-even functionality
Visual debugging tools
Perfect for traders and developers looking to systematically tes

3.RSI LIJO 45*55//@version=6
indicator(title="3.RSI LIJO 45*55", shorttitle="RSI-LIJO-45-55", format=format.price, precision=2, timeframe="", timeframe_gaps=true)
rsiLengthInput = input.int(9, minval=1, title="RSI Length", group="RSI Settings")
rsiSourceInput = input.source(close, "Source", group="RSI Settings")
calculateDivergence = input.bool(false, title="Calculate Divergence", group="RSI Settings", display=display.data_window, tooltip="Calculating divergences is needed in order for divergence alerts to fire.")
change = ta.change(rsiSourceInput)
up = ta.rma(math.max(change, 0), rsiLengthInput)
down = ta.rma(-math.min(change, 0), rsiLengthInput)
rsi = down == 0 ? 100 : up == 0 ? 0 : 100 - (100 / (1 + up / down))
// Change RSI line color based on bands
rsiColor = rsi > 50 ? color.green : rsi < 50 ? color.red : color.white
rsiPlot = plot(rsi, "RSI", color=rsiColor)
rsiUpperBand = hline(55, "RSI Upper Band", color=color.rgb(5, 247, 22))
midline = hline(50, "RSI Middle Band", color=color.new(#787B86, 50))
rsiLowerBand = hline(45, "RSI Lower Band", color=color.rgb(225, 18, 14))
fill(rsiUpperBand, rsiLowerBand, color=color.rgb(126, 87, 194, 90), title="RSI Background Fill")
midLinePlot = plot(50, color=na, editable=false, display=display.none)
fill(rsiPlot, midLinePlot, 100, 55, top_color=color.new(color.green, 0), bottom_color=color.new(color.green, 100), title="Overbought Gradient Fill")
fill(rsiPlot, midLinePlot, 45, 0, top_color=color.new(color.red, 100), bottom_color=color.new(color.red, 0), title="Oversold Gradient Fill")
// Smoothing MA inputs
GRP = "Smoothing"
TT_BB = "Only applies when 'SMA + Bollinger Bands' is selected. Determines the distance between the SMA and the bands."
maTypeInput = input.string("SMA", "Type", options= , group=GRP, display=display.data_window)
maLengthInput = input.int(31, "Length", group=GRP, display=display.data_window)
bbMultInput = input.float(2.0, "BB StdDev", minval=0.001, maxval=50, step=0.5, tooltip=TT_BB, group=GRP, display=display.data_window)
var enableMA = maTypeInput != "None"
var isBB = maTypeInput == "SMA + Bollinger Bands"
// Smoothing MA Calculation
ma(source, length, MAtype) =>
switch MAtype
"SMA" => ta.sma(source, length)
"SMA + Bollinger Bands" => ta.sma(source, length)
"EMA" => ta.ema(source, length)
"SMMA (RMA)" => ta.rma(source, length)
"WMA" => ta.wma(source, length)
"VWMA" => ta.vwma(source, length)
// Smoothing MA plots
smoothingMA = enableMA ? ma(rsi, maLengthInput, maTypeInput) : na
smoothingStDev = isBB ? ta.stdev(rsi, maLengthInput) * bbMultInput : na
plot(smoothingMA, "RSI-based MA", color=color.yellow, display=enableMA ? display.all : display.none, editable=enableMA)
bbUpperBand = plot(smoothingMA + smoothingStDev, title="Upper Bollinger Band", color=color.green, display=isBB ? display.all : display.none, editable=isBB)
bbLowerBand = plot(smoothingMA - smoothingStDev, title="Lower Bollinger Band", color=color.green, display=isBB ? display.all : display.none, editable=isBB)
fill(bbUpperBand, bbLowerBand, color=isBB ? color.new(color.green, 90) : na, title="Bollinger Bands Background Fill", display=isBB ? display.all : display.none, editable=isBB)
// Divergence
lookbackRight = 5
lookbackLeft = 5
rangeUpper = 60
rangeLower = 5
bearColor = color.red
bullColor = color.green
textColor = color.white
noneColor = color.new(color.white, 100)
_inRange(bool cond) =>
bars = ta.barssince(cond)
rangeLower <= bars and bars <= rangeUpper
plFound = false
phFound = false
bullCond = false
bearCond = false
rsiLBR = rsi
if calculateDivergence
//------------------------------------------------------------------------------
// Regular Bullish
// rsi: Higher Low
plFound := not na(ta.pivotlow(rsi, lookbackLeft, lookbackRight))
rsiHL = rsiLBR > ta.valuewhen(plFound, rsiLBR, 1) and _inRange(plFound )
// Price: Lower Low
lowLBR = low
priceLL = lowLBR < ta.valuewhen(plFound, lowLBR, 1)
bullCond := priceLL and rsiHL and plFound
//------------------------------------------------------------------------------
// Regular Bearish
// rsi: Lower High
phFound := not na(ta.pivothigh(rsi, lookbackLeft, lookbackRight))
rsiLH = rsiLBR < ta.valuewhen(phFound, rsiLBR, 1) and _inRange(phFound )
// Price: Higher High
highLBR = high
priceHH = highLBR > ta.valuewhen(phFound, highLBR, 1)
bearCond := priceHH and rsiLH and phFound
plot(
plFound ? rsiLBR : na,
offset = -lookbackRight,
title = "Regular Bullish",
linewidth = 2,
color = (bullCond ? bullColor : noneColor),
display = display.pane,
editable = calculateDivergence)
plotshape(
bullCond ? rsiLBR : na,
offset = -lookbackRight,
title = "Regular Bullish Label",
text = " Bull ",
style = shape.labelup,
location = location.absolute,
color = bullColor,
textcolor = textColor,
display = display.pane,
editable = calculateDivergence)
plot(
phFound ? rsiLBR : na,
offset = -lookbackRight,
title = "Regular Bearish",
linewidth = 2,
color = (bearCond ? bearColor : noneColor),
display = display.pane,
editable = calculateDivergence)
plotshape(
bearCond ? rsiLBR : na,
offset = -lookbackRight,
title = "Regular Bearish Label",
text = " Bear ",
style = shape.labeldown,
location = location.absolute,
color = bearColor,
textcolor = textColor,
display = display.pane,
editable = calculateDivergence)
alertcondition(bullCond, title='Regular Bullish Divergence', message="Found a new Regular Bullish Divergence, Pivot Lookback Right number of bars to the left of the current bar.")
alertcondition(bearCond, title='Regular Bearish Divergence', message='Found a new Regular Bearish Divergence, Pivot Lookback Right number of bars to the left of the current bar.')

Byquan ADX RSI EMA9 Cross AlertThis indicator is used when the ADX exceeds the 40 threshold to look for potential reversals, confirmed by the crossover between the RSI and the RSI-based moving average, as well as the EMA 9.

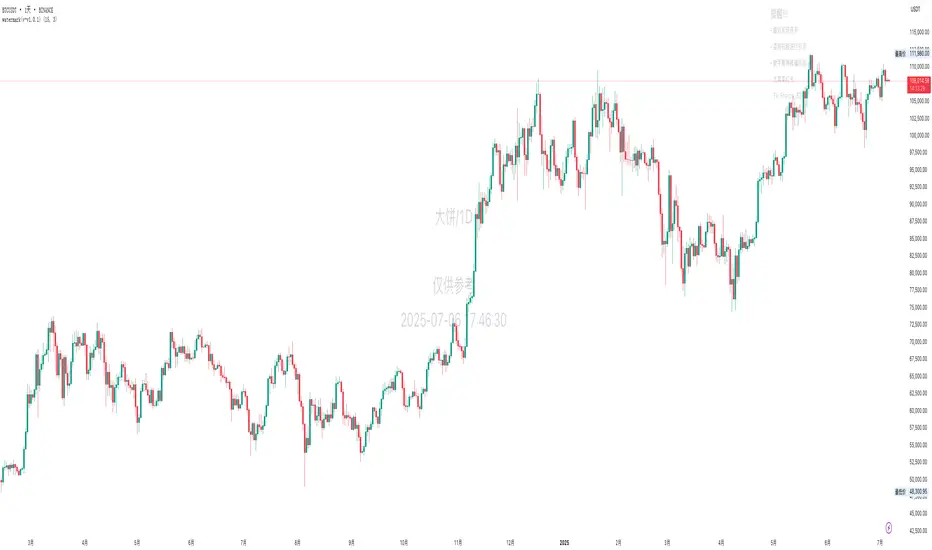
Jumping watermark# Jumping watermark
## Function description
- Dynamic watermark: Mainly used to add dynamic watermarks to prevent theft and transfer when recording videos.
- Static watermark: Sharing opinions can easily include information such as trading pairs, cycles, current time, and individual signatures.
### Static watermark:
Display the watermark related to the current trading pair in the center of the chart.
- Configuration items:
- You can choose to configure the display content: current trading pair code and name, cycle, date, time, and individual signature content
### Dynamic watermark
Display the configured watermark content in a dynamic random position.
- Configuration items:
- Turn on or off the display of watermark jumping
- Modify the display text content and style by yourself
----- 中文简介-----
# 跳动水印
## 功能描述
- 动态水印: 主要可用于视频录制时添加动态水印防盗、防搬运。
- 静态水印:观点分享是可方便的带上交易对、周期、当前时间、个签等信息。
### 静态水印:
在图表中心位置显示当前交易对相关信息水印。
- 配置项:
- 可选择配置显示内容:当前交易对代码及名称、周期、日期、时间、个签内容
### 动态水印
动态随机位置显示配置水印内容。
- 配置项:
- 开启或关闭显示水印跳动
- 自行修改配置显示文字内容和样式
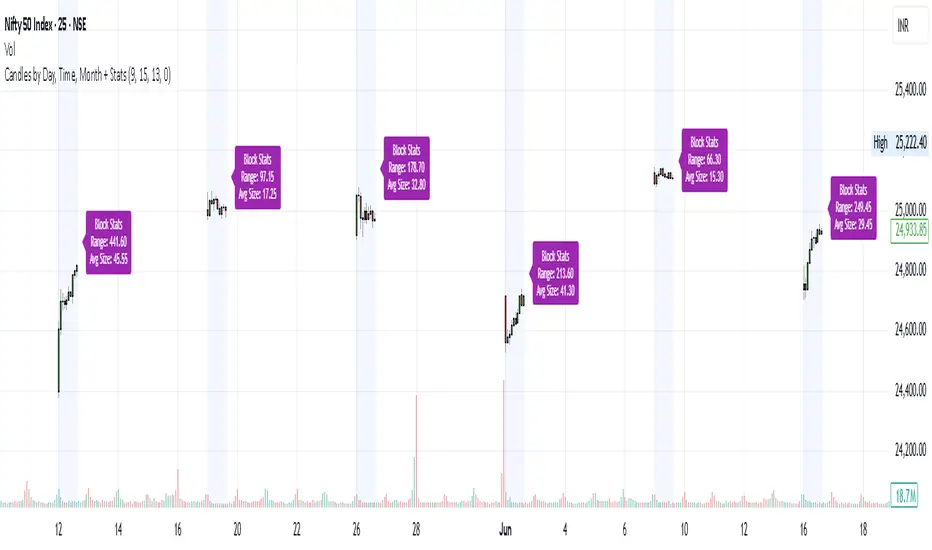
Candles by Day, Time, Month + StatsThis Pine Script allows you to filter and display candles based on:
📅 Specific days of the week
🕒 Custom intraday time ranges (e.g., 9:15 to 10:30)
📆 Selected months
📊 Shows stats for each filtered block:
🔼 Range (High – Low)
📏 Average candle body size
⚙️ Key Features:
✅ Filter by day, time, and month
🎛 Toggle to show/hide the stats label
🟩 Candles are drawn only for selected conditions
📍 Stats label is positioned above session high (adjustable)
⚠️ Important Setup Instructions:
✅ 1. Use it on a blank chart
To avoid overlaying with default candles:
Open the chart of your preferred symbol
Click on the chart type (top toolbar: "Candles", "Bars", etc.)
Select "Blank" from the dropdown (this will hide all native candles)
Apply this indicator
This ensures only the filtered candles from the script are visible.
Adjust for your local timezone
This script uses a hardcoded timezone: "Asia/Kolkata"
If you are in a different timezone, change it to your own (e.g. "America/New_York", "Europe/London", etc.) in all instances of:
time(timeframe.period, "Asia/Kolkata")
timestamp("Asia/Kolkata", ...)
Use Cases:
Opening range behavior on specific weekdays/months
Detecting market anomalies during exact windows
Building visual logs of preferred trade hours
Sistema de Trading Juan José - Cruce de EMAs + SMA + RSICruce de EMas + SMA +RSI para determinar los puntos de entrada y salida

9 EMA Angle + Price % Filter//@version=5
indicator("9 EMA Angle + Price % Filter", overlay=true)
length = 9
emaLine = ta.ema(close, length)
// === INPUTS ===
angleThreshold = input.float(20, "EMA Angle Threshold (°)")
pricePercentThreshold = input.float(80, "Price % Above/Below EMA")
// === PRICE DISTANCE FROM EMA IN % ===
percentAbove = close >= emaLine ? ((close - emaLine) / emaLine) * 100 : 0
percentBelow = close < emaLine ? ((emaLine - close) / emaLine) * 100 : 0
// === ANGLE CALCULATION ===
lookbackBars = input.int(5, "Bars for Angle Calculation")
p1 = emaLine
p2 = emaLine
deltaY = p1 - p2
deltaX = lookbackBars
angleRadians = math.atan(deltaY / deltaX)
angleDegrees = angleRadians * 180 / math.pi
// === CONDITIONS ===
isFlat = percentAbove < pricePercentThreshold and percentBelow < pricePercentThreshold and angleDegrees > -angleThreshold and angleDegrees < angleThreshold
isPriceAbove = percentAbove >= pricePercentThreshold
isPriceBelow = percentBelow >= pricePercentThreshold
isAngleUp = angleDegrees >= angleThreshold
isAngleDown = angleDegrees <= -angleThreshold
// === EMA COLOR LOGIC ===
emaColor = isFlat ? color.black :
isAngleUp or isPriceAbove ? color.green :
isAngleDown or isPriceBelow ? color.red : color.gray
// === PLOT EMA ===
plot(emaLine, "9 EMA", color=emaColor, linewidth=2)

TVI-3 Z-Score: MA + VWAP + BB Composite🔧 Overview:
It combines:
Z-score of price relative to the 200-period simple moving average (MA)
Z-score of price relative to the 200-period VWAP (volume-weighted average price)
Z-score of Bollinger Band width
The result is an average of these three Z-scores, plotted as a composite indicator for identifying overvalued and undervalued conditions.

Nến Tô Màu Theo Volume / MA(21)Condition
Point color
Volume ≥ 3× MA(24)
Violet
Volume ≥ 1.5× MA(24)
Red
Volume < 1.5× MA(24) & bullish
White
Volume < 1.5× MA(24) & bearish
Black

Momentum SNR VIP [3 TP + Max 50 Pip SL]//@version=6
indicator("Momentum SNR VIP ", overlay=true)
// === Settings ===
pip = input.float(0.0001, "Pip Size", step=0.0001)
sl_pip = 50 * pip
tp1_pip = 40 * pip
tp2_pip = 70 * pip
tp3_pip = 100 * pip
lookback = input.int(20, "Lookback for S/R", minval=5)
// === SNR ===
pivotHigh = ta.pivothigh(high, lookback, lookback)
pivotLow = ta.pivotlow(low, lookback, lookback)
supportZone = not na(pivotLow)
resistanceZone = not na(pivotHigh)
plotshape(supportZone, title="Support", location=location.belowbar, color=color.blue, style=shape.triangleup, size=size.tiny)
plotshape(resistanceZone, title="Resistance", location=location.abovebar, color=color.red, style=shape.triangledown, size=size.tiny)
// === Price Action ===
bullishEngulfing = close < open and close > open and close > open and open <= close
bearishEngulfing = close > open and close < open and close < open and open >= close
bullishPinBar = close < open and (low - math.min(open, close)) > 1.5 * math.abs(close - open)
bearishPinBar = close > open and (high - math.max(open, close)) > 1.5 * math.abs(close - open)
buySignal = supportZone and (bullishEngulfing or bullishPinBar)
sellSignal = resistanceZone and (bearishEngulfing or bearishPinBar)
// === SL & TP ===
rawBuySL = low - 10 * pip
buySL = math.max(close - sl_pip, rawBuySL)
buyTP1 = close + tp1_pip
buyTP2 = close + tp2_pip
buyTP3 = close + tp3_pip
rawSellSL = high + 10 * pip
sellSL = math.min(close + sl_pip, rawSellSL)
sellTP1 = close - tp1_pip
sellTP2 = close - tp2_pip
sellTP3 = close - tp3_pip
// === Plot Lines ===
plot(buySignal ? buySL : na, title="Buy SL", color=color.red, style=plot.style_line, linewidth=1)
plot(buySignal ? buyTP1 : na, title="Buy TP1", color=color.green, style=plot.style_line, linewidth=1)
plot(buySignal ? buyTP2 : na, title="Buy TP2", color=color.green, style=plot.style_line, linewidth=1)
plot(buySignal ? buyTP3 : na, title="Buy TP3", color=color.green, style=plot.style_line, linewidth=1)
plot(sellSignal ? sellSL : na, title="Sell SL", color=color.red, style=plot.style_line, linewidth=1)
plot(sellSignal ? sellTP1 : na, title="Sell TP1", color=color.green, style=plot.style_line, linewidth=1)
plot(sellSignal ? sellTP2 : na, title="Sell TP2", color=color.green, style=plot.style_line, linewidth=1)
plot(sellSignal ? sellTP3 : na, title="Sell TP3", color=color.green, style=plot.style_line, linewidth=1)
// === Floating Labels on Right Side ===
if buySignal
label.new(x=bar_index + 50, y=buySL, text="SL", style=label.style_label_right, color=color.red, textcolor=color.white)
label.new(x=bar_index + 50, y=buyTP1, text="TP1", style=label.style_label_right, color=color.green, textcolor=color.white)
label.new(x=bar_index + 50, y=buyTP2, text="TP2", style=label.style_label_right, color=color.green, textcolor=color.white)
label.new(x=bar_index + 50, y=buyTP3, text="TP3", style=label.style_label_right, color=color.green, textcolor=color.white)
if sellSignal
label.new(x=bar_index + 50, y=sellSL, text="SL", style=label.style_label_right, color=color.red, textcolor=color.white)
label.new(x=bar_index + 50, y=sellTP1, text="TP1", style=label.style_label_right, color=color.green, textcolor=color.white)
label.new(x=bar_index + 50, y=sellTP2, text="TP2", style=label.style_label_right, color=color.green, textcolor=color.white)
label.new(x=bar_index + 50, y=sellTP3, text="TP3", style=label.style_label_right, color=color.green, textcolor=color.white)
// === Signal Markers ===
plotshape(buySignal, title="Buy Signal", location=location.belowbar, color=color.green, style=shape.labelup, text="BUY")
plotshape(sellSignal, title="Sell Signal", location=location.abovebar, color=color.red, style=shape.labeldown, text="SELL")
// === Alerts ===
alertcondition(buySignal, title="Buy Alert", message="🟢 BUY at Support Zone + Price Action")
alertcondition(sellSignal, title="Sell Alert", message="🟡 SELL at Resistance Zone + Price Action")

Momentum SNR VIP (Step 2)//@version=6
indicator("Momentum SNR VIP (Step 2)", overlay=true)
// === Inputs ===
lookback = input.int(20, "Lookback for S/R", minval=5)
rr_ratio = input.float(2.0, "Risk-Reward Ratio", minval=0.5, step=0.1)
plot(close, color=color.orange)
