OPEN-SOURCE SCRIPT
ที่อัปเดต: David_FairPriceCandlestick_calculated
Description:
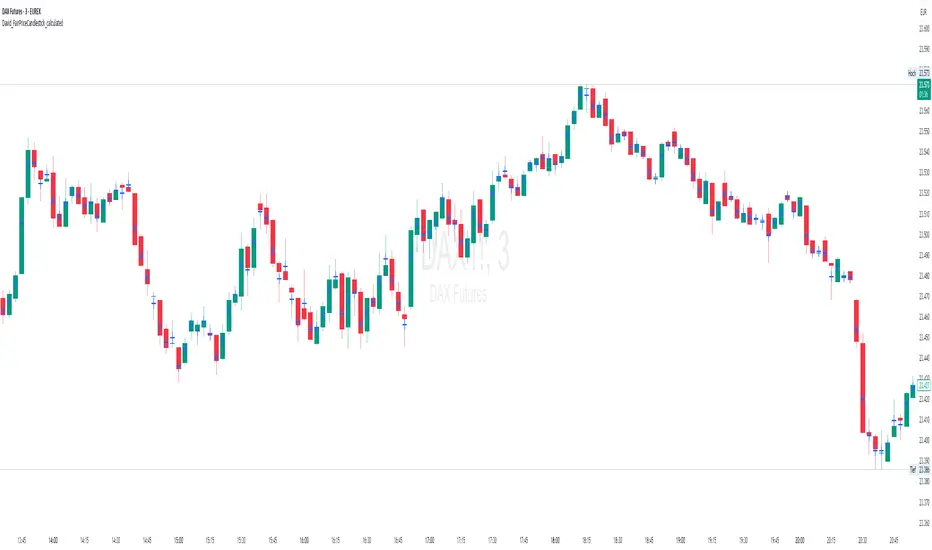
This indicator displays the "Typical Price" for each candle as a visual marker (cross) directly on the chart. The Typical Price is calculated as the average of the High, Low, and Close values of each bar:
(High + Low + Close) / 3
The marker provides a quick visual reference to the fair or average price level within every single candle.
Unlike a Point of Control (POC) or volume-based indicators, this script works purely with price data and is independent of volume or order flow.
Use cases:
Identify where most trading activity may have been concentrated within the candle (for price-based strategies)
Support as a reference line for mean-reversion or fair value concepts
Works on all timeframes and instruments
Customization:
You can easily change the marker style (cross, dot, triangle, etc.) and color within the script.
เอกสารเผยแพร่
Description:This indicator displays the "Typical Price" for each candle as a visual marker (cross) directly on the chart. The Typical Price is calculated as the average of the High, Low, and Close values of each bar:
(High + Low + Close) / 3
The marker provides a quick visual reference to the fair or average price level within every single candle.
Unlike a Point of Control (POC) or volume-based indicators, this script works purely with price data and is independent of volume or order flow.
Use cases:
Identify where most trading activity may have been concentrated within the candle (for price-based strategies)
Support as a reference line for mean-reversion or fair value concepts
Works on all timeframes and instruments
Customization:
You can easily change the marker style (cross, dot, triangle, etc.) and color within the script.
สคริปต์โอเพนซอร์ซ
ด้วยเจตนารมณ์หลักของ TradingView ผู้สร้างสคริปต์นี้ได้ทำให้เป็นโอเพนซอร์ส เพื่อให้เทรดเดอร์สามารถตรวจสอบและยืนยันฟังก์ชันการทำงานของมันได้ ขอชื่นชมผู้เขียน! แม้ว่าคุณจะใช้งานได้ฟรี แต่โปรดจำไว้ว่าการเผยแพร่โค้ดซ้ำจะต้องเป็นไปตาม กฎระเบียบการใช้งาน ของเรา
คำจำกัดสิทธิ์ความรับผิดชอบ
ข้อมูลและบทความไม่ได้มีวัตถุประสงค์เพื่อก่อให้เกิดกิจกรรมทางการเงิน, การลงทุน, การซื้อขาย, ข้อเสนอแนะ หรือคำแนะนำประเภทอื่น ๆ ที่ให้หรือรับรองโดย TradingView อ่านเพิ่มเติมใน ข้อกำหนดการใช้งาน