PROTECTED SOURCE SCRIPT
ที่อัปเดต: 200 EMA RoC Vs Index
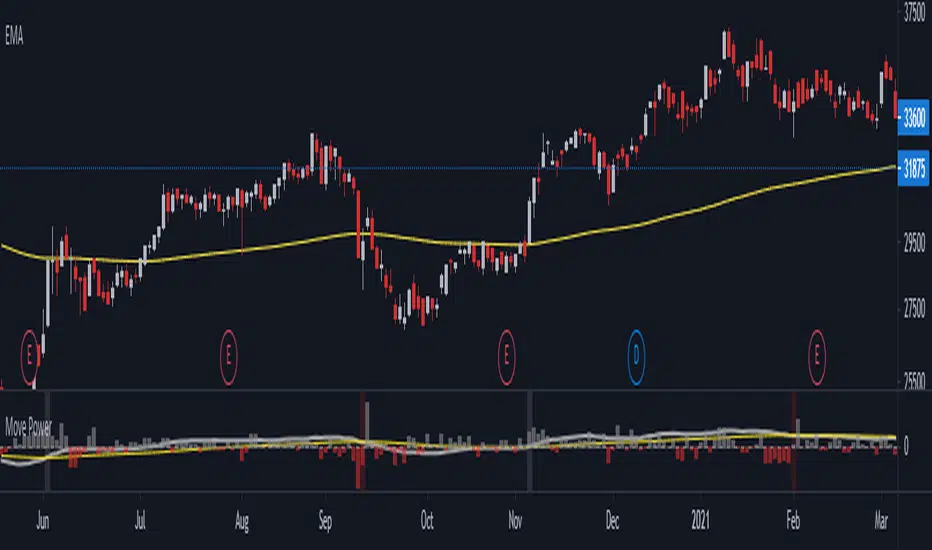
This indicator calculates 200 EMA rate of Change, between today's value vs yesterday's value
I found it useful and easier to track the trend.
I added 50 SMA as additional help top calculate averages between data. if the 50 SMA crosses over it will show gray background, and red if it crosses down.
The Histogram represent Index data.
Best use for Stock Market
I found it useful and easier to track the trend.
I added 50 SMA as additional help top calculate averages between data. if the 50 SMA crosses over it will show gray background, and red if it crosses down.
The Histogram represent Index data.
Best use for Stock Market
เอกสารเผยแพร่
makes several housekeeping task, cleaning up unnecessary commentsเอกสารเผยแพร่
add conditional calculation to check whether today's close is smaller than yesterday'sso visually easier to spot Index Movement
เอกสารเผยแพร่
housekeeping taskสคริปต์ที่ได้รับการป้องกัน
สคริปต์นี้ถูกเผยแพร่เป็นแบบ closed-source อย่างไรก็ตาม คุณสามารถใช้ได้อย่างอิสระและไม่มีข้อจำกัดใดๆ – เรียนรู้เพิ่มเติมได้ที่นี่
คำจำกัดสิทธิ์ความรับผิดชอบ
ข้อมูลและบทความไม่ได้มีวัตถุประสงค์เพื่อก่อให้เกิดกิจกรรมทางการเงิน, การลงทุน, การซื้อขาย, ข้อเสนอแนะ หรือคำแนะนำประเภทอื่น ๆ ที่ให้หรือรับรองโดย TradingView อ่านเพิ่มเติมใน ข้อกำหนดการใช้งาน
สคริปต์ที่ได้รับการป้องกัน
สคริปต์นี้ถูกเผยแพร่เป็นแบบ closed-source อย่างไรก็ตาม คุณสามารถใช้ได้อย่างอิสระและไม่มีข้อจำกัดใดๆ – เรียนรู้เพิ่มเติมได้ที่นี่
คำจำกัดสิทธิ์ความรับผิดชอบ
ข้อมูลและบทความไม่ได้มีวัตถุประสงค์เพื่อก่อให้เกิดกิจกรรมทางการเงิน, การลงทุน, การซื้อขาย, ข้อเสนอแนะ หรือคำแนะนำประเภทอื่น ๆ ที่ให้หรือรับรองโดย TradingView อ่านเพิ่มเติมใน ข้อกำหนดการใช้งาน