Ninetails

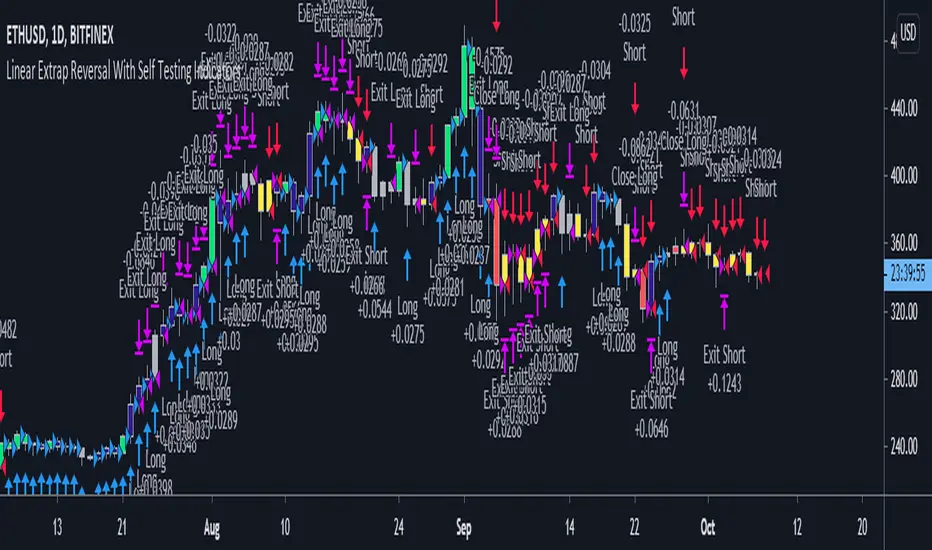
It compares the default values defined by the user to the other values which are specified, determining which has been most effective over the lookback period, which also is defined by the user.
It then groups the most effective settings over the defined period for lagging and leading indicators, and issues a positive or negative score for each individual indicator.
For this iteration there are 4 leading, and 7 lagging indicators.
Green candles show the sum of leading, and also lagging indicator is a positive total greater than 1.
Blue shows a positive sum.
Yellow shows a negative sum.
Red shows a negative sum of leading and also lagging indicators greater than 1.
White shows no defined direction.
Trades are entered on the first red or green candle, and exited on red or yellow for longs, or green or blue for shorts.
If you use a lookback period which exceeds the amount of periods available, then it will just show defaults.
nonoyeslearns
on twitter for more information!
Lagging indicators crossing long means that the leading indicators were showing positive correlation, and the lagging now crossed into positive correlation.
Leading indicators crossing long means that lagging were showing positive, and leading now crossed into positive correlation.
The same hold true for shorts.
The effects of being able to control these(turn off leading indicator shorts for macro bullish assets) have been greatly postive on the strategy results.
Tests 8 remaining indicators now against their linear extrapolation parameters in order to speed up signals and give clearer reversals instead of continuation of trend.
สคริปต์แบบเฉพาะผู้ได้รับเชิญเท่านั้น
เฉพาะผู้ใช้งานที่ผู้เขียนอนุมัตเท่านั้นจึงจะสามารถเข้าถึงสคริปต์นี้ได้ คุณจะต้องขอและได้รับอนุญาตก่อนใช้งาน ซึ่งโดยทั่วไปจะได้รับอนุญาตหลังจากชำระเงินแล้ว สำหรับรายละเอียดเพิ่มเติม โปรดทำตามคำแนะนำของผู้เขียนด้านล่าง หรือติดต่อ nonoyeslearns โดยตรง
TradingView ไม่แนะนำให้จ่ายเงินหรือใช้สคริปต์ เว้นแต่คุณจะเชื่อถือผู้เขียนและเข้าใจวิธีการทำงานของสคริปต์นั้นอย่างถ่องแท้ คุณยังสามารถหาทางเลือกแบบโอเพนซอร์สฟรีได้ใน สคริปต์ชุมชนของเรา
คำแนะนำของผู้เขียน
คำจำกัดสิทธิ์ความรับผิดชอบ
สคริปต์แบบเฉพาะผู้ได้รับเชิญเท่านั้น
เฉพาะผู้ใช้งานที่ผู้เขียนอนุมัตเท่านั้นจึงจะสามารถเข้าถึงสคริปต์นี้ได้ คุณจะต้องขอและได้รับอนุญาตก่อนใช้งาน ซึ่งโดยทั่วไปจะได้รับอนุญาตหลังจากชำระเงินแล้ว สำหรับรายละเอียดเพิ่มเติม โปรดทำตามคำแนะนำของผู้เขียนด้านล่าง หรือติดต่อ nonoyeslearns โดยตรง
TradingView ไม่แนะนำให้จ่ายเงินหรือใช้สคริปต์ เว้นแต่คุณจะเชื่อถือผู้เขียนและเข้าใจวิธีการทำงานของสคริปต์นั้นอย่างถ่องแท้ คุณยังสามารถหาทางเลือกแบบโอเพนซอร์สฟรีได้ใน สคริปต์ชุมชนของเรา