PROTECTED SOURCE SCRIPT
OBV Oscillator [CP]
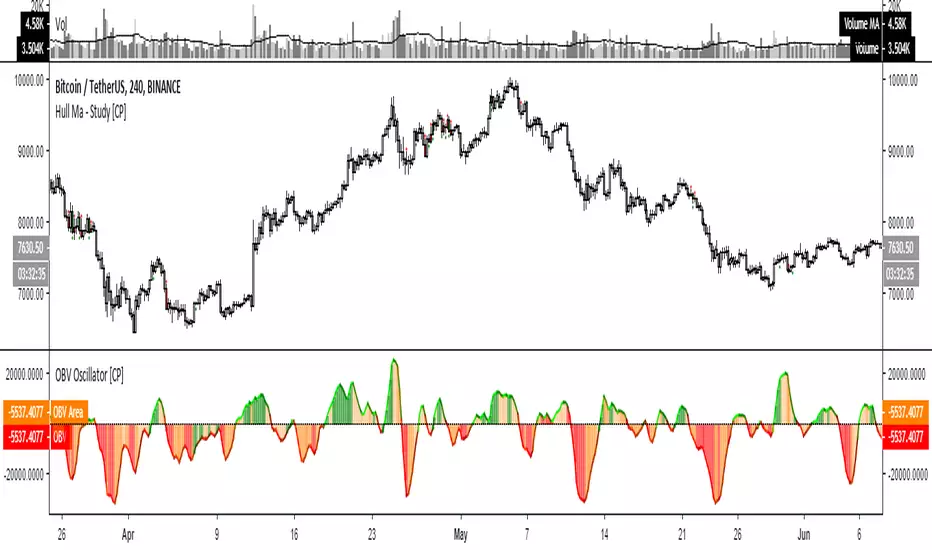
This is my version of the OBV Oscillator and I've used CCI to color the histogram
Line colors:
* Lime rising line above 0 line: Strong Bullish
* Green falling line above 0 line : Neutral Bullish
* Red falling line below 0 line : Strong Bearish
* Maroon rising line below 0 line : Neutral Bearish
Histogram colors:
*Green background above 0 line: Strong Bullish / Overbought
*Orange background above 0 line: Neutral Bullish
*Red background below 0 line: Strong Bearish / Oversold
*Orange background below 0 line: Neutral Bearish
สคริปต์ที่ได้รับการป้องกัน
สคริปต์นี้ถูกเผยแพร่เป็นแบบ closed-source อย่างไรก็ตาม คุณสามารถใช้ได้อย่างอิสระและไม่มีข้อจำกัดใดๆ – เรียนรู้เพิ่มเติมได้ที่นี่
คำจำกัดสิทธิ์ความรับผิดชอบ
ข้อมูลและบทความไม่ได้มีวัตถุประสงค์เพื่อก่อให้เกิดกิจกรรมทางการเงิน, การลงทุน, การซื้อขาย, ข้อเสนอแนะ หรือคำแนะนำประเภทอื่น ๆ ที่ให้หรือรับรองโดย TradingView อ่านเพิ่มเติมใน ข้อกำหนดการใช้งาน