PROTECTED SOURCE SCRIPT
Tweezer Pattern
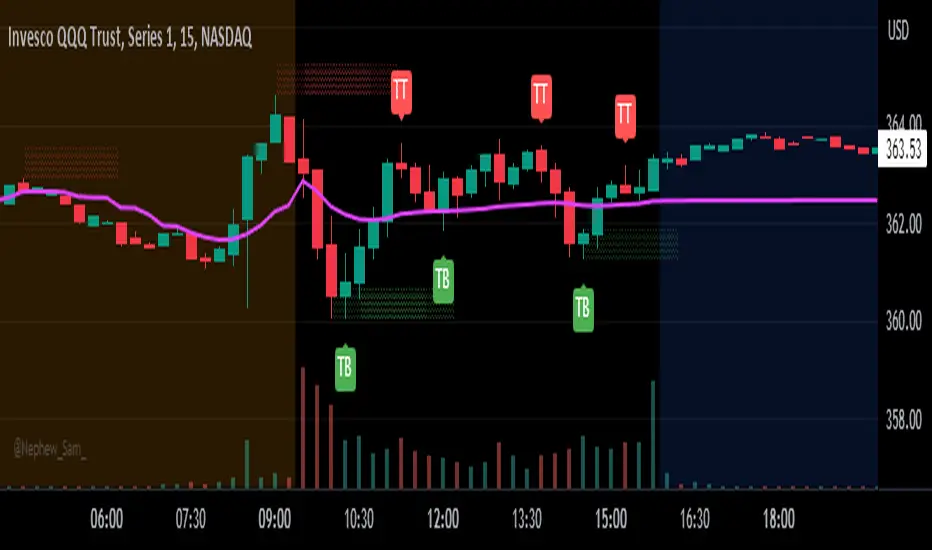
This is a rudimentary indicator to plot tweezer bottoms and tweezer tops. I use this primarily on the 15 minute, but may be applicable to other timeframes.
Criteria for a Tweezer Bottom:
- We were previously in a downtrend (determined by the color of the previous two candles)
- The current candle is green
- The current and previous candle have lower wicks
- The current candle open is approximately the same as the previous candle close (adjustable through settings)
Criteria for a Tweezer Top:
- We were previously in an uptrend (determined by the color of the previous two candles)
- The current candle is red
- The current and previous candle have upper wicks
- The current candle open is approximately the same as the previous candle close (adjustable through settings)
Potential Improvements:
- Determine trend through TA, for example using SMAs
- Ensure wick length as some percentage of candle height instead of just checking for existence
- Ensure tweezer candle is large or has some required minimum volume to reduce false positives
For any improvements or ideas, feel free to contact me :)
สคริปต์ที่ได้รับการป้องกัน
สคริปต์นี้ถูกเผยแพร่เป็นแบบ closed-source อย่างไรก็ตาม คุณสามารถใช้ได้อย่างอิสระและไม่มีข้อจำกัดใดๆ – เรียนรู้เพิ่มเติมได้ที่นี่
คำจำกัดสิทธิ์ความรับผิดชอบ
ข้อมูลและบทความไม่ได้มีวัตถุประสงค์เพื่อก่อให้เกิดกิจกรรมทางการเงิน, การลงทุน, การซื้อขาย, ข้อเสนอแนะ หรือคำแนะนำประเภทอื่น ๆ ที่ให้หรือรับรองโดย TradingView อ่านเพิ่มเติมใน ข้อกำหนดการใช้งาน