PROTECTED SOURCE SCRIPT
Custum Deviation + xEMA_DFMA alpha
This indicator is still an alpha version.
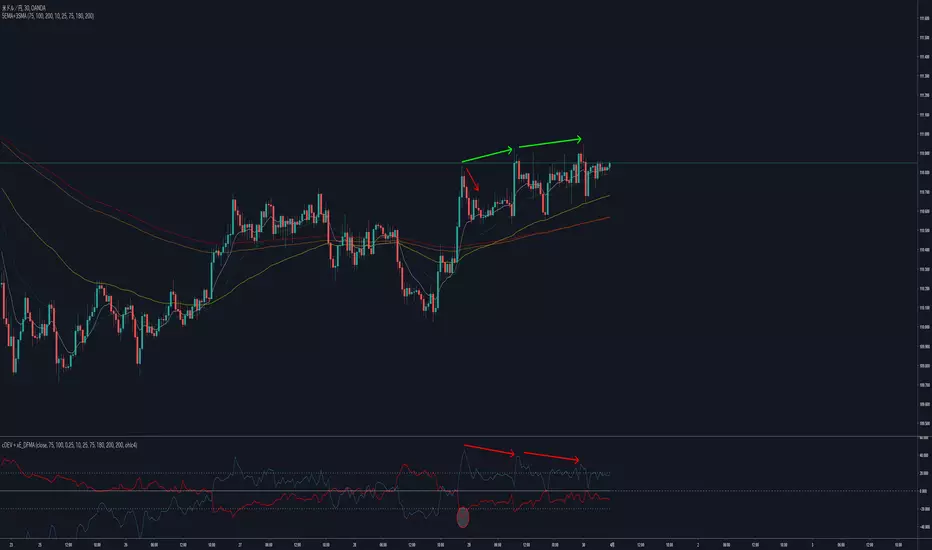
This indicator shows you that deviation from specific EMA (Red Line). It can help you to do Countertrade when price "skyrockets" or "Sudden drop".
Blue Line show you that sum of difference from Moving Average of 5 types EMAs. It shows "Divergence" like MACD.
This indicator shows you that deviation from specific EMA (Red Line). It can help you to do Countertrade when price "skyrockets" or "Sudden drop".
Blue Line show you that sum of difference from Moving Average of 5 types EMAs. It shows "Divergence" like MACD.
สคริปต์ที่ได้รับการป้องกัน
สคริปต์นี้ถูกเผยแพร่เป็นแบบ closed-source อย่างไรก็ตาม คุณสามารถใช้ได้อย่างอิสระและไม่มีข้อจำกัดใดๆ – เรียนรู้เพิ่มเติมได้ที่นี่
คำจำกัดสิทธิ์ความรับผิดชอบ
ข้อมูลและบทความไม่ได้มีวัตถุประสงค์เพื่อก่อให้เกิดกิจกรรมทางการเงิน, การลงทุน, การซื้อขาย, ข้อเสนอแนะ หรือคำแนะนำประเภทอื่น ๆ ที่ให้หรือรับรองโดย TradingView อ่านเพิ่มเติมใน ข้อกำหนดการใช้งาน