PROTECTED SOURCE SCRIPT
ที่อัปเดต: EMA_Cross_Timeframe
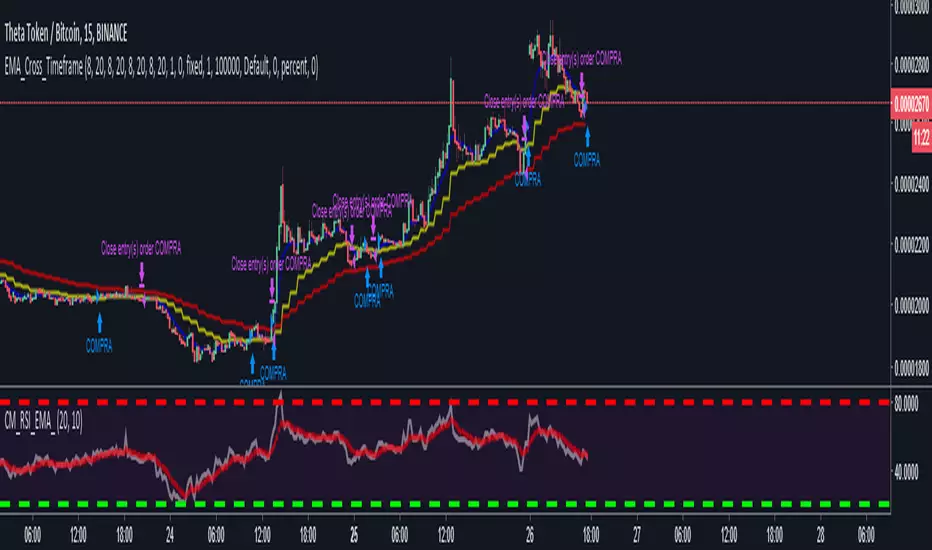
Indicator made to show the EMAs in different timeframes.
indicator gives buys signal when the EMA of the current chart (emaA1) crosses the EMA of the 1H chart (emaH1). And it gives the signal of sale when the EMA of the current chart (emaA1), crosses down the EMA of the 1H chart (emaH1) and the closing is below the emaH1.
NOTE 1: In the tests that I have done, it has given great signs of purchase, but with the sales signals, I still have to find the best result.
NOTE 2: Do not blindly use any indicators, analyze them, and use the indicator to help confirm your inputs and outputs.
I am open to suggestions for improvements.
เอกสารเผยแพร่
Change made so that in the graph the BUY sign is shown as "COMPRA"Change made so that in the chart the SELL signal is shown as "VENDA"
เอกสารเผยแพร่
added sale signal if the current EMA crosses down from the 1H Now the sales signal is given in case the current media crosses below the 1He (with the closing price) or below the 1H B
เอกสารเผยแพร่
change made, from EMA to SMAnow the tool uses the simple SMA media furniture. I understand that this makes the result better.
สคริปต์ที่ได้รับการป้องกัน
สคริปต์นี้ถูกเผยแพร่เป็นแบบ closed-source อย่างไรก็ตาม คุณสามารถใช้ได้อย่างอิสระและไม่มีข้อจำกัดใดๆ – เรียนรู้เพิ่มเติมได้ที่นี่
คำจำกัดสิทธิ์ความรับผิดชอบ
ข้อมูลและบทความไม่ได้มีวัตถุประสงค์เพื่อก่อให้เกิดกิจกรรมทางการเงิน, การลงทุน, การซื้อขาย, ข้อเสนอแนะ หรือคำแนะนำประเภทอื่น ๆ ที่ให้หรือรับรองโดย TradingView อ่านเพิ่มเติมใน ข้อกำหนดการใช้งาน