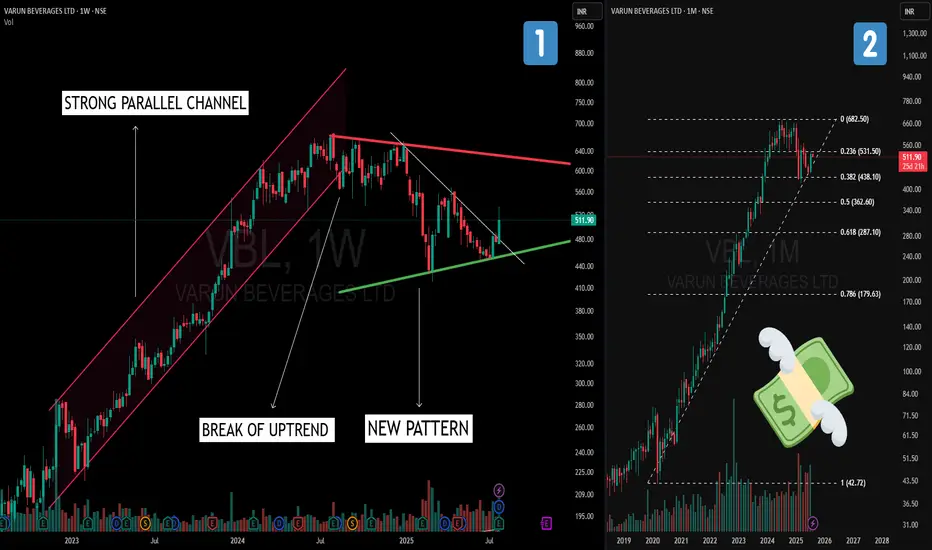
On the monthly timeframe (right chart), Varun Beverages shows a classic Fibonacci retracement pullback to the 38.2% level after an extended rally.
>Shifting to the weekly timeframe (left chart), we observe:
-Parallel Channel during the earlier uptrend phase, reflecting a strong trending structure.
-A break of the uptrend that transitioned into a sideways phase.
-Formation of a Symmetrical Triangle – characterized by a sequence of lower highs and higher lows, creating a contraction pattern.
This multi‑timeframe view highlights how trends evolve from strong rallies, to corrections, and into consolidation structures.
⚠️ Disclaimer:
This post is for educational purposes only and is not financial advice.
🎯 Master My Self-Made Trading Strategy
✅ WhatsApp (Learn Today): wa.me/919455664601
📈 Telegram (Learn Today): t.me/hashtaghammer
✅ WhatsApp (Learn Today): wa.me/919455664601
📈 Telegram (Learn Today): t.me/hashtaghammer
การนำเสนอที่เกี่ยวข้อง
คำจำกัดสิทธิ์ความรับผิดชอบ
ข้อมูลและบทความไม่ได้มีวัตถุประสงค์เพื่อก่อให้เกิดกิจกรรมทางการเงิน, การลงทุน, การซื้อขาย, ข้อเสนอแนะ หรือคำแนะนำประเภทอื่น ๆ ที่ให้หรือรับรองโดย TradingView อ่านเพิ่มเติมที่ ข้อกำหนดการใช้งาน