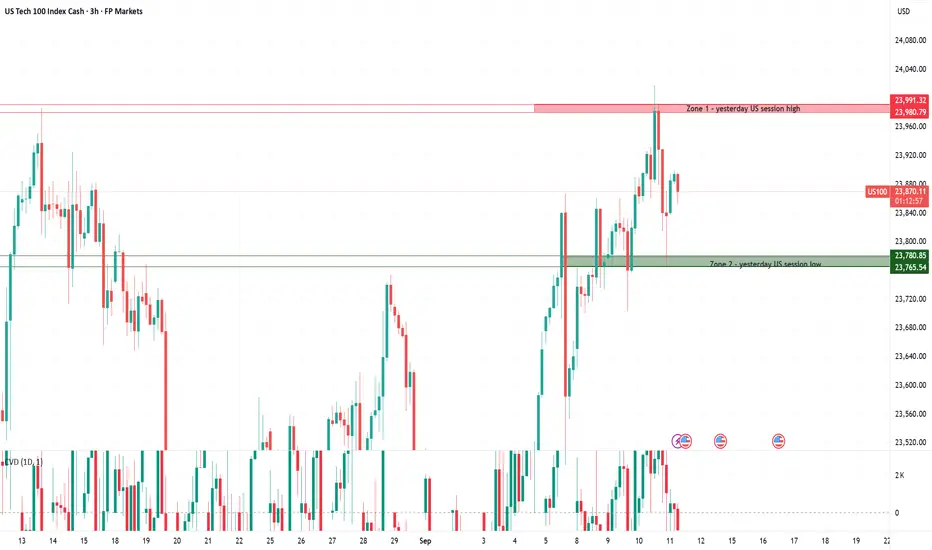
Zone 1 – 23,980 – 23,991
This zone sits just below the all-time high, making it a critical supply area where volatility tends to spike. Sellers are likely to defend here aggressively, and false breakouts are common as liquidity is swept around all-time highs. A clean breakout and hold above would signal strong buyer conviction and could fuel a momentum push into uncharted territory.
Zone 2 – 23,765 – 23,781
This zone represents a key demand area where buyers previously stepped in to defend intraday lows. A sharp bounce here would confirm renewed buying interest, while a decisive break below would shift control back to sellers and could trigger a deeper correction.
With price trading near all-time highs, caution is warranted. Volatility often spikes in these areas, as liquidity hunts and false breakouts are common. Traders should be selective, waiting for clear confirmation before committing to new positions.
Sentiment in the US100 remains cautiously positive, supported by strong momentum in select tech names and growing expectations of Fed rate cuts after softer labor data and a sharp drop in producer prices. Lower input costs are viewed as supportive for corporate margins in the near term, while falling yields continue to benefit growth stocks. Still, the broader backdrop is fragile, as weaker job revisions and signs of cooling demand remind investors that economic momentum is slowing.
คำจำกัดสิทธิ์ความรับผิดชอบ
ข้อมูลและบทความไม่ได้มีวัตถุประสงค์เพื่อก่อให้เกิดกิจกรรมทางการเงิน, การลงทุน, การซื้อขาย, ข้อเสนอแนะ หรือคำแนะนำประเภทอื่น ๆ ที่ให้หรือรับรองโดย TradingView อ่านเพิ่มเติมที่ ข้อกำหนดการใช้งาน
คำจำกัดสิทธิ์ความรับผิดชอบ
ข้อมูลและบทความไม่ได้มีวัตถุประสงค์เพื่อก่อให้เกิดกิจกรรมทางการเงิน, การลงทุน, การซื้อขาย, ข้อเสนอแนะ หรือคำแนะนำประเภทอื่น ๆ ที่ให้หรือรับรองโดย TradingView อ่านเพิ่มเติมที่ ข้อกำหนดการใช้งาน