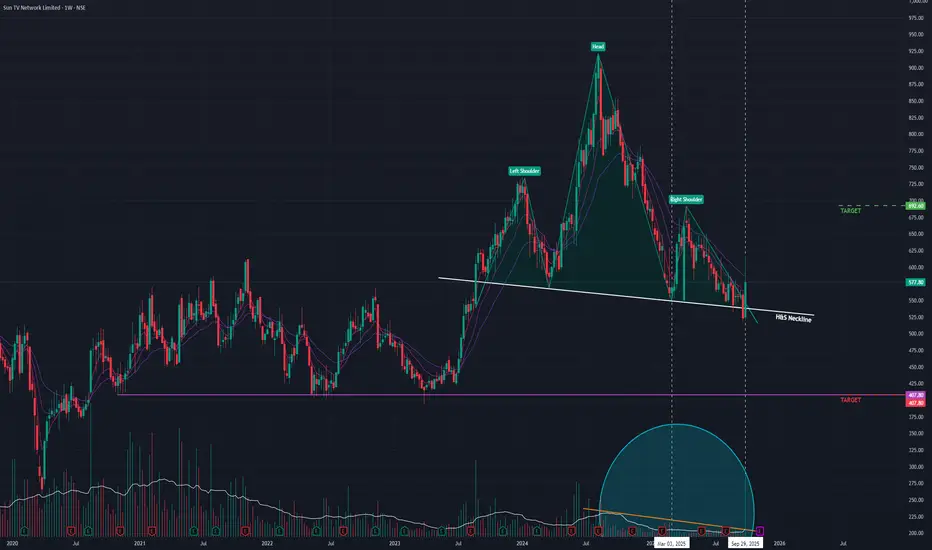
Sun TV has formed a classic Head and Shoulders pattern, a well-known technical formation that typically signals a bearish trend reversal. The stock is currently trading near the critical "neckline" support of this pattern. A decisive break below this level would confirm the pattern and could signal the start of a significant downtrend.
Supporting Bearish Indicators 📉
The bearish outlook is further supported by volume trends:
- Declining Volume: The average trading volume has been decreasing, which generally indicates a lack of buying interest and conviction in the current price levels. While there have been occasional volume spikes, the overall trend is weak.
Outlook and Key Levels
The price action in the coming weeks will be crucial. The key event to watch for is a breakdown below the pattern's neckline.
- Bearish Case: A confirmed breakdown below the neckline would validate the Head and Shoulders pattern. In this scenario, the stock could enter a bearish phase with a potential downside price target near the ₹407 level.
- Bullish Reversal: Conversely, if the neckline holds as strong support and the stock reverses its current trajectory, a move back towards the ₹692 resistance level could be possible.
Disclaimer: This analysis is my personal view & for educational purposes only. They shall not be construed as trade or investment advice. Before making any financial decision, it is imperative that you consult with a qualified financial professional.
คำจำกัดสิทธิ์ความรับผิดชอบ
ข้อมูลและบทความไม่ได้มีวัตถุประสงค์เพื่อก่อให้เกิดกิจกรรมทางการเงิน, การลงทุน, การซื้อขาย, ข้อเสนอแนะ หรือคำแนะนำประเภทอื่น ๆ ที่ให้หรือรับรองโดย TradingView อ่านเพิ่มเติมที่ ข้อกำหนดการใช้งาน