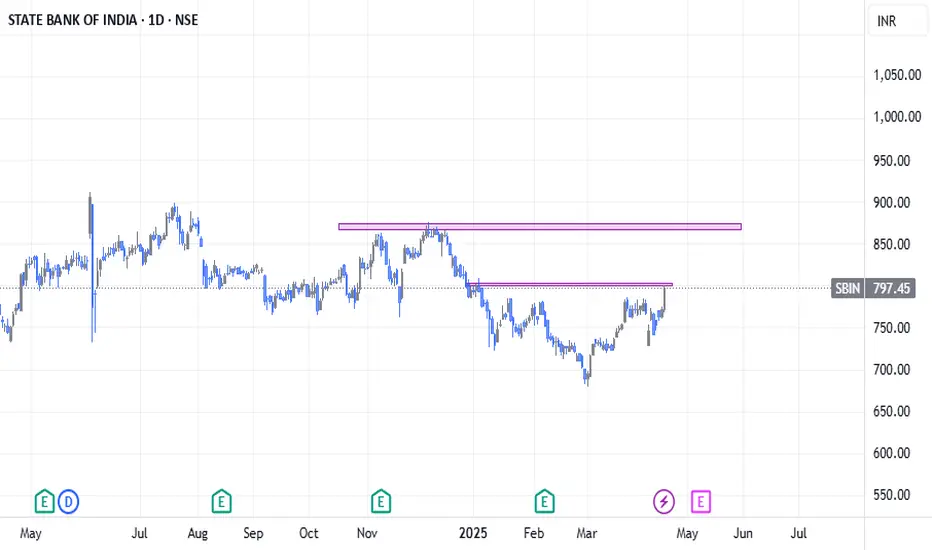
📈 Technical Analysis:
Strong breakout seen on the daily chart after price moved above a key neckline zone, signaling potential trend reversal.
Price has also closed above the 200-day moving average (200 MA) on the daily timeframe – a strong bullish indicator.
On the weekly chart, there's noticeable buying momentum, with a breakout above the 50-week moving average (50 MA), confirming strength on a higher timeframe.
📊 Overall View:
Multiple bullish confirmations across daily and weekly charts suggest further upside potential.
A successful of the breakout zone could lead to strong upward continuation.
✅ Bias: Bullish
🔎 Watch Levels:
Support: Breakout zone / 200 MA
Resistance: Previous swing highs
🚫 Disclaimer: This is not financial advice. Please do your own research and consult your financial advisor before making any investment decisions.
ปิดการเทรด: ถึงเป้าหมายการทำกำไร
คำจำกัดสิทธิ์ความรับผิดชอบ
ข้อมูลและบทความไม่ได้มีวัตถุประสงค์เพื่อก่อให้เกิดกิจกรรมทางการเงิน, การลงทุน, การซื้อขาย, ข้อเสนอแนะ หรือคำแนะนำประเภทอื่น ๆ ที่ให้หรือรับรองโดย TradingView อ่านเพิ่มเติมใน ข้อกำหนดการใช้งาน
คำจำกัดสิทธิ์ความรับผิดชอบ
ข้อมูลและบทความไม่ได้มีวัตถุประสงค์เพื่อก่อให้เกิดกิจกรรมทางการเงิน, การลงทุน, การซื้อขาย, ข้อเสนอแนะ หรือคำแนะนำประเภทอื่น ๆ ที่ให้หรือรับรองโดย TradingView อ่านเพิ่มเติมใน ข้อกำหนดการใช้งาน