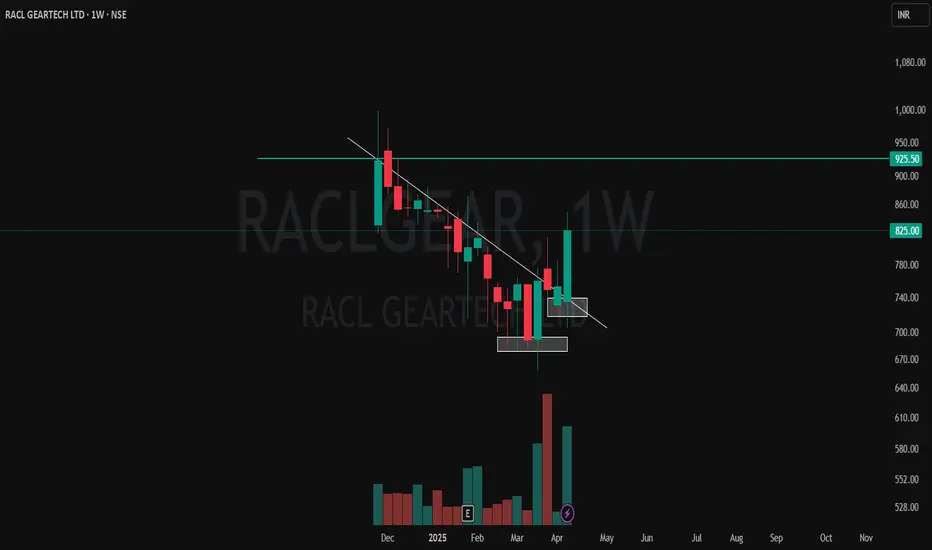
✅ White Line: Represents a well-respected CT trendline — multiple touches before finally getting broken with conviction.
✅ Volume Breakout: Strong volume spike confirms the breakout — classic case of price and volume moving in sync.
✅ White Zones: Marking clear Higher Low formations — price respecting structure before launching up.
✅ Green-Cyan Line: Marks a multi-timeframe supply zone. This level will be critical for continuation or rejection watch.
Structure, volume, and context are lining up — keeping this one on radar for further price action development. 📊
🎯 Master My Self-Made Trading Strategy
📈 Telegram (Learn Today): t.me/hashtaghammer
✅ WhatsApp (Learn Today): wa.me/919455664601
📈 Telegram (Learn Today): t.me/hashtaghammer
✅ WhatsApp (Learn Today): wa.me/919455664601
การนำเสนอที่เกี่ยวข้อง
คำจำกัดสิทธิ์ความรับผิดชอบ
ข้อมูลและบทความไม่ได้มีวัตถุประสงค์เพื่อก่อให้เกิดกิจกรรมทางการเงิน, การลงทุน, การซื้อขาย, ข้อเสนอแนะ หรือคำแนะนำประเภทอื่น ๆ ที่ให้หรือรับรองโดย TradingView อ่านเพิ่มเติมใน ข้อกำหนดการใช้งาน