NVDA – Coiling Tight for a Big Move as Gamma Levels Draw the Battle Lines ⚡️
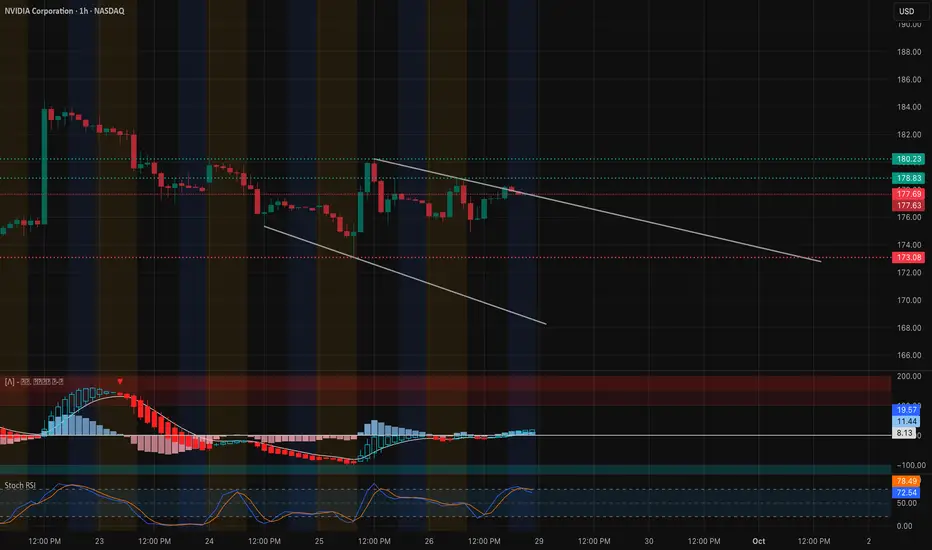
1-Hour Technical Outlook NVIDIA has been grinding inside a narrowing descending channel after its recent selloff, with intraday price now stabilizing around $177–$178. A series of higher lows over the last two sessions hint at basing, but the short-term downtrend line from the $185 zone still caps upside. MACD histogram just turned positive and the Stoch RSI is pointing higher, signaling an early shift in momentum. Immediate resistance sits at $180.2, followed by the heavy supply zone between $182.5 and $185. Key support levels are $175 (short-term pivot) and $172–$170 (structural demand).
Gamma Exposure (GEX) Confirmation

The options landscape reinforces these technical pivots:
* Major Call Wall / Max positive GEX is stacked at $185, with ~45% of call positioning concentrated there.
* Secondary call concentration: $182.5 (~39% call wall).
* Strong put support: $172.5 and $170, matching the lower trend channel and recent lows.
This setup suggests a gamma squeeze could ignite if NVDA breaks and holds above $180.2, where dealer hedging may accelerate upside toward $182.5–$185. Conversely, a loss of $175 would expose $172 and potentially $170 as downside magnets.
Trade Ideas & Option Plays for This Week
* Bullish Setup: Long above $180.2 with targets at $182.5 and $185. Ideal options: 1-week 180 or 182.5 calls, or 180/185 debit spreads to lower premium.
* Bearish Scenario: Breakdown below $175 opens room to $172 and $170. Traders can look at short-dated puts or vertical spreads such as 175/170.
* With IVR around 5.3 and IVx near 39, premiums are still modest—an advantage for debit spreads.
My Take:
NVDA is in a classic coiling pattern. Momentum oscillators are leaning bullish, but price must clear $180.2 to validate a trend reversal. The gamma map perfectly matches these breakout levels, giving confidence to the setup. Keep a tight stop below $175 if going long, and be ready to flip short if sellers reclaim control.
Disclaimer: This analysis is for educational purposes only and does not constitute financial advice. Always do your own research and manage risk before trading.
1-Hour Technical Outlook NVIDIA has been grinding inside a narrowing descending channel after its recent selloff, with intraday price now stabilizing around $177–$178. A series of higher lows over the last two sessions hint at basing, but the short-term downtrend line from the $185 zone still caps upside. MACD histogram just turned positive and the Stoch RSI is pointing higher, signaling an early shift in momentum. Immediate resistance sits at $180.2, followed by the heavy supply zone between $182.5 and $185. Key support levels are $175 (short-term pivot) and $172–$170 (structural demand).
Gamma Exposure (GEX) Confirmation
The options landscape reinforces these technical pivots:
* Major Call Wall / Max positive GEX is stacked at $185, with ~45% of call positioning concentrated there.
* Secondary call concentration: $182.5 (~39% call wall).
* Strong put support: $172.5 and $170, matching the lower trend channel and recent lows.
This setup suggests a gamma squeeze could ignite if NVDA breaks and holds above $180.2, where dealer hedging may accelerate upside toward $182.5–$185. Conversely, a loss of $175 would expose $172 and potentially $170 as downside magnets.
Trade Ideas & Option Plays for This Week
* Bullish Setup: Long above $180.2 with targets at $182.5 and $185. Ideal options: 1-week 180 or 182.5 calls, or 180/185 debit spreads to lower premium.
* Bearish Scenario: Breakdown below $175 opens room to $172 and $170. Traders can look at short-dated puts or vertical spreads such as 175/170.
* With IVR around 5.3 and IVx near 39, premiums are still modest—an advantage for debit spreads.
My Take:
NVDA is in a classic coiling pattern. Momentum oscillators are leaning bullish, but price must clear $180.2 to validate a trend reversal. The gamma map perfectly matches these breakout levels, giving confidence to the setup. Keep a tight stop below $175 if going long, and be ready to flip short if sellers reclaim control.
Disclaimer: This analysis is for educational purposes only and does not constitute financial advice. Always do your own research and manage risk before trading.
คำจำกัดสิทธิ์ความรับผิดชอบ
ข้อมูลและบทความไม่ได้มีวัตถุประสงค์เพื่อก่อให้เกิดกิจกรรมทางการเงิน, การลงทุน, การซื้อขาย, ข้อเสนอแนะ หรือคำแนะนำประเภทอื่น ๆ ที่ให้หรือรับรองโดย TradingView อ่านเพิ่มเติมที่ ข้อกำหนดการใช้งาน
คำจำกัดสิทธิ์ความรับผิดชอบ
ข้อมูลและบทความไม่ได้มีวัตถุประสงค์เพื่อก่อให้เกิดกิจกรรมทางการเงิน, การลงทุน, การซื้อขาย, ข้อเสนอแนะ หรือคำแนะนำประเภทอื่น ๆ ที่ให้หรือรับรองโดย TradingView อ่านเพิ่มเติมที่ ข้อกำหนดการใช้งาน