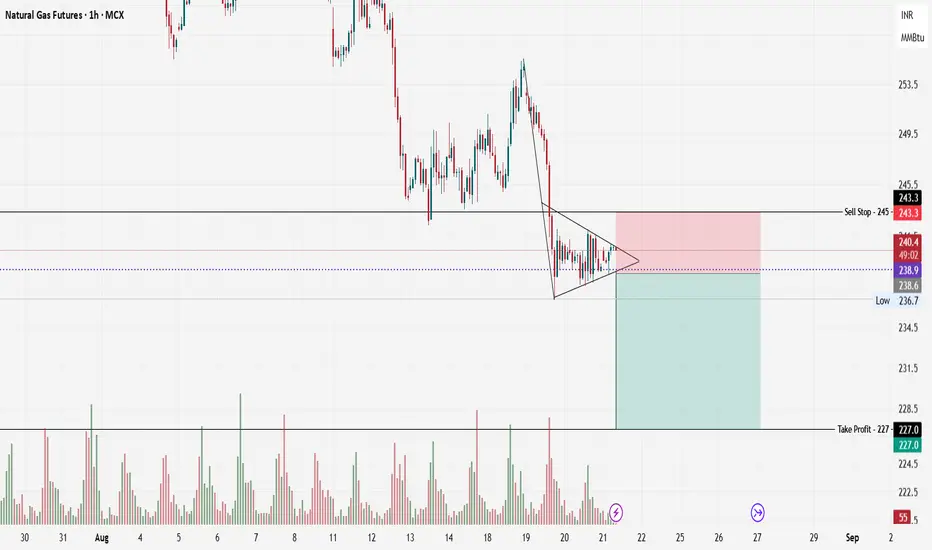
Here is my Natural Gas Futures (MCX, 1H) chart classic—candlesticks analysis.
Pattern Identification: The Bearish Pennant
I’ve spotted a textbook bearish pennant. Here’s how it forms and functions:
The pattern starts with a pronounced downward thrust (the flagpole), reflecting strong selling momentum.
Price action then contracts into a symmetrical triangle, as shown by the converging trend lines.
This pennant shape is a market’s “pause”: sellers digest gains, buyers offer token support, but neither side has control—for now.
The expectation “by the book” is that this pattern serves as a continuation formation, where a breakout (typically downward, in line with the preceding move) resumes the established trend.
Pattern Validation & Invalidation
Validation Criteria
Clear Downtrend: The initial flagpole is rapid and steep, matching textbook requirements.
Symmetrical Contraction: Multiple touches on both trendlines without breaking out show healthy consolidation.
Volume Confirmation: Notice how volume spikes before the consolidation, then diminishes as the pennant forms—a classic and critical signal. Lower volume during consolidation signifies indecision; a surge in volume on breakout validates the move.
Defined Risk/Reward: Levels for stop loss and target are clear and logical, anchored to visible support/resistance.
Invalidation Criteria
False Breakouts: If price breaks above the pennant’s upper boundary and sustains, the pattern is invalid.
Volume Anomaly: A breakout without accompanying volume suggests the move may not be trustworthy.
Failure to Breakout: Prolonged sideways action beyond the pennant’s apex reduces the pattern’s predictive value.
Capitalizing on the Analysis
If I want to turn this analytical insight into a trading opportunity, I’ll approach it methodically:
Wait for Confirmation: Act on the trade only when price closes below the lower trendline, and I’d like to see a volume spike to validate the breakout.
Set Entry and Risk: I position an entry order (sell stop) just below the pattern, around ₹238.6–₹240.
Define Stop Loss: I place my stop loss slightly above the upper pennant boundary—just above ₹243.3—to safeguard against failed breakdowns.
Calculate Target: My target is derived from the measured move principle—project the flagpole’s length from the breakout point, which centres the take profit around ₹227.
Size the Trade: I ensure my trade size aligns with my risk tolerance, strictly following capital management principles.
By systematically applying these rules, I aim to capitalize on the high-probability move that often follows a valid bearish pennant pattern.
Technical Chart Analyst
Track: Indian & US Markets
Indices | Commodities | Crypto
Telegram: @ChartPathik for NSE & MCX
& @ChartPathik_Global for US Ins. & Crypto
WhatsApp: +91-99293-91467 for updates.
Track: Indian & US Markets
Indices | Commodities | Crypto
Telegram: @ChartPathik for NSE & MCX
& @ChartPathik_Global for US Ins. & Crypto
WhatsApp: +91-99293-91467 for updates.
คำจำกัดสิทธิ์ความรับผิดชอบ
ข้อมูลและบทความไม่ได้มีวัตถุประสงค์เพื่อก่อให้เกิดกิจกรรมทางการเงิน, การลงทุน, การซื้อขาย, ข้อเสนอแนะ หรือคำแนะนำประเภทอื่น ๆ ที่ให้หรือรับรองโดย TradingView อ่านเพิ่มเติมที่ ข้อกำหนดการใช้งาน