Hello Traders!
Today’s session we have an explosive breakout on record volumes. The setup is not only backed by price action but also confirmed by multiple technical indicators such as RSI, Bollinger Bands, SuperTrend, VWAP, and BB Squeeze. Let’s decode this in detail 👇
________________________________________________________________________________
________________________________________________________________________________
JBM Auto Ltd (NSE: JBMA)
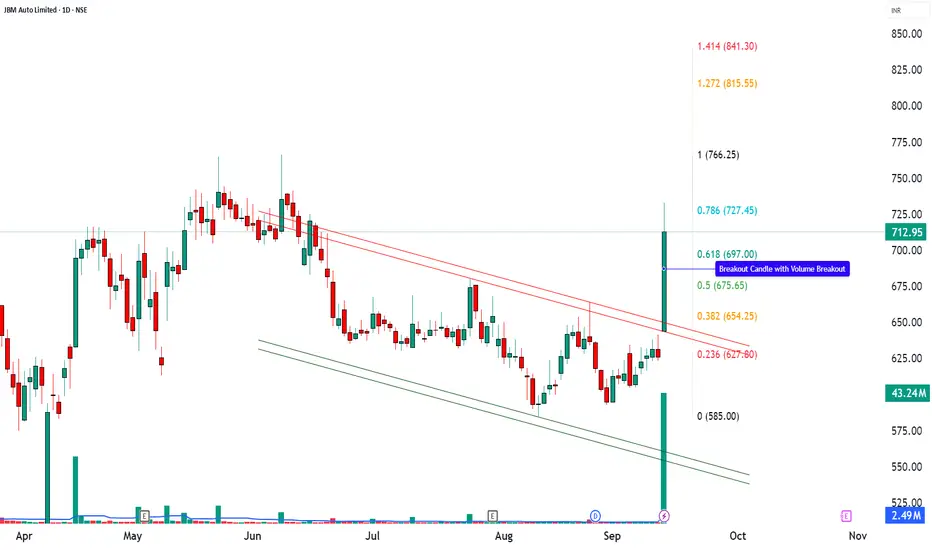
CMP: 712.95 (+13.92%)
Breakout: Strong 52-week volume breakout with momentum
Key Supports: 660 / 608 / 571
Key Resistances: 749 / 785 / 838
Setup Explanation
JBM Auto delivered a powerful bullish breakout candle backed by 20x volume against its average, confirming strong accumulation. The stock has broken a long-term downtrend with a surge in momentum. This looks like a technically strong breakout setup as per chart patterns, but risks remain. The chart highlights multiple bullish signals: RSI breakout ⚡ shows renewed strength. Bollinger Band breakout 📊 signals volatility expansion. Bullish SuperTrend & VWAP align with upward momentum. BB Squeeze Off 🔥 confirms the end of consolidation and beginning of a trending move. As long as the stock holds above 697–712, momentum is likely to extend towards higher resistances, with 843 as a near-term swing target. A sustained close below 607 would negate the bullish structure.
Latest Update – JBM Auto (JBMA)
JBM Auto is buzzing after its subsidiary JBM Ecolife Mobility secured a $100 million investment from IFC, marking IFC’s largest e-mobility funding in India. The capital will accelerate deployment of over 1,400 electric buses across multiple states, boosting JBMA’s already strong ₹12,900 crore order book. The stock surged ~9–11% on record volumes as the news reinforced confidence in India’s EV and green mobility push.
While momentum is strong, analysts also flag elevated valuations, thin margins, and execution risks, making it important for traders to watch key levels closely.
Investment Outlook & Conclusion
Bullish Case – The stock has given a 52-week breakout with 20x average volumes. If momentum sustains, it may attempt levels of ₹749 → ₹785 → ₹815 → ₹838 → ₹843.
Bearish Case – A sustained slip below ₹622 could weaken the structure and open downside risk.
Momentum Case – Current price action with heavy volumes indicates a short-term momentum phase. However, this is a high-risk, high-reward scenario suitable only for aggressive swing setups.
Perspective – Short-term structure is positive, while long-term outcomes will depend on execution of EV bus orders, government policy support, and maintaining profitability margins.
📊 STWP Trade Analysis – JBM Auto (JBMA)
👉 In my chart study, I have marked ₹732.80 as an entry level with ₹621.95 as an invalidation level.
👉 If the stock dips towards ₹627–607 (Pullback Zone), I will treat it as a conservative re-entry with tighter risk.
Invalidation Level: A sustained move below ₹607 will negate my bullish view.
⚠️ This is my swing trading approach as long as supports hold, shared only for learning how I structure trades. It is not a buy/sell recommendation.
________________________________________________________________________________
________________________________________________________________________________
⚠️ Disclaimer – Please Read Carefully
The information shared here is meant purely for learning and awareness. It is not a buy or sell recommendation and should not be taken as investment advice. I am not a SEBI-registered investment advisor, and all views expressed are based on personal study, chart patterns, and publicly available market data.
Trading — whether in stocks or options — carries risk. Markets can move unexpectedly, and losses can sometimes exceed the money you have invested. Past performance or past setups do not guarantee future results.
If you are a beginner, treat this as a guide to understand how the market works — practice on paper trades before risking real money. If you are experienced, always assess your own risk, position sizing, and strategy suitability before entering trades.
Consult a SEBI-registered financial advisor before making any real trading decision. By engaging with this content, you acknowledge full responsibility for your trades and investments.
💬 Found this useful?
🔼 Give this post a Boost to help more traders discover clean, structured learning.
✍️ Drop your thoughts, questions, or setups in the comments — let’s grow together!
🔁 Share with fellow traders and beginners to spread awareness.
👉 “If you liked this breakdown, follow for more clean, structured setups with discipline at the core.”
🚀 Stay Calm. Stay Clean. Trade With Patience.
Trade Smart | Learn Zones | Be Self-Reliant 📊
Today’s session we have an explosive breakout on record volumes. The setup is not only backed by price action but also confirmed by multiple technical indicators such as RSI, Bollinger Bands, SuperTrend, VWAP, and BB Squeeze. Let’s decode this in detail 👇
________________________________________________________________________________
________________________________________________________________________________
JBM Auto Ltd (NSE: JBMA)
CMP: 712.95 (+13.92%)
Breakout: Strong 52-week volume breakout with momentum
Key Supports: 660 / 608 / 571
Key Resistances: 749 / 785 / 838
Setup Explanation
JBM Auto delivered a powerful bullish breakout candle backed by 20x volume against its average, confirming strong accumulation. The stock has broken a long-term downtrend with a surge in momentum. This looks like a technically strong breakout setup as per chart patterns, but risks remain. The chart highlights multiple bullish signals: RSI breakout ⚡ shows renewed strength. Bollinger Band breakout 📊 signals volatility expansion. Bullish SuperTrend & VWAP align with upward momentum. BB Squeeze Off 🔥 confirms the end of consolidation and beginning of a trending move. As long as the stock holds above 697–712, momentum is likely to extend towards higher resistances, with 843 as a near-term swing target. A sustained close below 607 would negate the bullish structure.
Latest Update – JBM Auto (JBMA)
JBM Auto is buzzing after its subsidiary JBM Ecolife Mobility secured a $100 million investment from IFC, marking IFC’s largest e-mobility funding in India. The capital will accelerate deployment of over 1,400 electric buses across multiple states, boosting JBMA’s already strong ₹12,900 crore order book. The stock surged ~9–11% on record volumes as the news reinforced confidence in India’s EV and green mobility push.
While momentum is strong, analysts also flag elevated valuations, thin margins, and execution risks, making it important for traders to watch key levels closely.
Investment Outlook & Conclusion
Bullish Case – The stock has given a 52-week breakout with 20x average volumes. If momentum sustains, it may attempt levels of ₹749 → ₹785 → ₹815 → ₹838 → ₹843.
Bearish Case – A sustained slip below ₹622 could weaken the structure and open downside risk.
Momentum Case – Current price action with heavy volumes indicates a short-term momentum phase. However, this is a high-risk, high-reward scenario suitable only for aggressive swing setups.
Perspective – Short-term structure is positive, while long-term outcomes will depend on execution of EV bus orders, government policy support, and maintaining profitability margins.
📊 STWP Trade Analysis – JBM Auto (JBMA)
👉 In my chart study, I have marked ₹732.80 as an entry level with ₹621.95 as an invalidation level.
👉 If the stock dips towards ₹627–607 (Pullback Zone), I will treat it as a conservative re-entry with tighter risk.
Invalidation Level: A sustained move below ₹607 will negate my bullish view.
⚠️ This is my swing trading approach as long as supports hold, shared only for learning how I structure trades. It is not a buy/sell recommendation.
________________________________________________________________________________
________________________________________________________________________________
⚠️ Disclaimer – Please Read Carefully
The information shared here is meant purely for learning and awareness. It is not a buy or sell recommendation and should not be taken as investment advice. I am not a SEBI-registered investment advisor, and all views expressed are based on personal study, chart patterns, and publicly available market data.
Trading — whether in stocks or options — carries risk. Markets can move unexpectedly, and losses can sometimes exceed the money you have invested. Past performance or past setups do not guarantee future results.
If you are a beginner, treat this as a guide to understand how the market works — practice on paper trades before risking real money. If you are experienced, always assess your own risk, position sizing, and strategy suitability before entering trades.
Consult a SEBI-registered financial advisor before making any real trading decision. By engaging with this content, you acknowledge full responsibility for your trades and investments.
💬 Found this useful?
🔼 Give this post a Boost to help more traders discover clean, structured learning.
✍️ Drop your thoughts, questions, or setups in the comments — let’s grow together!
🔁 Share with fellow traders and beginners to spread awareness.
👉 “If you liked this breakdown, follow for more clean, structured setups with discipline at the core.”
🚀 Stay Calm. Stay Clean. Trade With Patience.
Trade Smart | Learn Zones | Be Self-Reliant 📊
📊 STWP | Mentor | Demand & Supply Specialist
🎯 Helping you become a self-reliant & independent trader
🎓 Trade with Clarity. Learn with Patience: simpletradewithpatience.com | bit.ly/stwpcommunity
Educational Only: wa.me/919987567889
🎯 Helping you become a self-reliant & independent trader
🎓 Trade with Clarity. Learn with Patience: simpletradewithpatience.com | bit.ly/stwpcommunity
Educational Only: wa.me/919987567889
คำจำกัดสิทธิ์ความรับผิดชอบ
ข้อมูลและบทความไม่ได้มีวัตถุประสงค์เพื่อก่อให้เกิดกิจกรรมทางการเงิน, การลงทุน, การซื้อขาย, ข้อเสนอแนะ หรือคำแนะนำประเภทอื่น ๆ ที่ให้หรือรับรองโดย TradingView อ่านเพิ่มเติมที่ ข้อกำหนดการใช้งาน