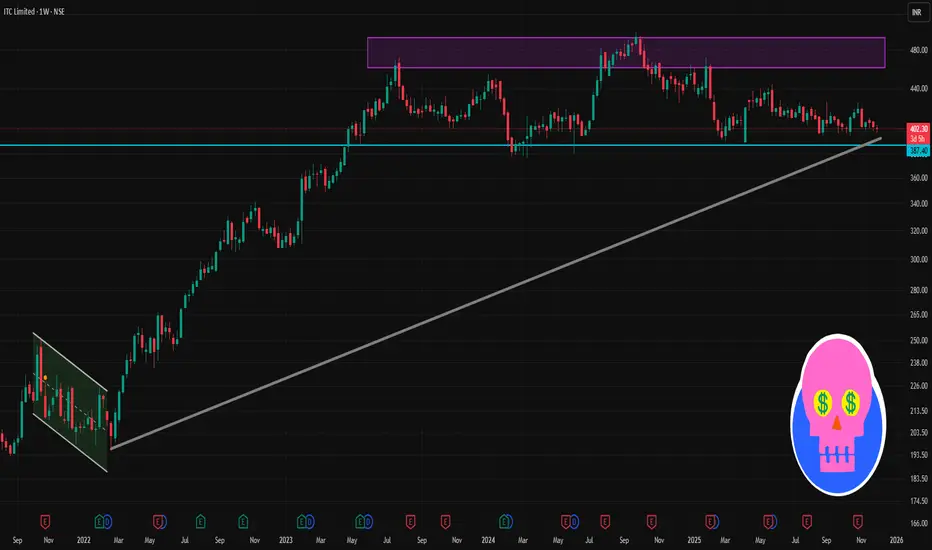
📈 Recent 1-Week Performance
Around Dec 2 2025, ITC is trading ~ ₹403–404.
Over last 1 week, the stock has moved up roughly +0.5 % to +0.6 % according to available weekly return data.
The 7-day exponential moving average (EMA) is also near ~₹402 — which suggests price is close to short-term average, not showing sharp divergence yet.
✅ What Price Action Would Suggest
If price holds above ₹402–403 and breaks above ₹405–407, that could indicate short-term bullish bias.
If price falls below ₹400, watch for possible further drop — support zone is ~₹398; a sharp break could shift short-term sentiment negative.
If price consolidates between ~₹402 and ~₹407, expect range-bound behaviour until a clear breakout or breakdown.
การนำเสนอที่เกี่ยวข้อง
คำจำกัดสิทธิ์ความรับผิดชอบ
ข้อมูลและบทความไม่ได้มีวัตถุประสงค์เพื่อก่อให้เกิดกิจกรรมทางการเงิน, การลงทุน, การซื้อขาย, ข้อเสนอแนะ หรือคำแนะนำประเภทอื่น ๆ ที่ให้หรือรับรองโดย TradingView อ่านเพิ่มเติมใน ข้อกำหนดการใช้งาน
การนำเสนอที่เกี่ยวข้อง
คำจำกัดสิทธิ์ความรับผิดชอบ
ข้อมูลและบทความไม่ได้มีวัตถุประสงค์เพื่อก่อให้เกิดกิจกรรมทางการเงิน, การลงทุน, การซื้อขาย, ข้อเสนอแนะ หรือคำแนะนำประเภทอื่น ๆ ที่ให้หรือรับรองโดย TradingView อ่านเพิ่มเติมใน ข้อกำหนดการใช้งาน