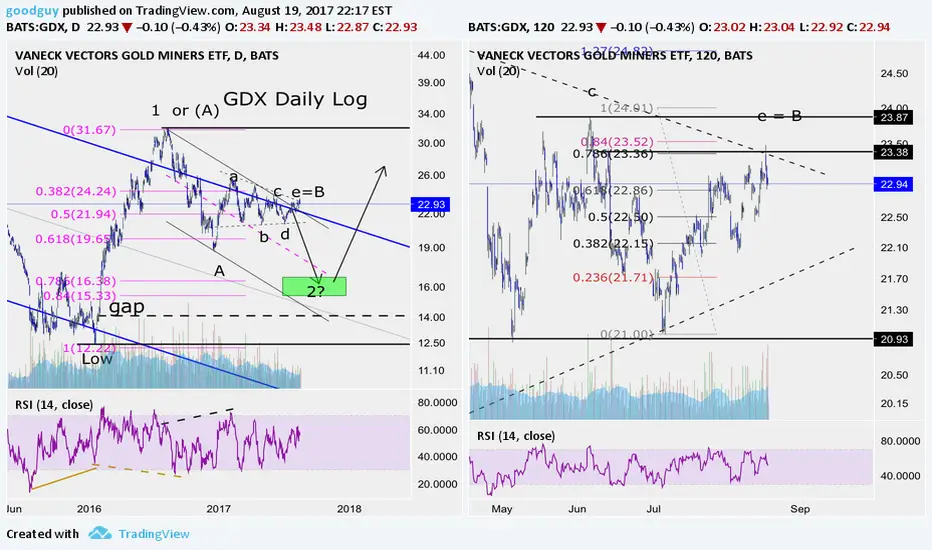
Although I am longer term bullish I am intermediate term bearish and short. I think the sideways triangle is very likely complete with wave "e" going to .78 of wave"c" then reversing intraday for a bearish engulfment candle for the day Would not be be surprised to see it open lower Monday then bounce to retest Friday's high but fail. If price goes above "c" then I'm wrong. Hope this will be helpful.
การซื้อขายยังคงดำเนินอยู่
Getting very close to moment of truth:ปิดการเทรด: ถึงเป้าหมายการตัดขาดทุน
การนำเสนอที่เกี่ยวข้อง
คำจำกัดสิทธิ์ความรับผิดชอบ
ข้อมูลและบทความไม่ได้มีวัตถุประสงค์เพื่อก่อให้เกิดกิจกรรมทางการเงิน, การลงทุน, การซื้อขาย, ข้อเสนอแนะ หรือคำแนะนำประเภทอื่น ๆ ที่ให้หรือรับรองโดย TradingView อ่านเพิ่มเติมใน ข้อกำหนดการใช้งาน
การนำเสนอที่เกี่ยวข้อง
คำจำกัดสิทธิ์ความรับผิดชอบ
ข้อมูลและบทความไม่ได้มีวัตถุประสงค์เพื่อก่อให้เกิดกิจกรรมทางการเงิน, การลงทุน, การซื้อขาย, ข้อเสนอแนะ หรือคำแนะนำประเภทอื่น ๆ ที่ให้หรือรับรองโดย TradingView อ่านเพิ่มเติมใน ข้อกำหนดการใช้งาน