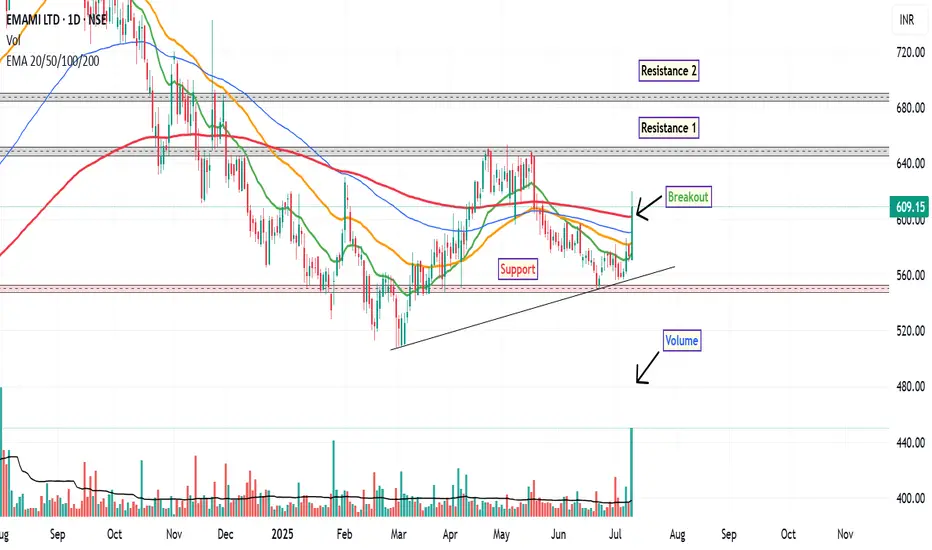
Following a prolonged downtrend that began in September 2024, EMAMI Ltd. has recently exhibited signs of a potential short-term trend reversal on the daily chart. The stock has demonstrated a notable uptick in momentum, marked by several key technical developments.
The stock has decisively moved above its 200-day EMA, a level often regarded as a long-term trend indicator. This breakout was accompanied by a significant increase in trading volume—approximately 5 times the average volume of the 50-day moving average, suggesting heightened market participation. The RSI has crossed above the 60 level, indicating strengthening bullish momentum, though it is approaching the overbought zone.
A bullish crossover in the MACD was observed, further supporting the case for near-term strength.
Around ₹600, where the stock is currently consolidating post-breakout. First resistance near ₹650, Second resistance around ₹690. A technical stop-loss could be considered below ₹548, aligning with recent swing lows and support levels.
Disclaimer: This analysis is intended solely for educational and informational purposes. It does not constitute investment advice or a recommendation to buy or sell any financial instrument. Market participants are encouraged to conduct their own research or consult with a qualified financial advisor before making any trading decisions.
ปิดการเทรด: ถึงเป้าหมายการตัดขาดทุน
Stoploss Hit, Trade Closeคำจำกัดสิทธิ์ความรับผิดชอบ
ข้อมูลและบทความไม่ได้มีวัตถุประสงค์เพื่อก่อให้เกิดกิจกรรมทางการเงิน, การลงทุน, การซื้อขาย, ข้อเสนอแนะ หรือคำแนะนำประเภทอื่น ๆ ที่ให้หรือรับรองโดย TradingView อ่านเพิ่มเติมใน ข้อกำหนดการใช้งาน
คำจำกัดสิทธิ์ความรับผิดชอบ
ข้อมูลและบทความไม่ได้มีวัตถุประสงค์เพื่อก่อให้เกิดกิจกรรมทางการเงิน, การลงทุน, การซื้อขาย, ข้อเสนอแนะ หรือคำแนะนำประเภทอื่น ๆ ที่ให้หรือรับรองโดย TradingView อ่านเพิ่มเติมใน ข้อกำหนดการใช้งาน