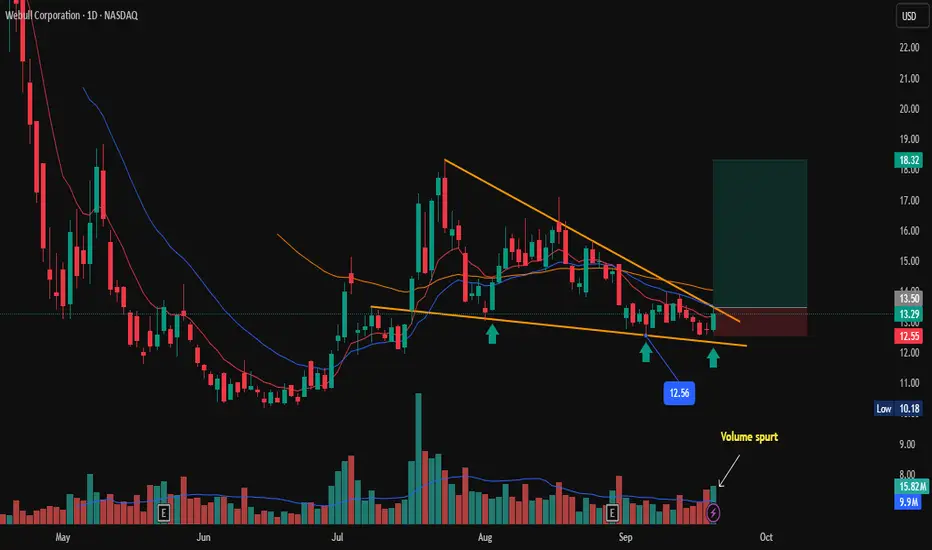
Webbull Corporation shows signs of a potential long opportunity after forming a Bullish reversal pattern (falling wedge) on the daily chart. Price respecting a trendline, and Volume spurt on last trading session. signaling Bullish momentum. hinting at a possible uptrend initiation.
Key Levels to Watch:
Immediate support at $12.56 (immediate low)
Trade Plan:
Enter long above $13.50 on confirmation of bullish candle close.
Stop loss above $12.60 to limit risk.
Target $18.00 as per falling wedge rule, or trail stop as price moves above.
Disclaimer: Risk management is crucial. so keep position sizing appropriate. This analysis is intended for educational purposes and not financial advice.
การซื้อขายยังคงดำเนินอยู่
Trade active SL @ costคำจำกัดสิทธิ์ความรับผิดชอบ
ข้อมูลและบทความไม่ได้มีวัตถุประสงค์เพื่อก่อให้เกิดกิจกรรมทางการเงิน, การลงทุน, การซื้อขาย, ข้อเสนอแนะ หรือคำแนะนำประเภทอื่น ๆ ที่ให้หรือรับรองโดย TradingView อ่านเพิ่มเติมที่ ข้อกำหนดการใช้งาน
คำจำกัดสิทธิ์ความรับผิดชอบ
ข้อมูลและบทความไม่ได้มีวัตถุประสงค์เพื่อก่อให้เกิดกิจกรรมทางการเงิน, การลงทุน, การซื้อขาย, ข้อเสนอแนะ หรือคำแนะนำประเภทอื่น ๆ ที่ให้หรือรับรองโดย TradingView อ่านเพิ่มเติมที่ ข้อกำหนดการใช้งาน