₿ BITCOIN: Multi-Phase Correction Scenario - Liquidity Hunt to Major Pullback
Sharing my broader outlook for Bitcoin's next major moves. This is a multi-timeframe analysis with several key phases. 🎯
**📍 Phase 1: Daily Dow Theory Reversal**
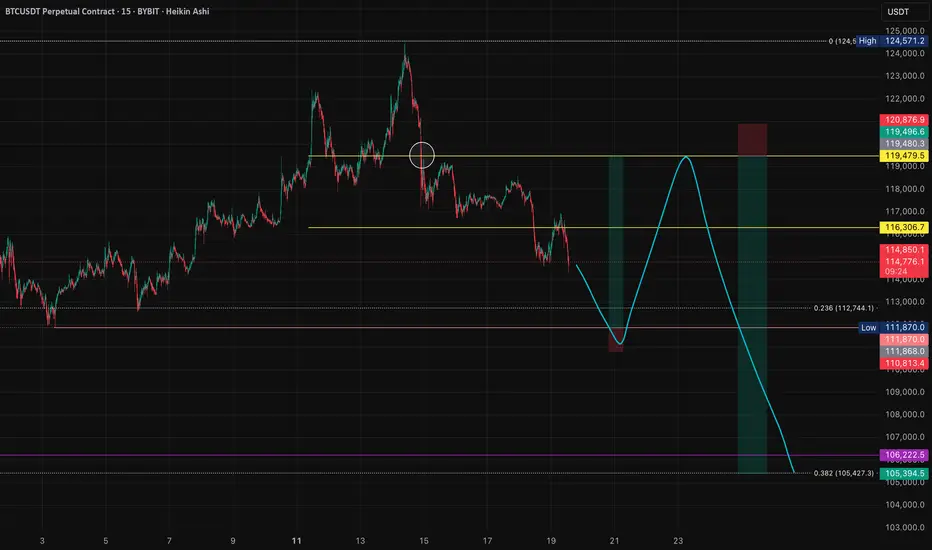
The pink line below marks the daily timeframe pivot point based on Dow Theory. I'm expecting a liquidity grab at this level first - sweeping out the stop losses parked below this key structural point. 🔄
**📈 Phase 2: The Counter-Trend Rally**
After the liquidity hunt, I'm looking for a recovery back toward the upper yellow horizontal line - this represents the recent range high. This would be a classic "fake-out" move to trap short-biased traders before the real decline begins. 🎭
**⏰ Time Factor Consideration:**
If this rally extends into next week or beyond, we might only see a recovery to the lower yellow horizontal line instead. **Time affects momentum** - the longer price takes to develop, the weaker the eventual bounce tends to be. 📅
**📉 Phase 3: The Main Event**
Finally, I'm anticipating a significant decline down to the purple line at the bottom - approximately the 0.382 Fibonacci level. This would represent the major corrective move. 🎯
**⚠️ Risk Management Note:**
I cannot provide a risk-to-reward ratio for this setup yet. **Why?** Because I don't know exactly how price will behave at each critical level, and the stop loss placement will depend on how the structure develops. The R/R calculation will determine whether I actually take this trade or pass on it. 📊
**🧠 Key Takeaway:**
This is a perfect example of why having a plan is different from having a trade. I know what I want to see, but I won't commit capital until the risk-to-reward makes sense. Patience pays in trading. ⏳
---
**Trading is simple.** You don't need multiple indicators or dozens of lines on your chart. A clean and simple chart often works best — it keeps your decisions consistent and reduces uncertainty. Sure, it might not look flashy, and my analysis may seem a bit "plain" compared to others… but that's how I like it. If you find this analysis useful, feel free to follow me for more updates.
---
*Disclaimer: This post is for general informational and educational purposes only. It does not constitute financial advice, investment recommendation, or a service targeting specific investors, and should not be considered illegal or restricted information in any jurisdiction.*
Sharing my broader outlook for Bitcoin's next major moves. This is a multi-timeframe analysis with several key phases. 🎯
**📍 Phase 1: Daily Dow Theory Reversal**
The pink line below marks the daily timeframe pivot point based on Dow Theory. I'm expecting a liquidity grab at this level first - sweeping out the stop losses parked below this key structural point. 🔄
**📈 Phase 2: The Counter-Trend Rally**
After the liquidity hunt, I'm looking for a recovery back toward the upper yellow horizontal line - this represents the recent range high. This would be a classic "fake-out" move to trap short-biased traders before the real decline begins. 🎭
**⏰ Time Factor Consideration:**
If this rally extends into next week or beyond, we might only see a recovery to the lower yellow horizontal line instead. **Time affects momentum** - the longer price takes to develop, the weaker the eventual bounce tends to be. 📅
**📉 Phase 3: The Main Event**
Finally, I'm anticipating a significant decline down to the purple line at the bottom - approximately the 0.382 Fibonacci level. This would represent the major corrective move. 🎯
**⚠️ Risk Management Note:**
I cannot provide a risk-to-reward ratio for this setup yet. **Why?** Because I don't know exactly how price will behave at each critical level, and the stop loss placement will depend on how the structure develops. The R/R calculation will determine whether I actually take this trade or pass on it. 📊
**🧠 Key Takeaway:**
This is a perfect example of why having a plan is different from having a trade. I know what I want to see, but I won't commit capital until the risk-to-reward makes sense. Patience pays in trading. ⏳
---
**Trading is simple.** You don't need multiple indicators or dozens of lines on your chart. A clean and simple chart often works best — it keeps your decisions consistent and reduces uncertainty. Sure, it might not look flashy, and my analysis may seem a bit "plain" compared to others… but that's how I like it. If you find this analysis useful, feel free to follow me for more updates.
---
*Disclaimer: This post is for general informational and educational purposes only. It does not constitute financial advice, investment recommendation, or a service targeting specific investors, and should not be considered illegal or restricted information in any jurisdiction.*
คำจำกัดสิทธิ์ความรับผิดชอบ
ข้อมูลและบทความไม่ได้มีวัตถุประสงค์เพื่อก่อให้เกิดกิจกรรมทางการเงิน, การลงทุน, การซื้อขาย, ข้อเสนอแนะ หรือคำแนะนำประเภทอื่น ๆ ที่ให้หรือรับรองโดย TradingView อ่านเพิ่มเติมที่ ข้อกำหนดการใช้งาน
คำจำกัดสิทธิ์ความรับผิดชอบ
ข้อมูลและบทความไม่ได้มีวัตถุประสงค์เพื่อก่อให้เกิดกิจกรรมทางการเงิน, การลงทุน, การซื้อขาย, ข้อเสนอแนะ หรือคำแนะนำประเภทอื่น ๆ ที่ให้หรือรับรองโดย TradingView อ่านเพิ่มเติมที่ ข้อกำหนดการใช้งาน