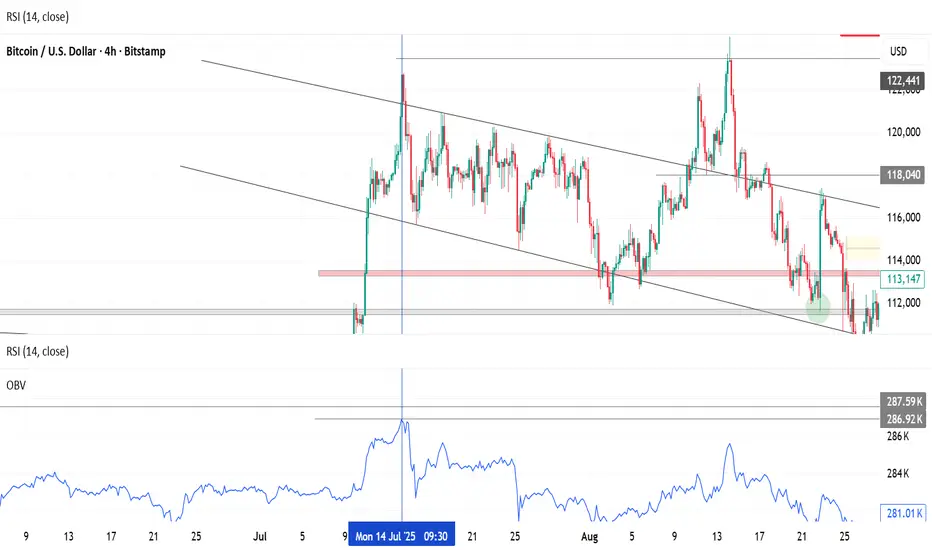
This 4-hour chart of Bitcoin (BTC/USD) highlights a breakout from a descending channel after a prolonged consolidation phase lasting over 16 days (99 bars).
🔻 A clearly defined supply zone (marked in red) acted as a major resistance area, rejecting price multiple times before the breakout. The breakout above this zone indicates a shift in market structure, with bullish momentum gaining strength.
🟡 The breakout was followed by sustained buying pressure, pushing BTC upwards toward the $118,000 region. Price has since pulled back slightly and is now hovering around $115,500 — retesting the previous resistance zone, now potentially acting as support
คำจำกัดสิทธิ์ความรับผิดชอบ
ข้อมูลและบทความไม่ได้มีวัตถุประสงค์เพื่อก่อให้เกิดกิจกรรมทางการเงิน, การลงทุน, การซื้อขาย, ข้อเสนอแนะ หรือคำแนะนำประเภทอื่น ๆ ที่ให้หรือรับรองโดย TradingView อ่านเพิ่มเติมใน ข้อกำหนดการใช้งาน
คำจำกัดสิทธิ์ความรับผิดชอบ
ข้อมูลและบทความไม่ได้มีวัตถุประสงค์เพื่อก่อให้เกิดกิจกรรมทางการเงิน, การลงทุน, การซื้อขาย, ข้อเสนอแนะ หรือคำแนะนำประเภทอื่น ๆ ที่ให้หรือรับรองโดย TradingView อ่านเพิ่มเติมใน ข้อกำหนดการใช้งาน