Hello
It's a Bitcoin Guide.
If you "follow"
You can receive real-time movement paths and comment notifications on major sections.
If my analysis was helpful,
Please click the booster button at the bottom.

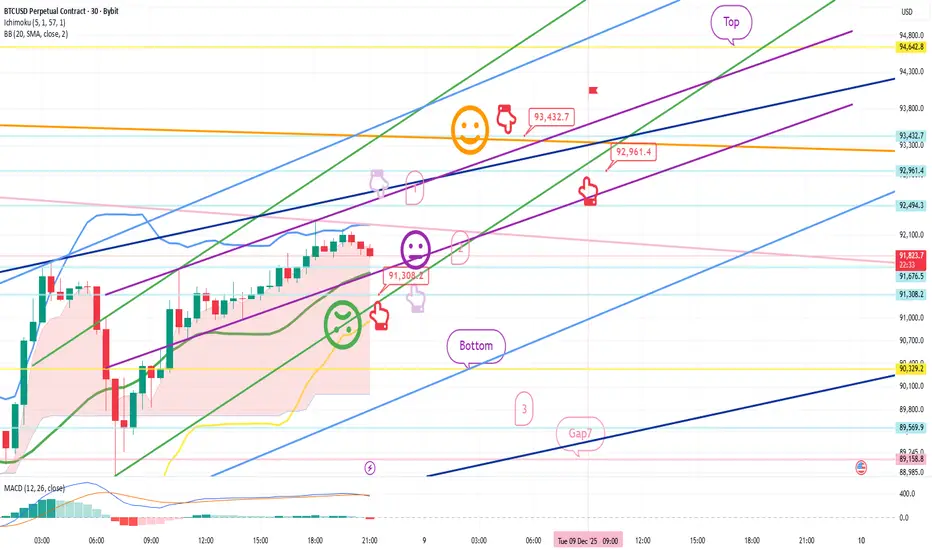
Here's a 30-minute Bitcoin chart.
There are no separate indicators released today.
I've developed a long position strategy based on Nasdaq movements.
*Conditional long position strategy based on the red finger movement path.
- If the price touches the top once or twice and rebounds within the purple support line, it's a vertical rise.
1. If the price falls immediately without touching the top once, the lower level is $91,308.2, the entry point for a long position. / If the green support line is broken, the stop-loss price is $91,308.2.
2. $93,432.7, the first target price for a long position -> the top is the second target price.
If the strategy is successful, $92,961.4 is the point at which to re-enter a long position.
If the price reaches the top before the 9:00 AM candlestick tomorrow, you can enter a short position and then wait for a long position. (Bollinger Band daily chart resistance zone)
The green support line held tight,
but after breaking out, it opened to the bottom, reaching 3 levels.
Please note that my analysis is for reference only.
I hope you will operate safely, with a focus on principled trading and stop-loss orders.
Thank you.
It's a Bitcoin Guide.
If you "follow"
You can receive real-time movement paths and comment notifications on major sections.
If my analysis was helpful,
Please click the booster button at the bottom.
Here's a 30-minute Bitcoin chart.
There are no separate indicators released today.
I've developed a long position strategy based on Nasdaq movements.
*Conditional long position strategy based on the red finger movement path.
- If the price touches the top once or twice and rebounds within the purple support line, it's a vertical rise.
1. If the price falls immediately without touching the top once, the lower level is $91,308.2, the entry point for a long position. / If the green support line is broken, the stop-loss price is $91,308.2.
2. $93,432.7, the first target price for a long position -> the top is the second target price.
If the strategy is successful, $92,961.4 is the point at which to re-enter a long position.
If the price reaches the top before the 9:00 AM candlestick tomorrow, you can enter a short position and then wait for a long position. (Bollinger Band daily chart resistance zone)
The green support line held tight,
but after breaking out, it opened to the bottom, reaching 3 levels.
Please note that my analysis is for reference only.
I hope you will operate safely, with a focus on principled trading and stop-loss orders.
Thank you.
*비트코인가이드 공식텔레그램 Telegram
t.me/BTG_Group
*빙엑스 BingX 50%DC+$5,000 (총1회수수료)
bingx.com/invite/YBM3A4
*바이비트 Bybit 20%DC+$5,020
partner.bybit.com/b/Bitcoin_Guide
*앞으로는 하단의 네이버카페에서만 활동합니다.
cafe.naver.com/loanlife82
t.me/BTG_Group
*빙엑스 BingX 50%DC+$5,000 (총1회수수료)
bingx.com/invite/YBM3A4
*바이비트 Bybit 20%DC+$5,020
partner.bybit.com/b/Bitcoin_Guide
*앞으로는 하단의 네이버카페에서만 활동합니다.
cafe.naver.com/loanlife82
การนำเสนอที่เกี่ยวข้อง
คำจำกัดสิทธิ์ความรับผิดชอบ
ข้อมูลและบทความไม่ได้มีวัตถุประสงค์เพื่อก่อให้เกิดกิจกรรมทางการเงิน, การลงทุน, การซื้อขาย, ข้อเสนอแนะ หรือคำแนะนำประเภทอื่น ๆ ที่ให้หรือรับรองโดย TradingView อ่านเพิ่มเติมใน ข้อกำหนดการใช้งาน