Hello TradingView community, hope you’re doing well! Today I’m sharing an important BankNifty setup as the index approaches a critical make or break zone.
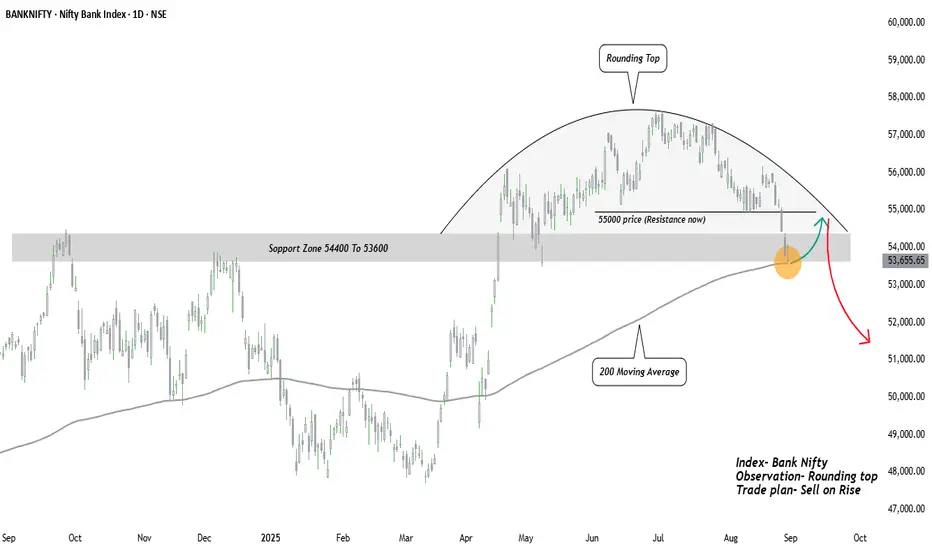
The BankNifty has recently displayed a rounded top structure, a classic sign of distribution and gradual weakness. After weeks of sideways-to-down movement, the index has now broken below the 55000 psychological mark, bringing attention to the major support zone, which also aligns with the 200-day moving average.
Key Observations-:
Rounded Top Distribution-: The slow curve down suggests that sellers are gaining strength while buyers are losing momentum.
Critical Zone at 55000-: Once a strong support, this level has now turned into resistance, confirming supply pressure.
200-Day Moving Average Test-: The index is currently testing its long-term trend indicator. A sustained breakdown below this line can accelerate bearish sentiment.
Volume Dynamics-: Notice how selling volumes are increasing on down days – a further sign of distribution.
Possible Scenarios-:
Bullish Case (Green Path): A short-term rebound from support zone back towards 55000 is possible, but will likely face strong resistance. Only a decisive close above 55500 can negate the bearish structure.
Bearish Case (Red Path): Failure to hold this support may trigger further downside, with potential targets around 52000 and even 51000 in the medium term.
Trading Viewpoint-:
This is a make-or-break zone for BankNifty. While short-term bounces are possible, the overall structure leans bearish unless bulls reclaim 55000+ with strength. Risk management is crucial here traders may consider positioning with caution and keeping stops tight.
This publication purely I am sharing for educational purpose and did not contain any trading advice.
Regards- Amit
คำจำกัดสิทธิ์ความรับผิดชอบ
ข้อมูลและบทความไม่ได้มีวัตถุประสงค์เพื่อก่อให้เกิดกิจกรรมทางการเงิน, การลงทุน, การซื้อขาย, ข้อเสนอแนะ หรือคำแนะนำประเภทอื่น ๆ ที่ให้หรือรับรองโดย TradingView อ่านเพิ่มเติมใน ข้อกำหนดการใช้งาน
คำจำกัดสิทธิ์ความรับผิดชอบ
ข้อมูลและบทความไม่ได้มีวัตถุประสงค์เพื่อก่อให้เกิดกิจกรรมทางการเงิน, การลงทุน, การซื้อขาย, ข้อเสนอแนะ หรือคำแนะนำประเภทอื่น ๆ ที่ให้หรือรับรองโดย TradingView อ่านเพิ่มเติมใน ข้อกำหนดการใช้งาน