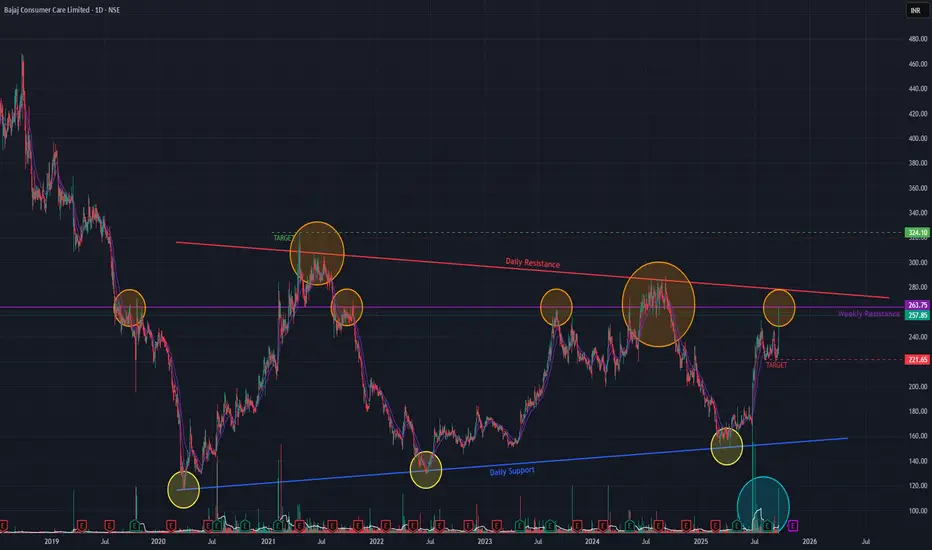
Bajaj Consumer Care is at a critical juncture following a prolonged downtrend from its January 2018 all-time high and a subsequent sideways consolidation period since March 2020. The stock recently demonstrated significant buying interest with an 8.59% surge on a high-volume spike.
Bullish Indicators 👍
Several technical signals support a positive outlook:
- Momentum: Short-term Exponential Moving Averages (EMAs) are in a positive crossover state, indicating strong upward momentum.
- Volume: Trading volume has been consistently above average for several months, suggesting sustained accumulation by buyers.
- Long-Term Trend: The weekly timeframe now shows a Simple Moving Average (SMA) Golden Crossover, reinforcing the potential for a long-term trend reversal.
Key Resistance Levels 🚧
Despite the bullish signals, the stock faces two significant hurdles:
1. A major horizontal resistance line that has been in place since January 2013.
2. A more recent descending resistance trendline formed since April 2021.
Future Outlook and Scenarios
- Bullish Case 📈: A decisive breakout above both the horizontal and angular resistance levels would be a strong confirmation of bullish momentum. This could propel the stock towards a potential price target of ₹324.
- Bearish Case 📉: If the stock fails to sustain its upward momentum and break these key resistance levels, it may retrace back towards the ₹221 support level.
Keep monitoring !!
Disclaimer: This analysis is my personal view & for educational purposes only. They shall not be construed as trade or investment advice. Before making any financial decision, it is imperative that you consult with a qualified financial professional.
คำจำกัดสิทธิ์ความรับผิดชอบ
ข้อมูลและบทความไม่ได้มีวัตถุประสงค์เพื่อก่อให้เกิดกิจกรรมทางการเงิน, การลงทุน, การซื้อขาย, ข้อเสนอแนะ หรือคำแนะนำประเภทอื่น ๆ ที่ให้หรือรับรองโดย TradingView อ่านเพิ่มเติมใน ข้อกำหนดการใช้งาน