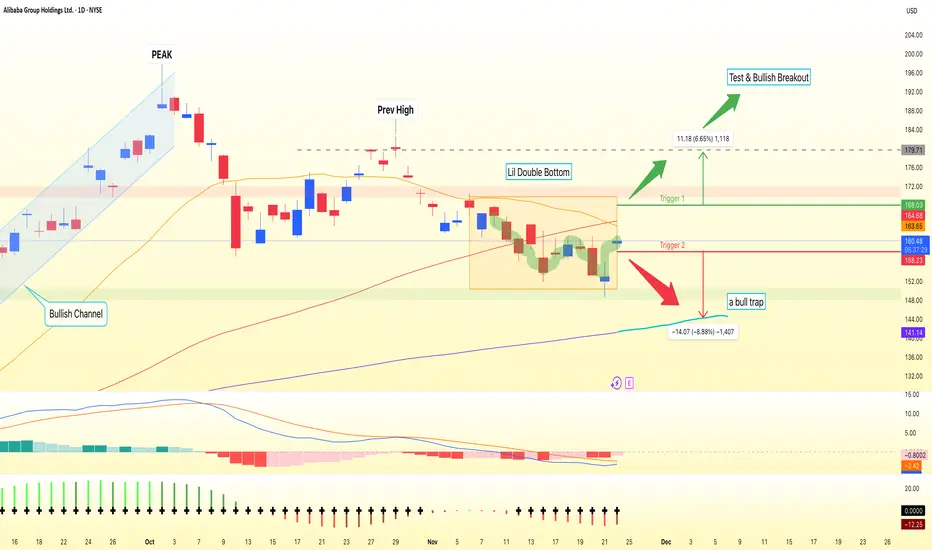
BABA’s daily chart has shifted from a strong August–October rally into a corrective phase, with price now around 160 and printing a clear sequence of lower highs and lows. Price sits below the MA20 and MA60 but still above the rising MA120 near 141. This keeps the broader uptrend technically alive while short-term pressure remains bearish. A potential Double Bottom is developing in the 150–153 demand zone, with a strong bullish reaction from the second trough and a neckline around 168.
For bulls, the key is clearing the moving-average “ceiling” first. A daily close above 165 would show that buyers are absorbing supply at resistance and open the path toward a retest of the 168 neckline. A confirmed daily close above 168 would validate the Double Bottom and put 175–179 initially, and then 184, on the radar as measured-move targets. For this bullish idea, a sustained move back below 158, and especially a break under 150, would be a clear invalidation and shift focus back toward 148–144 near the MA120.
If price instead loses 158 on a daily close without ever reclaiming 165, the bounce looks more like a relief rally inside the downtrend, with sellers likely pressing for a deeper test of 150 and potentially 144. Until either 165 breaks topside or 158 fails, expect noisy consolidation between support at 150 and resistance near 165. This is a study, not financial advice. Manage risk and invalidations.
Thought of the Day 💡: Let the level confirm the idea, not the other way around.
------------------------
Thanks for your support!
If you found this idea helpful or learned something new, drop a like 👍 and leave a comment, I’d love to hear your thoughts!
follow my X 👉 x.com/bbqgio
🔥 level up your Stock, FX, & Crypto: VIP access to AI technical analysis and pro market insights at TradeOS + 80%-off promo code 'EARLY' 👉
ai.tradeos.xyz/?utm_source=tvbg
🔥 level up your Stock, FX, & Crypto: VIP access to AI technical analysis and pro market insights at TradeOS + 80%-off promo code 'EARLY' 👉
ai.tradeos.xyz/?utm_source=tvbg
การนำเสนอที่เกี่ยวข้อง
คำจำกัดสิทธิ์ความรับผิดชอบ
ข้อมูลและบทความไม่ได้มีวัตถุประสงค์เพื่อก่อให้เกิดกิจกรรมทางการเงิน, การลงทุน, การซื้อขาย, ข้อเสนอแนะ หรือคำแนะนำประเภทอื่น ๆ ที่ให้หรือรับรองโดย TradingView อ่านเพิ่มเติมใน ข้อกำหนดการใช้งาน