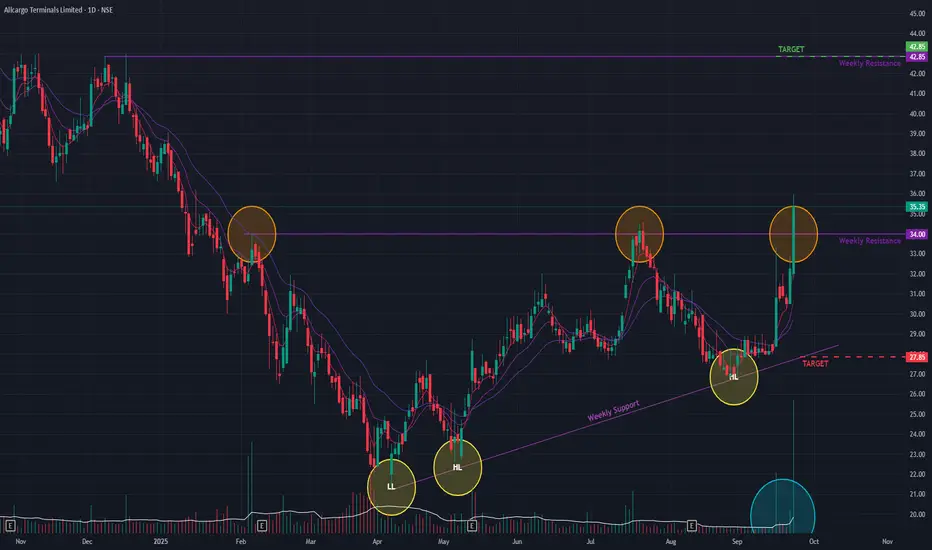
Allcargo Terminals has demonstrated a significant bullish development, suggesting its long-term downtrend may be reversing. Today, the stock decisively broke out of a key horizontal resistance trendline, a move confirmed by an impressive +9.61% price surge on the back of massive trading volume.
This breakout is the latest in a series of positive signs since May 2025, including the consistent formation of Higher Lows, which indicated a potential shift in market structure after the downtrend from January 2024.
Broad-Based Bullish Confirmation 👍
The positive outlook is strongly supported across multiple indicators and timeframes:
- Volume Thrust: The breakout was accompanied by exceptionally high volume, signaling strong conviction from buyers.
- Daily & Weekly Momentum: Both the short-term Exponential Moving Averages (EMAs) and the Relative Strength Index (RSI) are exhibiting bullish crossovers on both the daily and weekly charts, indicating synchronized positive momentum.
Outlook and Key Levels
Following a strong breakout, a common technical development is a retest of the former resistance level as new support. The price action in the coming days will be crucial for confirming the breakout's validity.
- Bullish Case 📈: If the momentum is sustained and the breakout level holds, the stock could proceed towards the next resistance target near ₹42.
- Bearish Case 📉: However, if the stock fails to hold the breakout and momentum wanes, it could pull back towards the support level of ₹27.
Disclaimer: This analysis is my personal view & for educational purposes only. They shall not be construed as trade or investment advice. Before making any financial decision, it is imperative that you consult with a qualified financial professional.
คำจำกัดสิทธิ์ความรับผิดชอบ
ข้อมูลและบทความไม่ได้มีวัตถุประสงค์เพื่อก่อให้เกิดกิจกรรมทางการเงิน, การลงทุน, การซื้อขาย, ข้อเสนอแนะ หรือคำแนะนำประเภทอื่น ๆ ที่ให้หรือรับรองโดย TradingView อ่านเพิ่มเติมใน ข้อกำหนดการใช้งาน