📊 Weekly Support & Resistance Levels
Support Levels:
S1: ₹2,524.63
S2: ₹2,502.97
S3: ₹2,481.13
S4: ₹2,452.73
Central Pivot: ₹2,553.57
Resistance Levels:
R1: ₹2,568.13
R2: ₹2,589.97
R3: ₹2,611.63
R4: ₹2,647.13
Central Pivot: ₹2,553.57
📈 Technical Indicators (Weekly Timeframe)
Relative Strength Index (RSI): Indicates a bullish trend.
Moving Average Convergence Divergence (MACD): Shows a bullish crossover, supporting upward momentum.
Moving Averages: Both 50-day and 200-day moving averages are trending upwards, confirming a positive short-term outlook.
Pivot Points: Trading above the central pivot suggests a bullish bias.
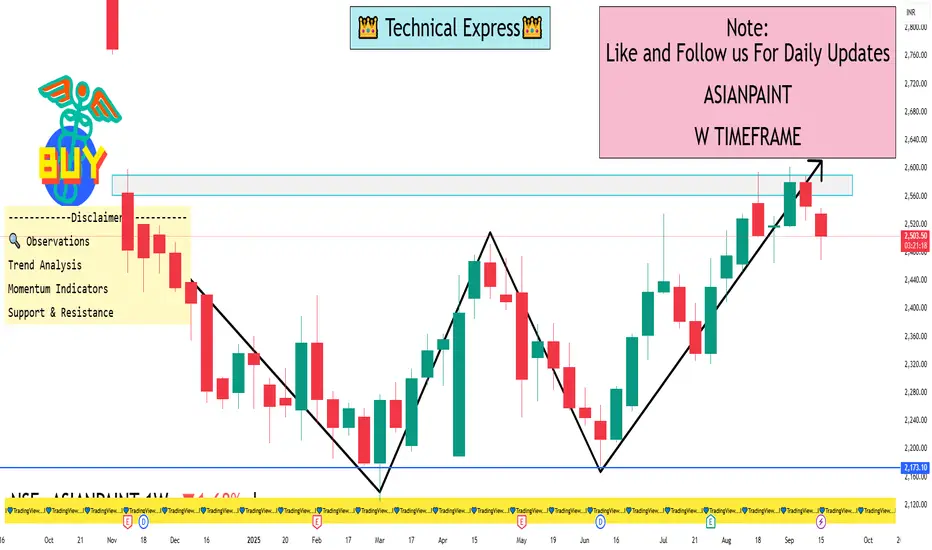
🔍 Observations
Asian Paints has been trading within a parallel channel since May 2021. A significant gap-down breakdown occurred in November 2024, followed by a series of bearish candles. If the current momentum persists, further downward movement is possible. However, the stock is approaching key support levels, which may act as a cushion against further declines.
Support Levels:
S1: ₹2,524.63
S2: ₹2,502.97
S3: ₹2,481.13
S4: ₹2,452.73
Central Pivot: ₹2,553.57
Resistance Levels:
R1: ₹2,568.13
R2: ₹2,589.97
R3: ₹2,611.63
R4: ₹2,647.13
Central Pivot: ₹2,553.57
📈 Technical Indicators (Weekly Timeframe)
Relative Strength Index (RSI): Indicates a bullish trend.
Moving Average Convergence Divergence (MACD): Shows a bullish crossover, supporting upward momentum.
Moving Averages: Both 50-day and 200-day moving averages are trending upwards, confirming a positive short-term outlook.
Pivot Points: Trading above the central pivot suggests a bullish bias.
🔍 Observations
Asian Paints has been trading within a parallel channel since May 2021. A significant gap-down breakdown occurred in November 2024, followed by a series of bearish candles. If the current momentum persists, further downward movement is possible. However, the stock is approaching key support levels, which may act as a cushion against further declines.
I built a Buy & Sell Signal Indicator with 85% accuracy.
📈 Get access via DM or
WhatsApp: wa.link/d997q0
Contact - +91 76782 40962
| Email: techncialexpress@gmail.com
| Script Coder | Trader | Investor | From India
📈 Get access via DM or
WhatsApp: wa.link/d997q0
Contact - +91 76782 40962
| Email: techncialexpress@gmail.com
| Script Coder | Trader | Investor | From India
การนำเสนอที่เกี่ยวข้อง
คำจำกัดสิทธิ์ความรับผิดชอบ
ข้อมูลและบทความไม่ได้มีวัตถุประสงค์เพื่อก่อให้เกิดกิจกรรมทางการเงิน, การลงทุน, การซื้อขาย, ข้อเสนอแนะ หรือคำแนะนำประเภทอื่น ๆ ที่ให้หรือรับรองโดย TradingView อ่านเพิ่มเติมใน ข้อกำหนดการใช้งาน