Intraday Technical Outlook (15m Chart)
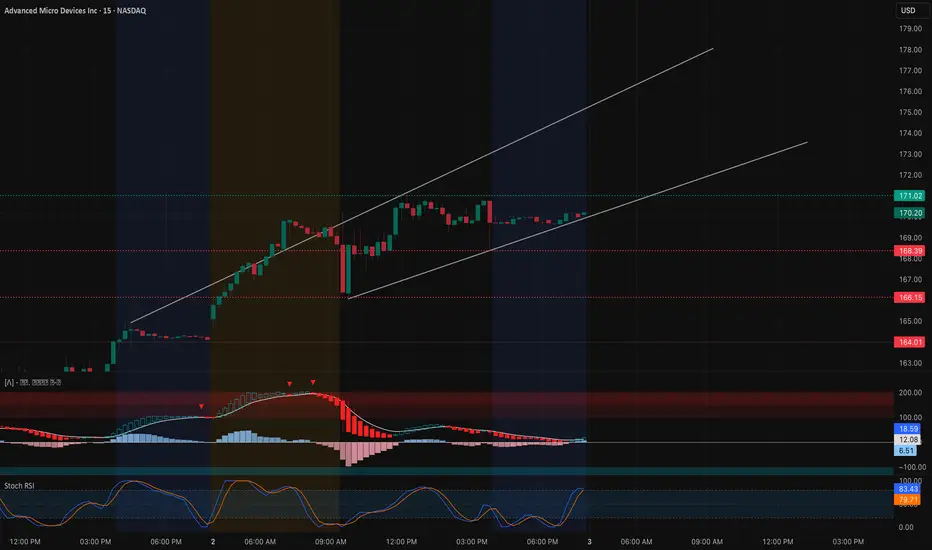
AMD ended the session at $170.20, holding steady inside a rising channel after a strong upside run. The 15-minute chart shows buyers keeping momentum intact:
* MACD: Flattening near positive territory after a pullback, signaling momentum may reload for another push.
* Stoch RSI: Back in overbought territory, showing near-term strength but risk of a cooling period.
* Key Levels: Support rests at $169–168.5, with further downside markers at $166.1 and $164.0. Resistance is at $171–172, the upper channel and prior rejection zone.
Intraday takeaway: If AMD holds above $168.5, bulls have the edge to retest $171–172. A breakdown below $168 exposes a quick fade toward $166–164.
Options Sentiment & GEX Outlook (1H Chart)

Options flow and GEX positioning highlight AMD pressing into a major resistance zone:
* Gamma Walls:
* $171–172.5: Strongest positive GEX cluster and major call wall — current ceiling.
* $167.5–165: Supportive GEX zones that should act as buffers on pullbacks.
* $157.5–155: Heavy put wall, the deeper risk level if weakness accelerates.
* Implications:
* Sustaining above $170–171 opens the door to a potential extension toward $175–177.5, though dealer hedging may pin AMD near the gamma wall if momentum slows.
* A rejection from $171 likely forces a retrace into $167.5–165 where buyers could reload.
* Volatility Context: IVR at 34.7 (below average) shows options are moderately priced, giving traders flexibility for directional calls or debit spreads.
My Thoughts & Recommendation
For Oct 3 trading, AMD is positioned right at the top of its channel and a major gamma wall.
* Intraday (scalping/trading): Stay bullish above $168.5 with eyes on $171–172 resistance. A breakout here can drive toward $175+, while a rejection means quick scalps back into $167.5–165.
* Options trading (swing/0DTE): Calls are favorable on a breakout above $171 with tight stops. If AMD fails at $171, puts toward $165 become a higher-probability play.
Bias heading into Oct 3: Bullish, but watch carefully for rejection at $171–172.
Disclaimer: This analysis is for educational purposes only and does not constitute financial advice. Always do your own research and manage risk before trading.
AMD ended the session at $170.20, holding steady inside a rising channel after a strong upside run. The 15-minute chart shows buyers keeping momentum intact:
* MACD: Flattening near positive territory after a pullback, signaling momentum may reload for another push.
* Stoch RSI: Back in overbought territory, showing near-term strength but risk of a cooling period.
* Key Levels: Support rests at $169–168.5, with further downside markers at $166.1 and $164.0. Resistance is at $171–172, the upper channel and prior rejection zone.
Intraday takeaway: If AMD holds above $168.5, bulls have the edge to retest $171–172. A breakdown below $168 exposes a quick fade toward $166–164.
Options Sentiment & GEX Outlook (1H Chart)
Options flow and GEX positioning highlight AMD pressing into a major resistance zone:
* Gamma Walls:
* $171–172.5: Strongest positive GEX cluster and major call wall — current ceiling.
* $167.5–165: Supportive GEX zones that should act as buffers on pullbacks.
* $157.5–155: Heavy put wall, the deeper risk level if weakness accelerates.
* Implications:
* Sustaining above $170–171 opens the door to a potential extension toward $175–177.5, though dealer hedging may pin AMD near the gamma wall if momentum slows.
* A rejection from $171 likely forces a retrace into $167.5–165 where buyers could reload.
* Volatility Context: IVR at 34.7 (below average) shows options are moderately priced, giving traders flexibility for directional calls or debit spreads.
My Thoughts & Recommendation
For Oct 3 trading, AMD is positioned right at the top of its channel and a major gamma wall.
* Intraday (scalping/trading): Stay bullish above $168.5 with eyes on $171–172 resistance. A breakout here can drive toward $175+, while a rejection means quick scalps back into $167.5–165.
* Options trading (swing/0DTE): Calls are favorable on a breakout above $171 with tight stops. If AMD fails at $171, puts toward $165 become a higher-probability play.
Bias heading into Oct 3: Bullish, but watch carefully for rejection at $171–172.
Disclaimer: This analysis is for educational purposes only and does not constitute financial advice. Always do your own research and manage risk before trading.
คำจำกัดสิทธิ์ความรับผิดชอบ
ข้อมูลและบทความไม่ได้มีวัตถุประสงค์เพื่อก่อให้เกิดกิจกรรมทางการเงิน, การลงทุน, การซื้อขาย, ข้อเสนอแนะ หรือคำแนะนำประเภทอื่น ๆ ที่ให้หรือรับรองโดย TradingView อ่านเพิ่มเติมที่ ข้อกำหนดการใช้งาน
คำจำกัดสิทธิ์ความรับผิดชอบ
ข้อมูลและบทความไม่ได้มีวัตถุประสงค์เพื่อก่อให้เกิดกิจกรรมทางการเงิน, การลงทุน, การซื้อขาย, ข้อเสนอแนะ หรือคำแนะนำประเภทอื่น ๆ ที่ให้หรือรับรองโดย TradingView อ่านเพิ่มเติมที่ ข้อกำหนดการใช้งาน