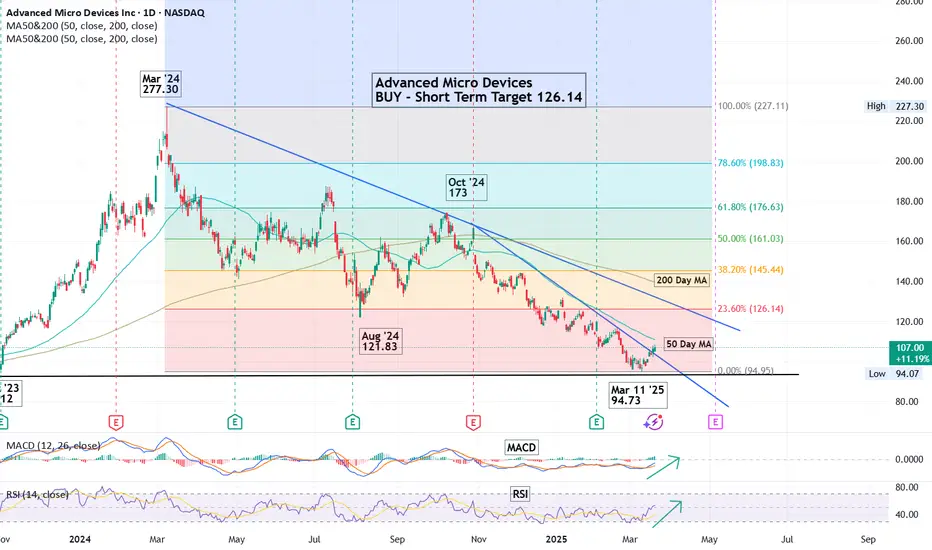
Trendline: Downtrend, connect lower highs and draw a line.
Fibonacci Retracements: High to Low for the period will show where the potential resistance
levels are.
Support Levels: Price held support from previous levels.
For Educational Purposes Only. Not a recommendation to buy or sell.
Fibonacci Retracements: High to Low for the period will show where the potential resistance
levels are.
Support Levels: Price held support from previous levels.
For Educational Purposes Only. Not a recommendation to buy or sell.
คำจำกัดสิทธิ์ความรับผิดชอบ
ข้อมูลและบทความไม่ได้มีวัตถุประสงค์เพื่อก่อให้เกิดกิจกรรมทางการเงิน, การลงทุน, การซื้อขาย, ข้อเสนอแนะ หรือคำแนะนำประเภทอื่น ๆ ที่ให้หรือรับรองโดย TradingView อ่านเพิ่มเติมใน ข้อกำหนดการใช้งาน
คำจำกัดสิทธิ์ความรับผิดชอบ
ข้อมูลและบทความไม่ได้มีวัตถุประสงค์เพื่อก่อให้เกิดกิจกรรมทางการเงิน, การลงทุน, การซื้อขาย, ข้อเสนอแนะ หรือคำแนะนำประเภทอื่น ๆ ที่ให้หรือรับรองโดย TradingView อ่านเพิ่มเติมใน ข้อกำหนดการใช้งาน