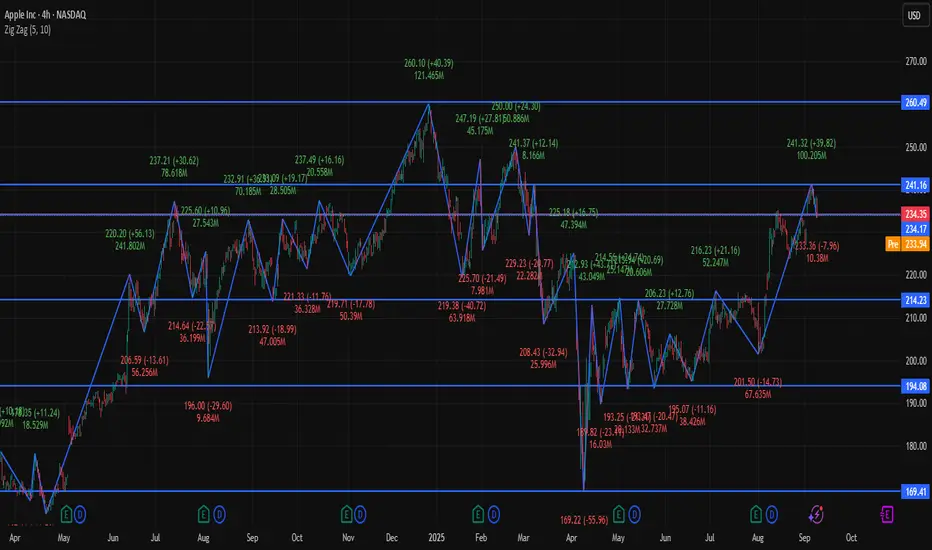
📊 Apple (AAPL) Snapshot
Current Price: ~$234.35
Day Range: $233.01 – $238.66
Open Price: ~$236.73
Market Cap: ~$3.0 Trillion
P/E Ratio: ~30.3
EPS: ~6.59
🔎 Pivot Levels (Daily Basis → useful for 4H)
Pivot Point: ~$234.6
Resistance:
R1: ~$235.9
R2: ~$238.0
R3: ~$239.2
Support:
S1: ~$232.5
S2: ~$231.3
S3: ~$229.1
📉 Technical Indicators (4-Hour Insight)
RSI: ~40 → weak, leaning bearish.
MACD: Negative → bearish momentum.
Moving Averages: Short-term averages show Sell, long-term still supportive (Buy).
📌 4-Hour Frame Outlook
Momentum: Neutral-to-bearish; price is consolidating around the pivot zone ($234–235).
Bullish Scenario: If AAPL breaks above $238, short-term upside could open toward $239+.
Bearish Scenario: If price slips below $232, risk increases for a move toward $230.
✅ Conclusion: On the 4-hour chart, Apple is in a neutral to bearish phase, with weak momentum. Bulls need a breakout above $238 to take control, while bears may dominate if it breaks under $232.
คำจำกัดสิทธิ์ความรับผิดชอบ
ข้อมูลและบทความไม่ได้มีวัตถุประสงค์เพื่อก่อให้เกิดกิจกรรมทางการเงิน, การลงทุน, การซื้อขาย, ข้อเสนอแนะ หรือคำแนะนำประเภทอื่น ๆ ที่ให้หรือรับรองโดย TradingView อ่านเพิ่มเติมใน ข้อกำหนดการใช้งาน
คำจำกัดสิทธิ์ความรับผิดชอบ
ข้อมูลและบทความไม่ได้มีวัตถุประสงค์เพื่อก่อให้เกิดกิจกรรมทางการเงิน, การลงทุน, การซื้อขาย, ข้อเสนอแนะ หรือคำแนะนำประเภทอื่น ๆ ที่ให้หรือรับรองโดย TradingView อ่านเพิ่มเติมใน ข้อกำหนดการใช้งาน