Smart Money Concepts (SMC) — especially demand zones, Fair Value Gaps (FVG), and market structure.
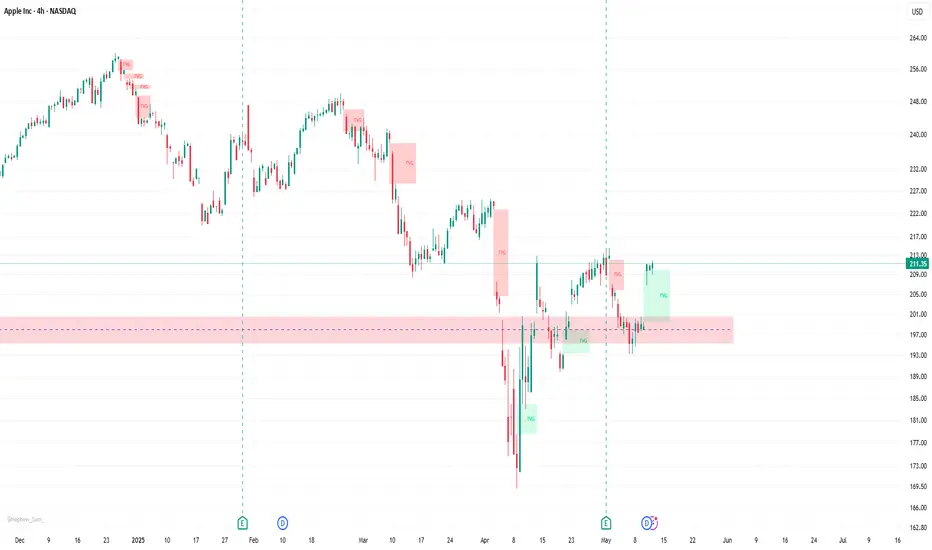
📊 1. Market Structure
The chart shows a shift toward bullish structure after a significant downtrend earlier.
Price formed a higher low inside a strong demand zone (highlighted in pink), suggesting potential trend reversal.
The recent bullish impulse suggests a possible break of structure (BOS) or change of character (CHoCH).
🟩 2. Demand Zone
A major demand zone is highlighted in pink (around $197–$201).
Price reacted strongly from this zone, where multiple buy orders were triggered:
Buy 100 @ 211.36
Buy 100 @ 211.35
Buy 100 @ 211.30
Buy 100 @ 211.32
This zone likely represents institutional interest or an area of accumulation by smart money.
📐 3. Fair Value Gaps (FVG)
Several FVGs (imbalances) are marked on the chart:
Bearish FVGs formed during previous sell-offs (marked in red).
A recent bullish FVG (marked in green) has just formed and partially filled, indicating momentum continuation.
These gaps act as potential support/resistance levels and often attract price action to rebalance inefficiencies.
🎯 4. Targets & Risk Management
Take-Profit (TP) target: $249.07
This level is a previous high and likely premium zone based on SMC theory — where smart money exits.
Stop-Loss (SL): $192.98
Below the demand zone — reasonable invalidation point if price breaks structure and goes lower.
⚖️ 5. Risk-to-Reward Ratio (RRR)
Entry around $211.30 – $211.36
SL around $192.98 → ~18 points risk
TP at $249.07 → ~38 points reward
Risk-to-Reward ≈ 2.1:1 → This is a favorable RRR setup.
🔍 Conclusion
Current Bias: Bullish
Entry Justification: Strong reaction from demand zone + buy orders aligned with FVG
Outlook: Price may aim to fill higher imbalance and reach the premium target zone (~$249), as long as it holds above the demand zone
Invalidation: A break below $192.98 would invalidate the bullish setup
คำจำกัดสิทธิ์ความรับผิดชอบ
ข้อมูลและบทความไม่ได้มีวัตถุประสงค์เพื่อก่อให้เกิดกิจกรรมทางการเงิน, การลงทุน, การซื้อขาย, ข้อเสนอแนะ หรือคำแนะนำประเภทอื่น ๆ ที่ให้หรือรับรองโดย TradingView อ่านเพิ่มเติมใน ข้อกำหนดการใช้งาน
คำจำกัดสิทธิ์ความรับผิดชอบ
ข้อมูลและบทความไม่ได้มีวัตถุประสงค์เพื่อก่อให้เกิดกิจกรรมทางการเงิน, การลงทุน, การซื้อขาย, ข้อเสนอแนะ หรือคำแนะนำประเภทอื่น ๆ ที่ให้หรือรับรองโดย TradingView อ่านเพิ่มเติมใน ข้อกำหนดการใช้งาน