https://www.tradingview.com/chart/kNybgM0i/
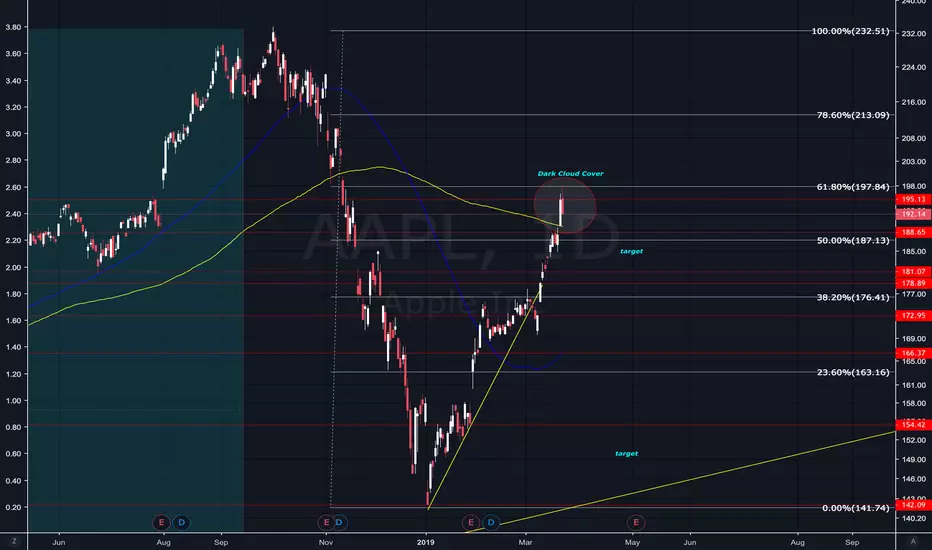
As chart indicates, Possible dark cloud cover on daily. Confirm after closing bell. Strong possibility of follow through starting next week if US10y continues to drop. DGS10-DTB3 (yield curve) indicates a flat curve and economy prone to recession. A H&S can be observed in many equities.
As chart indicates, Possible dark cloud cover on daily. Confirm after closing bell. Strong possibility of follow through starting next week if US10y continues to drop. DGS10-DTB3 (yield curve) indicates a flat curve and economy prone to recession. A H&S can be observed in many equities.
คำจำกัดสิทธิ์ความรับผิดชอบ
ข้อมูลและบทความไม่ได้มีวัตถุประสงค์เพื่อก่อให้เกิดกิจกรรมทางการเงิน, การลงทุน, การซื้อขาย, ข้อเสนอแนะ หรือคำแนะนำประเภทอื่น ๆ ที่ให้หรือรับรองโดย TradingView อ่านเพิ่มเติมที่ ข้อกำหนดการใช้งาน
คำจำกัดสิทธิ์ความรับผิดชอบ
ข้อมูลและบทความไม่ได้มีวัตถุประสงค์เพื่อก่อให้เกิดกิจกรรมทางการเงิน, การลงทุน, การซื้อขาย, ข้อเสนอแนะ หรือคำแนะนำประเภทอื่น ๆ ที่ให้หรือรับรองโดย TradingView อ่านเพิ่มเติมที่ ข้อกำหนดการใช้งาน