Price Action & Market Structure
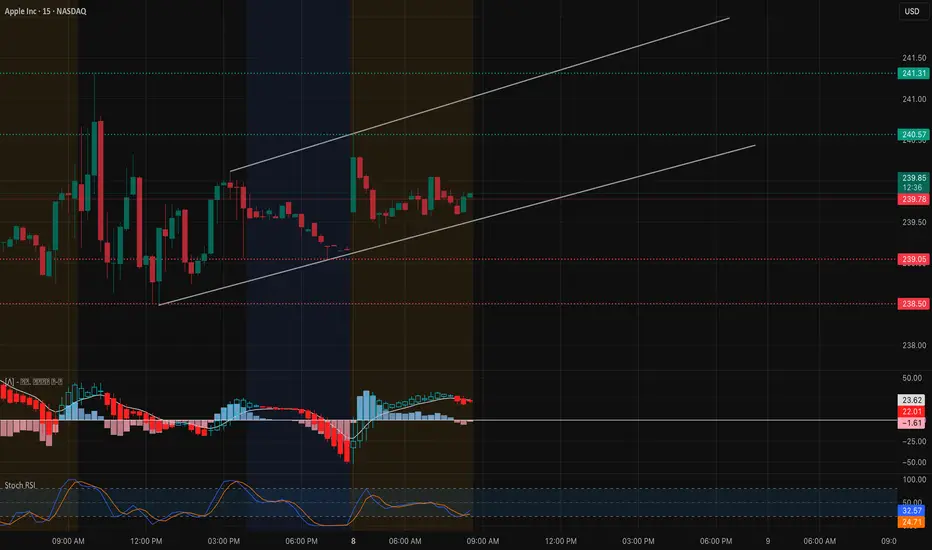
* AAPL is trading around 239.8, consolidating after multiple rejections near 240.5–241.3.
* Price is still within a rising channel, but short-term momentum is softening.
* Structure remains constructive as long as price holds 239–238.5 support.
Key Levels
* Resistance (Upside Caps):
* 240.6–241.3 → Immediate resistance.
* 245.0 → 2nd Call Wall resistance.
* 247.5–250 → Heavy Gamma resistance zone.
* Support (Downside Floors):
* 239.0 → Key intraday support.
* 238.0–238.5 → Secondary support buffer.
* 232.5–227.5 → HVL + Put Support anchor.

Options Sentiment (GEX & IV)
* GEX: Tilted slightly bullish, with Calls outweighing Puts.
* IVR: Low at 11.6, showing options are pricing muted moves.
* Gamma Walls:
* 245–250 = Strong upside cap.
* 232.5–227.5 = Strong downside support zone.
Indicators
* MACD (15m): Slight bearish momentum showing, indicating short-term consolidation.
* Stoch RSI: Resetting near oversold, which could allow another push higher if buyers step in.
Scenarios for Today
Bullish Case (if 239 holds):
* Hold above 239.0, push through 240.6–241.3.
* Targets → 243.0 → 245.0, with possible extension to 247.5–250 Gamma Wall.
Bearish Case (if 239 breaks):
* Lose 239.0, test 238.0–238.5.
* If weakness accelerates, deeper pullback toward 235.0 → 232.5 HVL zone.
Trading Thoughts
* Longs: Favor dip entries near 239.0–238.5 with bounce confirmation, targeting 241–243.
* Shorts: Fade rejection at 241–243, stops above 244.5.
* Stops:
* Longs → below 238.0.
* Shorts → above 244.5.
Summary
AAPL sits at a pivotal 239–240 zone. Holding this support opens upside to 243–245, with Gamma resistance capping higher at 247.5–250. If 239 fails, expect a quick dip into 238–235, with stronger support at 232.5–227.5. Low IVR suggests controlled moves, but GEX positioning favors mild bullish bias unless support breaks.
⚠️ This analysis is for educational purposes only and not financial advice. Always manage risk properly.
* AAPL is trading around 239.8, consolidating after multiple rejections near 240.5–241.3.
* Price is still within a rising channel, but short-term momentum is softening.
* Structure remains constructive as long as price holds 239–238.5 support.
Key Levels
* Resistance (Upside Caps):
* 240.6–241.3 → Immediate resistance.
* 245.0 → 2nd Call Wall resistance.
* 247.5–250 → Heavy Gamma resistance zone.
* Support (Downside Floors):
* 239.0 → Key intraday support.
* 238.0–238.5 → Secondary support buffer.
* 232.5–227.5 → HVL + Put Support anchor.
Options Sentiment (GEX & IV)
* GEX: Tilted slightly bullish, with Calls outweighing Puts.
* IVR: Low at 11.6, showing options are pricing muted moves.
* Gamma Walls:
* 245–250 = Strong upside cap.
* 232.5–227.5 = Strong downside support zone.
Indicators
* MACD (15m): Slight bearish momentum showing, indicating short-term consolidation.
* Stoch RSI: Resetting near oversold, which could allow another push higher if buyers step in.
Scenarios for Today
Bullish Case (if 239 holds):
* Hold above 239.0, push through 240.6–241.3.
* Targets → 243.0 → 245.0, with possible extension to 247.5–250 Gamma Wall.
Bearish Case (if 239 breaks):
* Lose 239.0, test 238.0–238.5.
* If weakness accelerates, deeper pullback toward 235.0 → 232.5 HVL zone.
Trading Thoughts
* Longs: Favor dip entries near 239.0–238.5 with bounce confirmation, targeting 241–243.
* Shorts: Fade rejection at 241–243, stops above 244.5.
* Stops:
* Longs → below 238.0.
* Shorts → above 244.5.
Summary
AAPL sits at a pivotal 239–240 zone. Holding this support opens upside to 243–245, with Gamma resistance capping higher at 247.5–250. If 239 fails, expect a quick dip into 238–235, with stronger support at 232.5–227.5. Low IVR suggests controlled moves, but GEX positioning favors mild bullish bias unless support breaks.
⚠️ This analysis is for educational purposes only and not financial advice. Always manage risk properly.
คำจำกัดสิทธิ์ความรับผิดชอบ
ข้อมูลและบทความไม่ได้มีวัตถุประสงค์เพื่อก่อให้เกิดกิจกรรมทางการเงิน, การลงทุน, การซื้อขาย, ข้อเสนอแนะ หรือคำแนะนำประเภทอื่น ๆ ที่ให้หรือรับรองโดย TradingView อ่านเพิ่มเติมที่ ข้อกำหนดการใช้งาน
คำจำกัดสิทธิ์ความรับผิดชอบ
ข้อมูลและบทความไม่ได้มีวัตถุประสงค์เพื่อก่อให้เกิดกิจกรรมทางการเงิน, การลงทุน, การซื้อขาย, ข้อเสนอแนะ หรือคำแนะนำประเภทอื่น ๆ ที่ให้หรือรับรองโดย TradingView อ่านเพิ่มเติมที่ ข้อกำหนดการใช้งาน