มิก//@version=5
indicator("IQ Option Signals (1m) — Multi-Indicator", overlay=true)
// -------------------- Inputs --------------------
use_hl2 = input.bool(true, "Use HL2 for calculations?")
// EMA
ema_fast_len = input.int(5, "EMA Fast")
ema_slow_len = input.int(20, "EMA Slow")
// RSI
rsi_len = input.int(14, "RSI Length")
rsi_overbought = input.int(70)
rsi_oversold = input.int(30)
// Bollinger Bands
bb_len = input.int(20)
bb_dev = input.float(2.0)
// MACD
macd_fast = input.int(12)
macd_slow = input.int(26)
macd_signal = input.int(9)
// Min signals to confirm
min_signals = input.int(2, "Min confirming signals")
// -------------------- Price --------------------
price = use_hl2 ? hl2 : close
// -------------------- Indicators --------------------
ema_fast = ta.ema(price, ema_fast_len)
ema_slow = ta.ema(price, ema_slow_len)
rsi = ta.rsi(price, rsi_len)
basis = ta.sma(price, bb_len)
dev = bb_dev * ta.stdev(price, bb_len)
bb_upper = basis + dev
bb_lower = basis - dev
= ta.macd(price, macd_fast, macd_slow, macd_signal)
macd_buy = ta.crossover(macdLine, signalLine)
macd_sell = ta.crossunder(macdLine, signalLine)
// -------------------- Build signals --------------------
bull_signals = 0
bear_signals = 0
// EMA trend
if ema_fast > ema_slow
bull_signals += 1
else
bear_signals += 1
// RSI
if rsi < rsi_oversold
bull_signals += 1
if rsi > rsi_overbought
bear_signals += 1
// Bollinger breakout
if close > bb_upper
bull_signals += 1
if close < bb_lower
bear_signals += 1
// MACD
if macd_buy
bull_signals += 1
if macd_sell
bear_signals += 1
// -------------------- Decide signal --------------------
show_buy = bull_signals >= min_signals and bull_signals > bear_signals
show_sell = bear_signals >= min_signals and bear_signals > bull_signals
getRiskText(count) =>
count >= 3 ? "เสี่ยง: ต่ำ (Low Risk)" :
count == 2 ? "เสี่ยง: กลาง (Medium Risk)" :
"เสี่ยง: สูง (High Risk)"
// -------------------- Plot --------------------
plot(ema_fast, color=color.new(color.green, 0), title="EMA Fast")
plot(ema_slow, color=color.new(color.red, 0), title="EMA Slow")
plot(bb_upper, color=color.new(color.orange, 50), title="BB Upper")
plot(bb_lower, color=color.new(color.blue, 50), title="BB Lower")
// Arrows
plotshape(show_buy, title="Buy Arrow", style=shape.triangleup, location=location.belowbar, color=color.green, size=size.normal, text="CALL")
plotshape(show_sell, title="Sell Arrow", style=shape.triangledown, location=location.abovebar, color=color.red, size=size.normal, text="PUT")
// Labels with risk
if show_buy
label.new(bar_index, low - tr*0.5, text=getRiskText(bull_signals) + " Call 1m", style=label.style_label_up, color=color.new(color.green, 0), textcolor=color.white)
if show_sell
label.new(bar_index, high + tr*0.5, text=getRiskText(bear_signals) + " Put 1m", style=label.style_label_down, color=color.new(color.red, 0), textcolor=color.white)
// -------------------- Optional: Signal Table --------------------
var table t = table.new(position.top_right, 1, 3)
if barstate.islast
table.cell(t, 0, 0, "Bull signals: " + str.tostring(bull_signals), text_color=color.green)
table.cell(t, 0, 1, "Bear signals: " + str.tostring(bear_signals), text_color=color.red)
table.cell(t, 0, 2, "Risk: " + (show_buy ? getRiskText(bull_signals) : show_sell ? getRiskText(bear_signals) : "N/A"))
ไอเดียการซื้อขาย
Vvvimport time
from datetime import datetime
import pandas as pd
import numpy as np
import ta
from iqoptionapi.stable_api import IQ_Option
from telegram import Bot
# ====== CONFIG ======
IQ_EMAIL = "you@example.com"
IQ_PASSWORD = "yourpassword"
BOT_TOKEN = "123456:ABC-DEF..." # Telegram bot token
CHAT_ID = "987654321" # your chat id
SYMBOL = "EURUSD" # ตัวอย่าง
TIMEFRAME = 60 # 60s candles => 1 minute
CANDLES = 100
MIN_CONFIRMS = 3
# Connect Telegram
bot = Bot(token=BOT_TOKEN)
# ===== indicator functions =====
def hl2(high, low):
return (high + low) / 2.0
def get_signals_from_df(df):
# df must have columns: 'from', 'open', 'close', 'min','max','volume'
price = (df + df )/2.0 # hl2
close = df
high = df
low = df
# EMA
emaF = ta.trend.ema_indicator(close, window=5)
emaS = ta.trend.ema_indicator(close, window=20)
# MACD
macd = ta.trend.MACD(close, window_slow=26, window_fast=12, window_sign=9)
macd_line = macd.macd()
macd_sig = macd.macd_signal()
# RSI
rsi = ta.momentum.rsi(close, window=14)
# Bollinger
bb = ta.volatility.BollingerBands(close, window=20, window_dev=2)
bb_high = bb.bollinger_hband()
bb_low = bb.bollinger_lband()
# S/R simple
sr_len = 20
sr_high = close.rolling(sr_len).max().iloc
sr_low = close.rolling(sr_len).min().iloc
# last bar
i = -1
bull = 0
bear = 0
# EMA trend
if emaF.iloc > emaS.iloc :
bull += 1
else:
bear += 1
# MACD cross
if macd_line.iloc > macd_sig.iloc and macd_line.iloc <= macd_sig.iloc :
bull += 1
if macd_line.iloc < macd_sig.iloc and macd_line.iloc >= macd_sig.iloc :
bear += 1
# RSI
if rsi.iloc > 50:
bull += 1
elif rsi.iloc < 50:
bear += 1
# Bollinger breakout
if close.iloc > bb_high.iloc :
bull += 1
if close.iloc < bb_low.iloc :
bear += 1
# re-test (previous close near EMA or SR then bounce)
prev_close = close.iloc
tol = 0.0015
try:
if (prev_close <= emaF.iloc and close.iloc > emaF.iloc ) or (abs(prev_close - sr_low) <= sr_low*tol and close.iloc > sr_low):
bull += 1
except:
pass
try:
if (prev_close >= emaF.iloc and close.iloc < emaF.iloc ) or (abs(prev_close - sr_high) <= sr_high*tol and close.iloc < sr_high):
bear += 1
except:
pass
# candle strength
body = close.iloc - df .iloc
if body > (df .iloc - df .iloc ) * 0.25:
bull += 1
if body < -(df .iloc - df .iloc ) * 0.25:
bear += 1
# decide
show_buy = (bull >= MIN_CONFIRMS) and (bull > bear)
show_sell = (bear >= MIN_CONFIRMS) and (bear > bull)
# risk text
def risk_text(c):
if c >= 5:
return "เสี่ยง: ต่ำ (Low)"
if c >= 3:
return "เสี่ยง: กลาง (Med)"
return "เสี่ยง: สูง (High)"
return {
"buy": show_buy,
"sell": show_sell,
"bull_count": bull,
"bear_count": bear,
"risk": risk_text(bull if show_buy else bear)
}
# ===== main loop =====
def main():
Iq = IQ_Option(IQ_EMAIL, IQ_PASSWORD)
Iq.connect()
if not Iq.check_connect():
print("Login failed")
return
print("Connected")
while True:
try:
candles = Iq.get_candles(SYMBOL, TIMEFRAME, CANDLES, time.time())
df = pd.DataFrame(candles)
# columns: 'from','at','open','close','min','max','volume' depending on API version
# ensure columns present:
if 'close' not in df.columns:
time.sleep(5)
continue
df = pd.to_datetime(df , unit='s')
df.set_index('from', inplace=True)
res = get_signals_from_df(df)
t = datetime.now().strftime("%Y-%m-%d %H:%M:%S")
if res :
text = f"🔺 CALL 1m | {SYMBOL} | {t} {res } | confirmations: {res }"
bot.send_message(chat_id=CHAT_ID, text=text)
print(text)
elif res :
text = f"🔻 PUT 1m | {SYMBOL} | {t} {res } | confirmations: {res }"
bot.send_message(chat_id=CHAT_ID, text=text)
print(text)
else:
print(f"{t} - No strong signal ({res }/{res })")
# wait until next candle close (align approx)
sleep_sec = 60 - datetime.utcnow().second
time.sleep(sleep_sec + 0.5)
except Exception as ex:
print("Error:", ex)
time.sleep(5)
if __name__ == "__main__":
main()

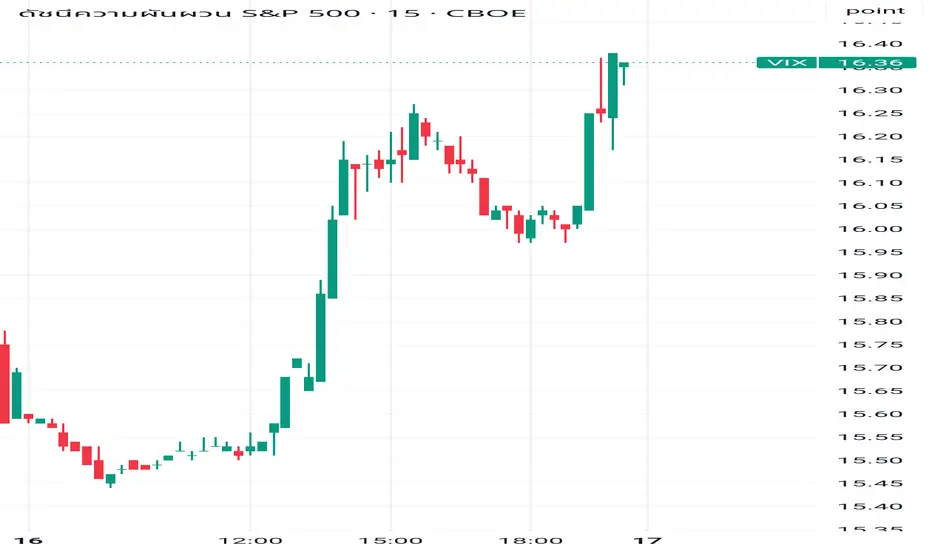
VIX VIX เป็น index ที่จะปรับตัวขึ้นหาก S&P มีความผันผ่วนสูง เช่นการพักฐานหรือปรับตัวลง ผมมองว่าตอนนี้เมกาใกล้ได้เวลาพักฐานลึกๆ ทำให้มีมุมมองว่าเราควรไปสะสม VIX ในหน้า Long โดยวาง SL ที่ราคา 11.9 ที่เป็นแนว New Low ซึ่งเป็นเหตุการที่เกิดขึ้นได้ยาก โดยแผนการ Trade จะเริ่มจากเข้าไป สะสม L vix ในกรอบราคา 13-12 และวางเป้าหมายปิดกำไรที่ แนว 15 16 17
th.tradingview.com

Por : Technical Analysisดัชนี VIX Index ปรับตัวขึ้นแตะ 25.2 ชี้ว่าตลาดมองว่าดัชนี S&P 500 คืนนี้จะปรับตัวลงต่อ
