BOSS| Trade Like A Bitcoin and Ethereum WhaleTHE BEST BITCOIN AND ETHEREUM INDICATOR FOR TRADINGVIEW.COM
Quantum Technology – You won’t find any other indicator out there that predicts the probability of the next candle being bullish or bearish .
No Lag, No delay, No repaint!
Quality of Signals – The new Boss Quantum allows you to be in control of the outcome probability. Higher accuracy!
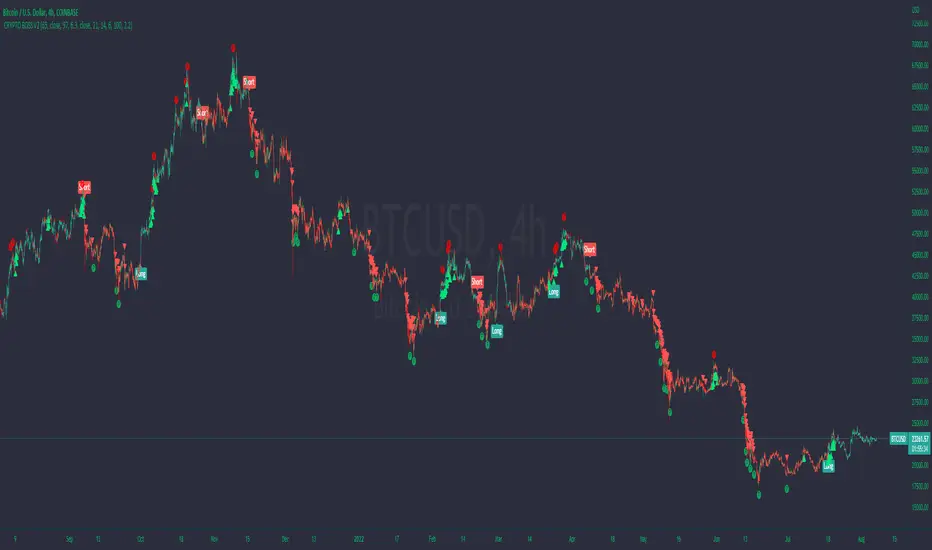
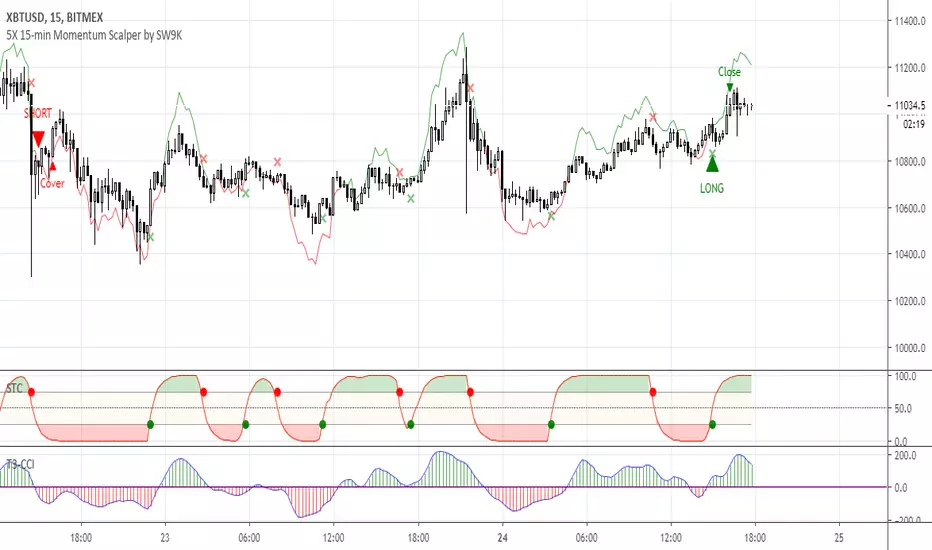
Buy/Long on Long Signal
Sell/Short on Short Signal
SET ALERTS TO ONCE PER BAR CLOSE
//////////////////////////////////////////////////////////////////////
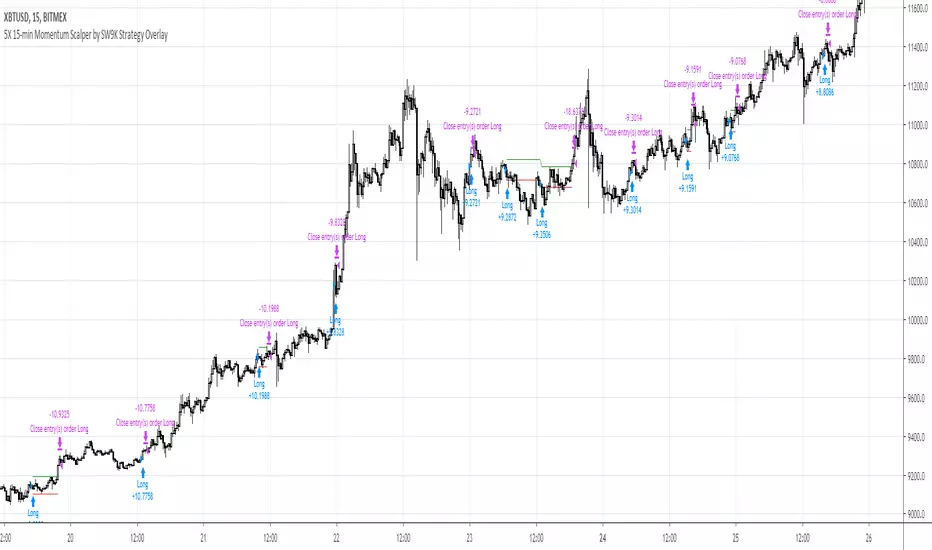
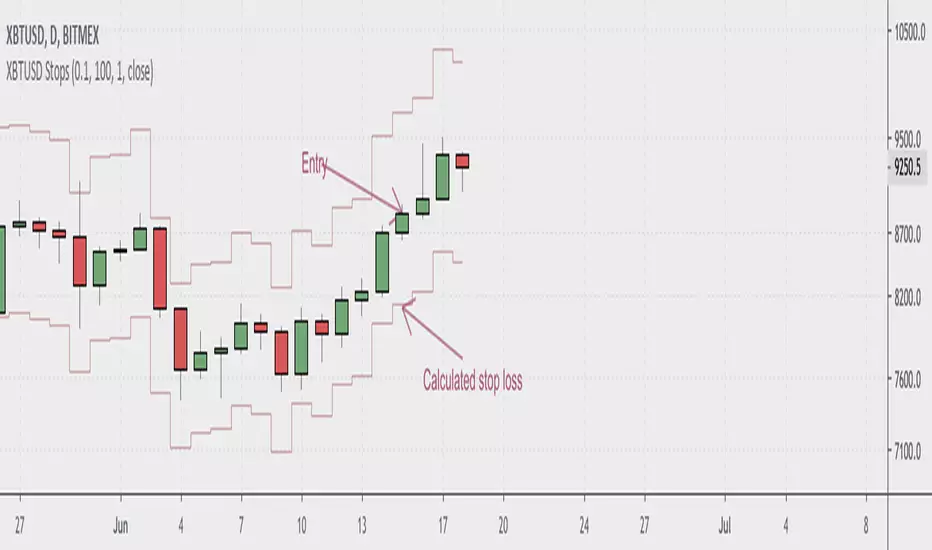
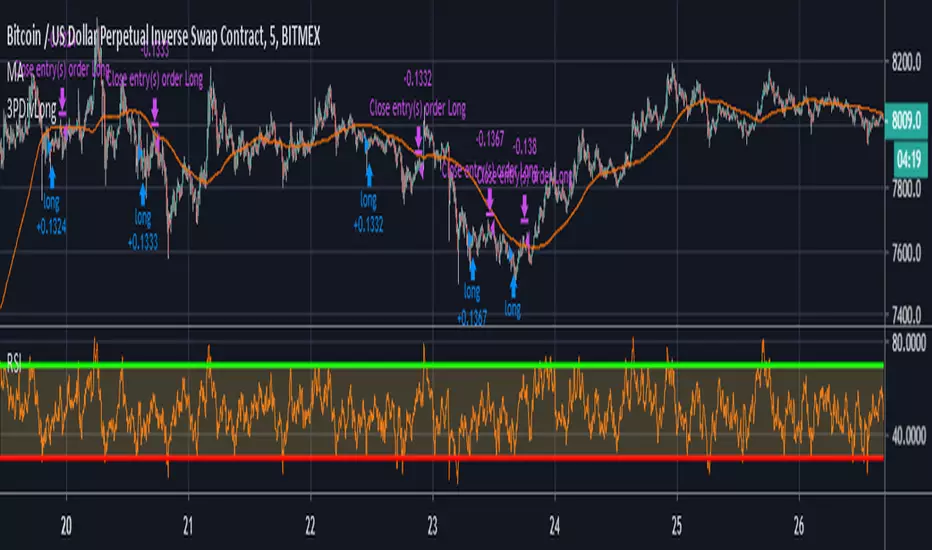
Breakouts, Profit Points, and ReEntry's
This indicator will alert you of when to take profits, when to reenter a trade, and when a breakout occurs.
TAKING PROFITS
When in a long position take long profits on teal circle which, will be above candle.
When in a short position take short profits on purple circle which, will be below candle.
I typically exit 25-50% of position and reenter 25-50% on next candle.
If a Long or Short signal on BOSS quantum is still present the long or short trade is still active.
ReENTRY's
Long ReEntry's
If in a long position and a purple circle appears below candle this indicates a great place to either reenter trade or add more to position.
If a green triangle appears below candle you can either reenter or add more to long position as this signifies a long breakout/ strong upward movement.
Short ReEntry's
If in a short position and a teal circle appears above candle this indicates a great place to either reenter trade or add more to position.
If a red triangle appears below candle you can either reenter short or add more to short position as this signifies a short breakout/ strong downward movement.
Breakout's
Green Triangle
If a green triangle appears below candle you can either reenter or add more to long position as this signifies a long breakout/ strong upward movement.
Red Triangle
If a red triangle appears above candle you can either reenter short or add more to short position as this signifies a short breakout/ strong downward movement.
SET ALERTS TO ONCE PER BAR
Available At: Bosscripts.com
อินดิเคเตอร์ Pine Script®