Donchian WicksNote: This script does not perform well on its own and is meant to inspire other coders, just sharing it because why not :)
The idea is simple, highest only gets calculated for green candles, lowest only gets calculated for red candles. a yellow dot gets created when a candle gets below lowest line and closes bullish, vise versa for red dots.
Hope someone can use it.
Wicks

Shadow MAShadow/Wick Moving Average
- Moving Average comparing top and bottom Shadow / Wick length
- Shadows represent price levels that have been hit, but did not close
- Not an all-purpose, all-in-one indicator for entry and exit
- Used as a visual aid to better understand price movement. For example. if price is bearish, but the Shadow MA is showing high, positive values, it is a sign that price is not tending to close at its highest point; therefore, there is bearish resistance.
- Can be used in combination with momentum oscillators and trend analysis.

BTC%I made this for personal use, for a indicator, but bcs I dont see a script like this I wanted to just post it for other ppl.
This is just a script that tells the candles based on %, including wicks. (wicks are inverted to save space and bcs I prefer it)
This works for all markets.

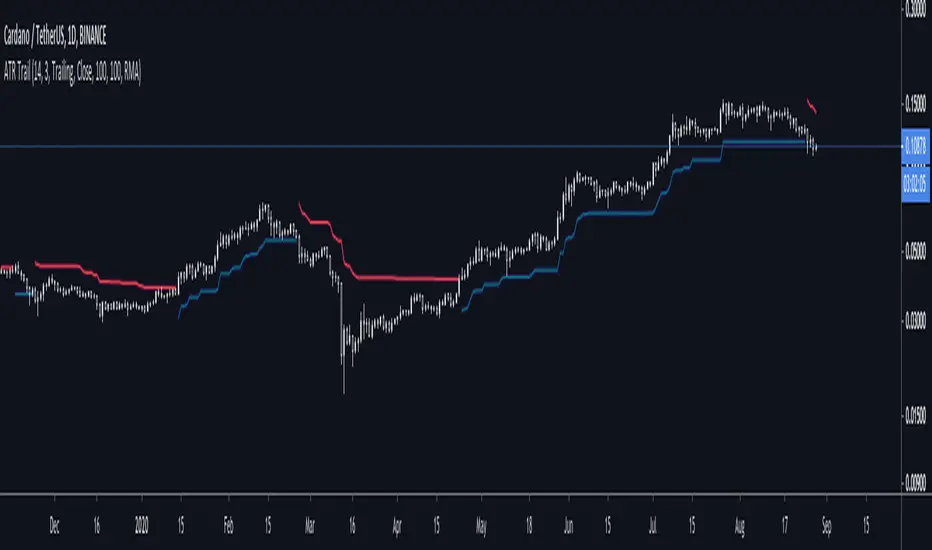
ATR + Trailing StopsSimple visualisation of Average True Range in Pinescript V4.
The script has two modes: Running and Trailing.
In Running mode, it continuously displays the ATR above and below the price. Specifically, it displays the High and Low price plus and minus the ATR times a user-supplied multiplier. This can be helpful for visualising volatility.
In Trailing mode, it displays the same ATR line, except the line trails until price crosses it. When price crosses it, it flips from long to short or vice-versa.
You could use trailing ATR as a stop loss. Adjust the multiplier and lookback period for your asset and preference.
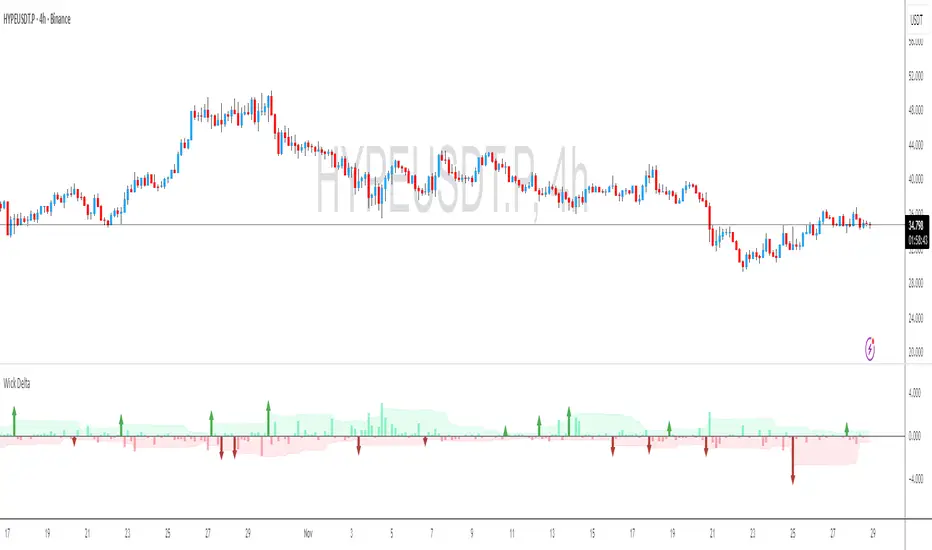
Wick Delta Buy/Sell PressureIf you think of a perfect doji candle, where the wicks on top and bottom are exactly the same, that's a candle with a delta of 0. What this indicator does is show the delta/difference between wicks, if the top wick is longer than the bottom wick it show's sell pressure/bear interest, which is displayed as a red bar and vice versa for buy/bull pressure, which is shown as green bars. I added arrows for clarity.
It's a different way of visualising wicks, which can clarify sentiment and be a useful way to understand wicks better in general. One way to use it is to look for clusters of 3/4 larger bars in a row, which generally helps to determine future direction especially when seen at important levels.
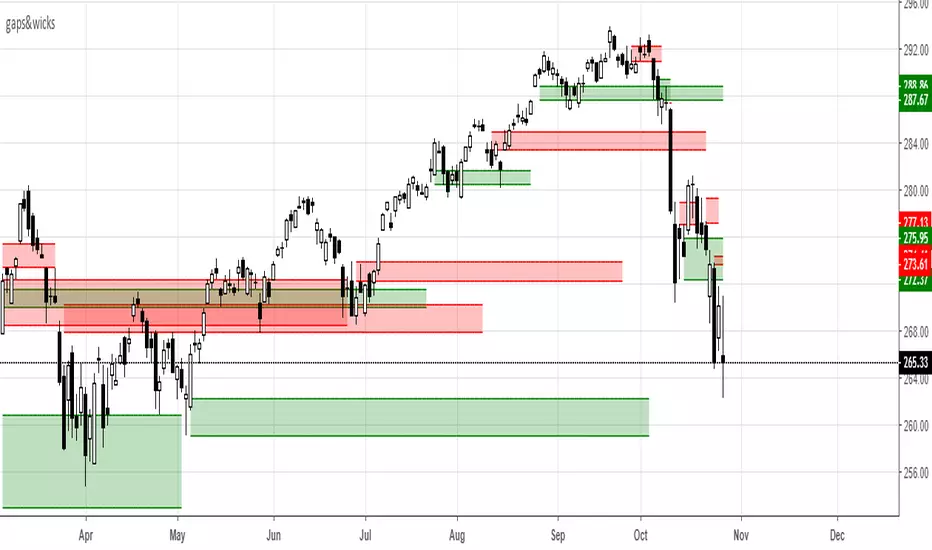
gaps&wicksA means for tracking price ranges for gap up/down and longer buying/selling tails. This may have some value for buying/selling opportunities based on the relative significance of the range. The look back period is adjustable and works for any time frame. If you have any success using it leave some feedback.
-Squam
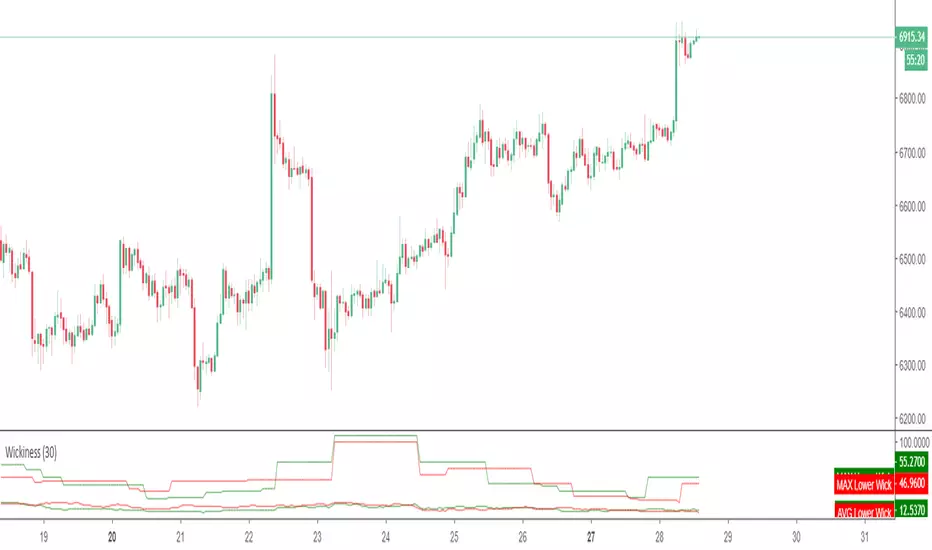
WickinessThis script measures the maximum and average length of upper and lower wicks. While this can be used as a volatility gauge and to see if there is more support or resistance, it's primary use is to not get wicked out on stops, by adding one of these numbers to the the Moving Average or S/R level that one is using for a Stop, plus maybe a few points of buffer.
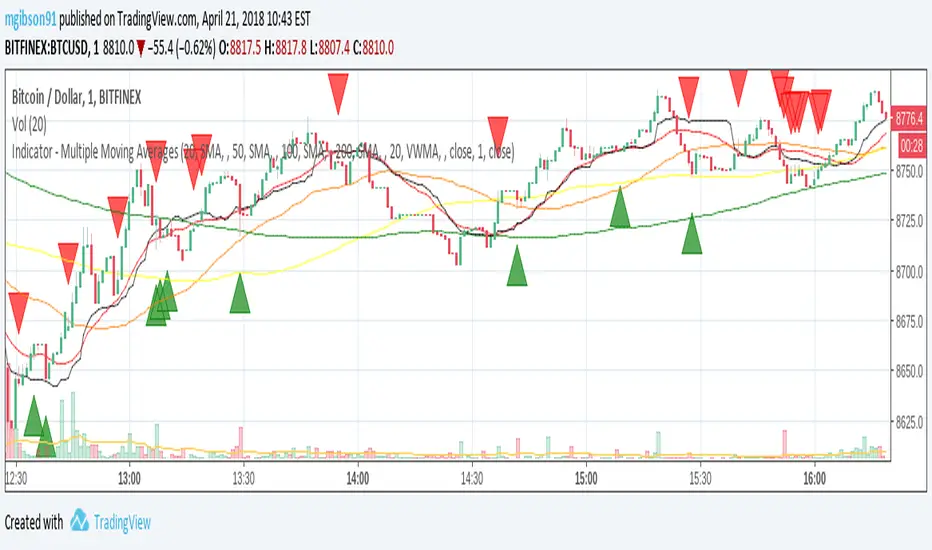
MG - Multiple Moving Averages & Candle Wick Alerts - 1.0Features:
- Each moving average has customizable length, type and source
- The ability to change the source of all moving averages with one input (changing an individual MA source will override the general for that MA)
- At a glance comparison of 20 SMA and 20 VWMA to gauge volume trend
- Wick alerts which can be toggled for each moving average.
- Bullish wick alerts are when the wick is the only part of the candle to drop below the moving average
- Bearish wick alerts are when the wick is the only part of the candle to reach above the moving average
- Simple candle closed alert if you want a notification, for example each hour.
Defaults: Four SMAs (20, 50, 100, 200) and a 20 VWMA .
Recommended Usage:
- Set the general source (sets the source of all moving averages) to 'low' when in an uptrend and 'high' in a downtrend to maximize Risk : Reward.
- Use Fibonacci levels, oscillators .etc for confluence
NOTE: The moving average component of this indicator is the same as the previous indicator ()
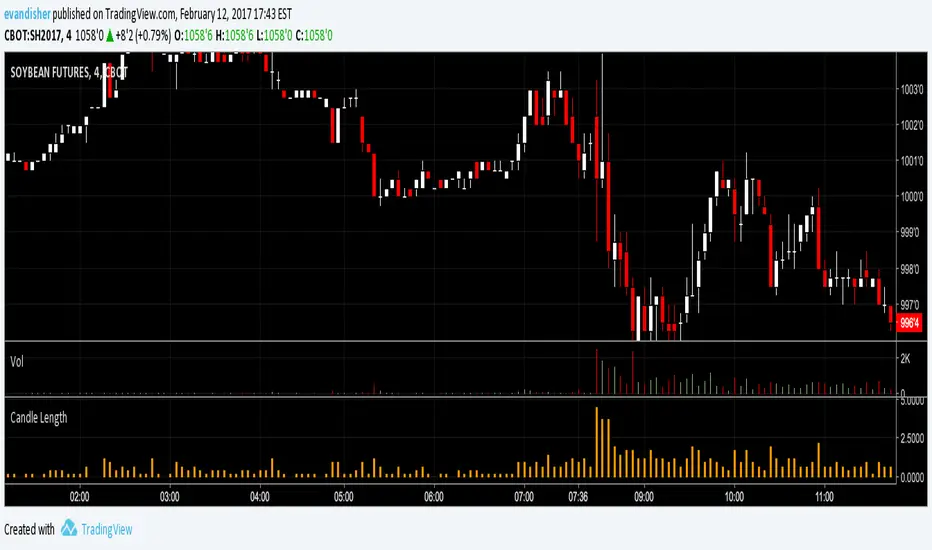
Candle Length by WiscoDishMeasure of the total candle length, including the upper and lower wicks. Works best as a histogram in my opinion. Used as a quick reference for the high minus the low of each candle.