Universal Valuation System Overview 🔍
The Universal Valuation System (UVS) is an advanced valuation-focused indicator that provides insights into whether an asset is statistically overvalued or undervalued, helping traders understand where an asset sits within its historical value range. Unlike trend indicators, UVS emphasizes value analysis through a unique combination of performance ratios and statistical metrics, synthesizing this data into an overall Z-score. This score reflects the asset’s position within a typical normal distribution curve, allowing traders to make data-driven decisions based on historical valuation patterns.
Normal Distribution: A Statistical Foundation for Valuation 📊
The UVS leverages the normal distribution model as its core statistical framework. In a normal distribution, values tend to cluster around a central mean, with predictable probabilities for deviation. In financial markets, this means that most price or valuation levels hover around an average range, while extreme highs or lows are less frequent.
Under normal distribution:
68% of values lie within one standard deviation of the mean.
95% of values lie within two standard deviations.
99.7% of values lie within three standard deviations.
Using Z-scores, UVS calculates where current valuation metrics fall relative to this distribution, identifying overvalued (above-average) or undervalued (below-average) zones. This helps traders interpret an asset’s relative value, showing whether it is more likely to revert toward its mean or is experiencing an exceptional deviation.
Key Components and Ratios in UVS 🔀
UVS includes a range of valuation metrics that work together to determine the Z-score:
Sharpe Ratio: Measures return relative to risk, offering insight into the quality of returns.
Sortino Ratio: Focuses on downside deviation, helping gauge negative returns’ impact.
Omega Ratio: Assesses the likelihood of gains versus losses, providing a risk-adjusted performance measure.
Crosby Ratio: Examines volatility patterns, adding dimension to the valuation signal.
VWAP (Volume-Weighted Average Price) Z-Score: Assesses price relative to volume, highlighting valuation when volume supports price movements.
Price ROC Z-Score: Uses the rate of price change to give a volatility-adjusted price movement signal.
By averaging these ratios, UVS forms a composite Z-score representing an overall valuation signal. This Z-score directly reflects the asset’s position within its historical distribution, indicating whether it’s in a typical, overbought, or oversold range.
DCA (Dollar-Cost Averaging) Application with UVS 💵
The UVS provides powerful insights for those using Dollar-Cost Averaging (DCA) by signaling periods when an asset may be overvalued or undervalued relative to its historical distribution. This model-based approach helps traders strategically adjust their DCA timing:
Overvalued (Overbought) Zones:
When the Z-score indicates that an asset is in an overbought zone (typically above +2 standard deviations), DCA buyers may choose to reduce purchases or pause, as this zone suggests the asset is currently at a premium relative to its historical norms.
Undervalued (Oversold) Zones:
In undervalued regions (typically below -2 standard deviations), the UVS suggests a favorable accumulation point for DCA. These periods allow traders to buy at below-average valuations, optimizing their cost basis over time.
Valuation Zone Display and Accessibility 🌈
UVS includes several user-friendly display options, helping traders interpret its signals easily:
Composite Zone Highlighting: Displays overbought and oversold zones with color gradients, clearly visualizing statistical extremes.
Ratio Breakdown: Allows users to view individual Z-scores for each component, understanding the specific contributions to the overall valuation signal.
Color Blindness Mode: Offers multiple color settings to ensure clear interpretation across different visual needs.
Summary: Structured Value Analysis for Informed DCA Decisions
UVS is designed to be a reliable tool for traders looking to anchor their DCA and valuation-based strategies in statistical reality. By identifying valuation zones within a normal distribution framework, UVS enables a disciplined approach to asset accumulation based on relative value rather than price trends.
Important Note: UVS does not predict future performance. It provides a statistical view of historical valuation, which should be supplemented with additional analysis and risk management practices. Past patterns do not guarantee future results.
Valuation
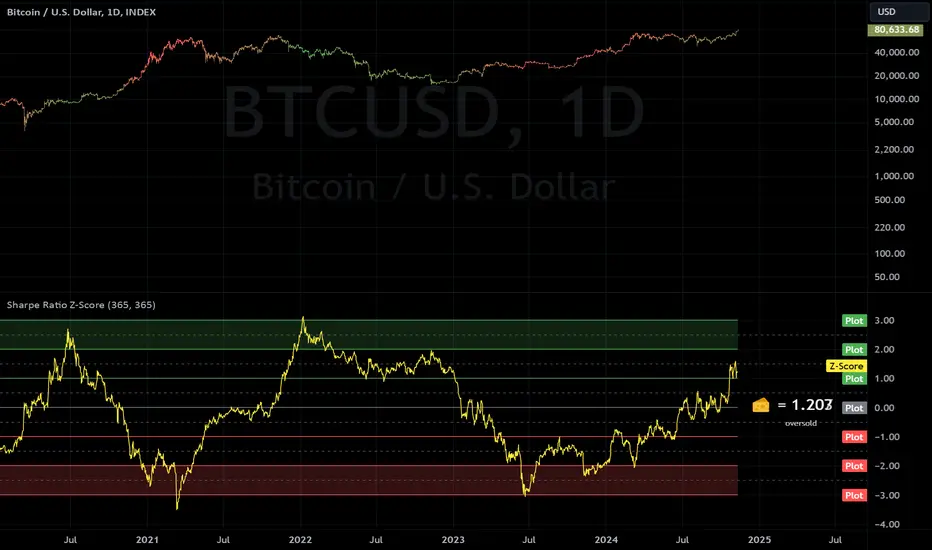
Sharpe Ratio Z-ScoreThis indicator calculates the Sharpe Ratio and its Z-Score , which are used to evaluate the risk-adjusted return of an asset over a given period. The Sharpe Ratio is computed using the average return and the standard deviation of returns, while the Z-Score standardizes this ratio to assess how far the current Sharpe Ratio deviates from its historical average.
The Sharpe Ratio is a measure of how much return an investment has generated relative to the risk it has taken. In the context of this script, the risk-free rate is assumed to be 0, but in real applications, it would typically be the return on a safe investment, like a Treasury bond. A higher Sharpe Ratio indicates that the investment's returns are higher compared to its risk, making it a more favorable investment. Conversely, a lower Sharpe Ratio suggests that the investment may not be worth the risk.
Calculation:
Daily Returns Calculation: The script calculates the daily return of the asset. This measures the percentage change in the asset’s closing price from one period to the next.
Sharpe Ratio Calculation: The Sharpe Ratio is calculated by taking the average daily return and dividing it by the standard deviation of the returns, then multiplying by the square root of the period length.
Usage:
Traders and Investors can use the Sharpe Ratio to evaluate how well the asset is compensating for risk. A high Sharpe Ratio indicates a high return per unit of risk, whereas a low or negative Sharpe Ratio suggests poor risk-adjusted returns. In overbought times, an asset would have high/positive returns per unit of risk. In oversold times, an asset would have low/negative returns per unit of risk.
The Z-Score provides a way to compare the current Sharpe Ratio to its historical distribution, offering a more standardized view of how extreme or typical the current ratio is.
Positive Z-score: Indicates that the asset's return is significantly lower than its risk, suggesting potential oversold conditions.
Negative Z-score: Indicates that the asset's return is significantly higher than its risk, suggesting potential overbought conditions.
Red Zone (-3 to -2): Strong overbought conditions.
Green Zone (2 to 3): Strong oversold conditions.
Sharpe Ratio Limitations:
While the Sharpe Ratio is widely used to evaluate risk-adjusted returns, it has its limitations.
Fat Tails: It assumes that returns are normally distributed and does not account for extreme events or "fat tails" in the return distribution. This can be problematic for assets like cryptocurrencies, which may experience large, sudden price swings that skew the return distribution.
Single Risk Factor: The Sharpe Ratio only considers standard deviation (total volatility) as a measure of risk, ignoring other types of risks like skewness or kurtosis, which may also impact an asset’s performance.
Time Frame Sensitivity: The accuracy of the Sharpe Ratio and its Z-Score is heavily influenced by the time frame chosen for the calculation. A longer period may smooth out short-term fluctuations, while a shorter period might be more sensitive to recent volatility.
Overbought and Oversold Zones: The script marks overbought and oversold conditions based on the Z-Score, but this is not a guarantee of market reversal. It’s important to combine this tool with other technical indicators and fundamental analysis for a more comprehensive market evaluation.
Volatility: The Sharpe Ratio and Z-Score depend on the volatility (standard deviation) of the asset’s returns. For highly volatile assets, such as cryptocurrencies, the Sharpe Ratio may not fully capture the true risk or may be misleading if the volatility is transient.
Doesn't Account for Downside Risk: The Sharpe Ratio treats upside and downside volatility equally, which may not reflect how investors perceive risk. Some investors may be more concerned with downside risk, which the Sharpe Ratio does not distinguish from upside fluctuations.
Important Considerations:
The Sharpe Ratio should not be used in isolation. While it provides valuable insights into risk-adjusted returns, it is important to combine it with other performance and risk indicators to form a more comprehensive market evaluation. Relying solely on the Sharpe Ratio may lead to misleading conclusions, particularly in volatile or non-normally distributed markets.
When integrated into a broader investment strategy, the Sharpe Ratio can help traders and investors better assess the risk-return profile of an asset, identifying periods of potential overperformance or underperformance. However, it should be used alongside other tools to ensure more informed decision-making, especially in highly fluctuating markets.
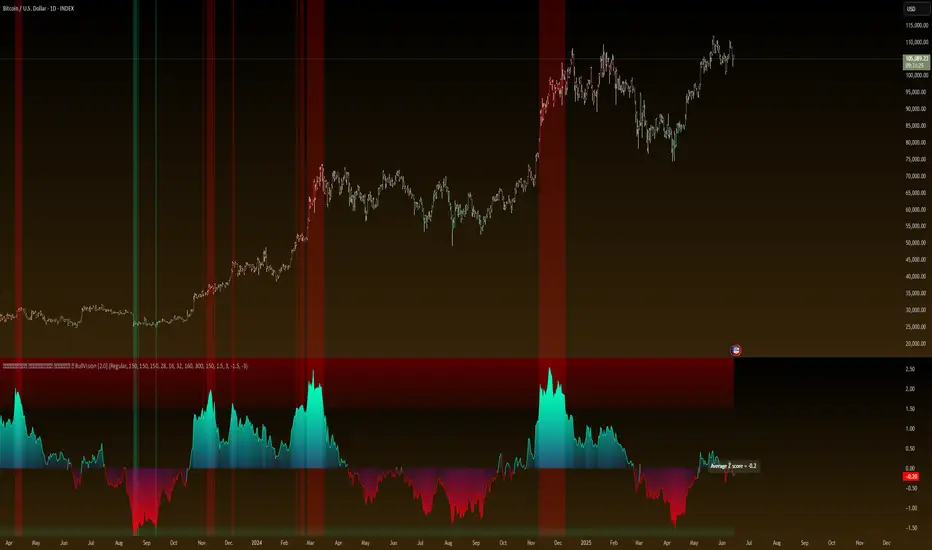
Universal Trend and Valuation System [QuantAlgo]Universal Trend and Valuation System 📊🧬
The Universal Trend and Valuation System by QuantAlgo is an advanced indicator designed to assess asset valuation and trends across various timeframes and asset classes. This system integrates multiple advanced statistical indicators and techniques with Z-score calculations to help traders and investors identify overbought/sell and oversold/buy signals. By evaluating valuation and trend strength together, this tool empowers users to make data-driven decisions, whether they aim to follow trends, accumulate long-term positions, or identify turning points in mean-reverting markets.
💫 Conceptual Foundation and Innovation
The Universal Trend and Valuation System by QuantAlgo provides a unique framework for assessing market valuation and trend dynamics through a blend of Z-score analysis and trend-following algorithm. Unlike traditional indicators that only reflect price direction, this system incorporates multi-layered data to reveal the relative value of an asset, helping users determine whether it’s overvalued, undervalued, or approaching a trend reversal. By combining high quality trend-following tools, such as Dynamic Score Supertrend, DEMA RSI, and EWMA, it evaluates trend stability and momentum quality, while Z-scores of performance ratios like Sharpe, Sortino, and Omega standardize deviations from historical trends, enabling traders and investors to spot extreme conditions. This dual approach allows users to better identify accumulation (undervaluation) and distribution (overvaluation) phases, enhancing strategies like Dollar Cost Averaging (DCA) and overall timing for entries and exits.
📊 Technical Composition and Calculation
The Universal Trend-Following Valuation System is composed of several trend-following and valuation indicators that create a dynamic dual scoring model:
Risk-Adjusted Ratios (Sharpe, Sortino, Omega): These ratios assess trend quality by analyzing an asset’s risk-adjusted performance. Sharpe and Sortino provide insight into trend consistency and risk/reward, while Omega evaluates profitability potential, helping traders and investors assess how favorable a trend or an asset is relative to its associated risk.
Dynamic Z-Scores: Z-scores are applied to various metrics like Price, RSI, and RoC, helping to identify statistical deviations from the mean, which indicate potential extremes in valuation. By combining these Z-scores, the system produces a cumulative score that highlights when an asset may be overbought or oversold.
Aggregated Trend-Following Indicators: The model consolidates multiple high quality indicators to highlight probable trend shifts. This helps confirm the direction and strength of market moves, allowing users to spot reversals or entry points with greater clarity.
📈 Key Indicators and Features
The Universal Trend and Valuation System combines various technical and statistical tools to deliver a well-rounded analysis of market trends and valuation:
The indicator utilizes trend-following indicators like RSI with DEMA smoothing and Dynamic Score Supertrend to minimize market noise, providing clearer and more stable trend signals. Sharpe, Sortino, and Omega ratios are calculated to assess risk-adjusted performance and volatility, adding a layer of analysis for evaluating trend quality. Z-scores are applied to these ratios, as well as Price and Rate of Change (RoC), to detect deviations from historical trends, highlighting extreme valuation levels.
The system also incorporates multi-layered visualization with gradient color coding to signal valuation states across different market conditions. These adaptive visual cues, combined with threshold-based alerts for overbought and oversold zones, help traders and investors track probable trend reversals or continuations and identify accumulation or distribution zones, adding reliability to both trend-following and mean-reversion strategies.
⚡️ Practical Applications and Examples
✅ Add the Indicator: Add the Universal Trend-Following Valuation System to your favourites and to your chart.
👀 Monitor Trend Shifts and Valuation Levels: Watch the average Z score, trend probability state and gradient colors to identify overbought and oversold conditions. During undervaluation, consider using a DCA strategy to gradually accumulate positions (buy), while overvaluation may signal distribution or profit-taking phases (sell).
🔔 Set Alerts: Configure alerts for significant trend or valuation changes, ensuring you can act on market movements promptly, even when you’re not actively monitoring the charts.
🌟 Summary and Usage Tips
The Universal Trend and Valuation System by QuantAlgo is a highly adaptable tool, designed to support both trend-following and valuation analysis across different market environments. By combining valuation metrics with high quality trend-following indicators, it helps traders and investors identify the relative value of an asset based on historical norms, providing more reliable overbought/sell and oversold/buy signals. The tool’s flexibility across asset types and timeframes makes it ideal for both short-term trading and long-term investment strategies like DCA, allowing users to capture meaningful trends while minimizing noise.

Revenue GridDescription:
The Revenue Grid indicator helps traders and investors visualize a stock’s valuation by plotting horizontal lines based on its price-to-sales (P/S) ratio. This tool displays how the stock price compares to multiples of its total revenue per share, giving a clear perspective on valuation benchmarks.
Fundamental Concept:
The price-to-sales ratio compares a company’s stock price to its revenue per share. It’s used to evaluate whether a stock is overvalued or undervalued based on its revenue.
This indicator offers a unique way to view this ratio by applying Fibonacci multiples to the revenue per share. It plots lines at these multiples to show how the stock price measures up against different valuation levels.
How It Works:
Data Inputs:
Total Revenue (TR): The company’s revenue over the past twelve months.
Total Shares Outstanding (TSO): The total number of shares in circulation.
Calculation:
Calculates the revenue per share (TR/TSO).
Plots lines at fixed Fibonacci multiples (e.g., 1x, 2x, 3x, 5x, 8x, 13x) of the revenue per share value.
How to Use:
1. Add the "Revenue Grid" indicator to your chart by searching for it in the indicator library and applying it.
2. Observe the lines plotted on the chart. If these lines are trending upwards, it indicates that the revenue is increasing.
3. Analyze how historical prices trend relative to these lines. Look for periods where the stock price supports around specific multiples, you can easily get a sense of overvaluation or undervaluation in certain periods.
Use this information to guide further analysis and investment decisions.
Benefits:
1. Clear Valuation View: Easily see how the company’s revenue translates into stock price levels.
2. Investment Insight: Identify if the stock price is lagging behind revenue growth, which might signal a buying opportunity.
3. Historical Context: Understand how the market has historically valued the company and assess the current valuation.
Do let me know your feedbacks in comments. Happy Investing :)

Stock Value RainbowStock Valuation based on Book Value, Dividends, Cashflow, Earnings and Estimates and Money Multiplier
There are many ways to measure stock valuations: some methods are using book value, some are using dividends, some are using cashflow, some are using earnings and some using estimates data. Most of these valuation methods are based on multiplier effect which measure how many times the stock price could expand from their valuation base. This indicator attempts to unify all these measurements using just simple addition of all measurements such as: book value per share, dividend per share, cashflow per share, earning per share, and estimates of earning per share and then using multiplier effect to create beautiful rainbow to see how far the stock has growing up above or below their valuation base. The higher the stock price on rainbow spectrum means it is more expensive and the lower in the rainbow spectrum means it is cheaper. Here is the basic formula explanation:
SV = (BVPS + DPS + CFPS + EPS + EST) * MM
BVPS = Book Value Per Share (Asset - Liability)
DPS = Dividends Per Share
CFPS = Free Cash Flow Per Share
EPS = Earnings Per Share
EST = Estimates of EPS
MM = Money Multiplier (1x, 2x, ... ,10x)
- The gray line represents the stock value SV
- The rainbow above the gray line represents the multiplication factors from 1x, 2x, ..., 10x
- The rainbow below the gray line represents the division factors from 0.8x, 0.6x, ..., 0.2x
Check other script to value stock and index:
- Stock Value Rainbow: script to value stock based on book value, dividend, cash flow, earning and estimates.
- Index Value Rainbow: script to value index based on fed balance sheet and base money supply
- Gold Value Rainbow: script to value gold based on global money supply
- Stock Value US: script to check US stock value
- Stock Value EU: script to check EU stock value
- Stock Value JP: script to check JP stock value
- Stock Value CN: script to check CN stock value

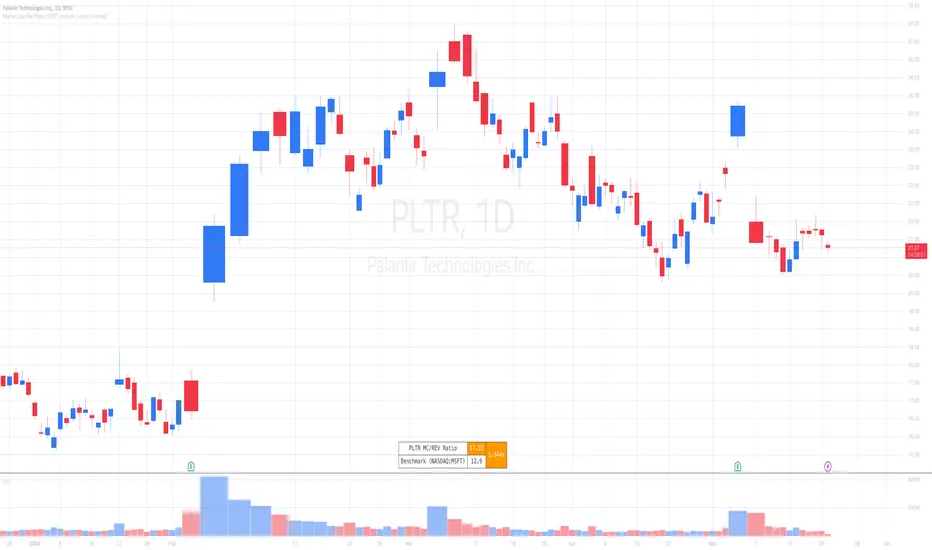
Market Cap / Revenue RatioA variation of the P/S ratio, this script takes the future estimated revenue of the current stock versus it's Market Cap. It then compares the aforementioned Market Cap:Revenue ratio against a market bellwether's corresponding ratio (MSFT by default) to determine the following:
- Light green when the ratio is extremely low (Stock is very undervalued)
- Green when the ratio is low (Stock's multiple is lower by 20-50%)
- Blue when the ratio is close to the benchmark (Stock is fairly valued to benchmark multiple)
- Red when the ratio is high (Stock's mulitple is higher by 50% or more)
- Dark red when the ratio is extremely high (Stock is very overvalued)
CONFIGURABLE
- Full Table: Show the entire calculation table
- Minimalist: Go minimal and show only the ratio and color code
- Show Benchmark Multiple: Show the multiple ratio calculated between the current stock and the benchmark stock (MSFT by default)
NOTES
- When calculating the Market Cap, TradingView sometimes under-reports the number of shares and thus skews the Market Cap too low. This seems to happen for stocks with multiple share classes like GOOGL so be mindful that the data can be wrong for these kinds of stocks. You can check on this by going into the Indicator's Settings and select Show Full Table which will show the number of shares outstanding reported by TradingView.
- For certain stocks such as foreign ADRs, there won't be a future revenue estimate so the script will automatically use the Total Revenue for the most recent Quarter in these cases
Global Financial IndexIntroducing the "Global Financial Index" indicator on TradingView, a meticulously crafted tool derived from extensive research aimed at providing the most comprehensive assessment of a company's financial health, profitability, and valuation. Developed with the discerning trader and investor in mind, this indicator amalgamates a diverse array of financial metrics, meticulously weighted and balanced to yield optimal results.
Financial Strength:
Financial strength is a cornerstone of a company's stability and resilience in the face of economic challenges. It encompasses various metrics that gauge the company's ability to meet its financial obligations, manage its debt, and generate sustainable profits. In our Global Financial Index indicator, the evaluation of financial strength is meticulously crafted to provide investors with a comprehensive understanding of a company's fiscal robustness. Let's delve into the key components and the rationale behind their inclusion:
1. Current Ratio:
The Current Ratio serves as a vital indicator of a company's liquidity position by comparing its current assets to its current liabilities.
A ratio greater than 1 indicates that the company possesses more short-term assets than liabilities, suggesting a healthy liquidity position and the ability to meet short-term obligations promptly.
By including the Current Ratio in our evaluation, we emphasize the importance of liquidity management in sustaining business operations and weathering financial storms.
2. Debt to Equity Ratio:
The Debt to Equity Ratio measures the proportion of a company's debt relative to its equity, reflecting its reliance on debt financing versus equity financing.
A higher ratio signifies higher financial risk due to increased debt burden, potentially leading to liquidity constraints and solvency issues.
Incorporating the Debt to Equity Ratio underscores the significance of balancing debt levels to maintain financial stability and mitigate risk exposure.
3. Interest Coverage Ratio:
The Interest Coverage Ratio assesses a company's ability to service its interest payments with its operating income.
A higher ratio indicates a healthier financial position, as it implies that the company generates sufficient earnings to cover its interest expenses comfortably.
By evaluating the Interest Coverage Ratio, we gauge the company's capacity to manage its debt obligations without compromising its profitability or sustainability.
4. Altman Z-Score:
The Altman Z-Score, developed by Edward Altman, is a composite metric that predicts the likelihood of a company facing financial distress or bankruptcy within a specific timeframe.
It considers multiple financial ratios, including liquidity, profitability, leverage, and solvency, to provide a comprehensive assessment of a company's financial health.
The Altman Z-Score categorizes companies into distinct risk groups, allowing investors to identify potential warning signs and make informed decisions regarding investment or credit exposure.
By integrating the Altman Z-Score, we offer a nuanced perspective on a company's financial viability and resilience in turbulent market conditions.
Profitability Rank:
Profitability rank is a crucial aspect of investment analysis that evaluates a company's ability to generate profits relative to its peers and industry benchmarks. It involves assessing various profitability metrics to gauge the efficiency and effectiveness of a company's operations and management. In our Global Financial Index indicator, the profitability rank segment is meticulously designed to provide investors with a comprehensive understanding of a company's profitability dynamics. Let's delve into the key components and rationale behind their inclusion:
1. Return on Equity (ROE):
Return on Equity measures a company's net income generated relative to its shareholders' equity.
A higher ROE indicates that a company is generating more profits with its shareholders' investment, reflecting efficient capital utilization and strong profitability.
By incorporating ROE, we assess management's ability to generate returns for shareholders and evaluate the overall profitability of the company's operations.
2. Gross Profit Margin:
Gross Profit Margin represents the percentage of revenue retained by a company after accounting for the cost of goods sold (COGS).
A higher gross profit margin indicates that a company is effectively managing its production costs and pricing strategies, leading to greater profitability.
By analyzing gross profit margin, we evaluate a company's pricing power, cost efficiency, and competitive positioning within its industry.
3. Operating Profit Margin:
Operating Profit Margin measures the percentage of revenue that remains after deducting operating expenses, such as salaries, rent, and utilities.
A higher operating profit margin signifies that a company is efficiently managing its operating costs and generating more profit from its core business activities.
By considering operating profit margin, we assess the underlying profitability of a company's operations and its ability to generate sustainable earnings.
4. Net Profit Margin:
Net Profit Margin measures the percentage of revenue that remains as net income after deducting all expenses, including taxes and interest.
A higher net profit margin indicates that a company is effectively managing its expenses and generating greater bottom-line profitability.
By analyzing net profit margin, we evaluate the overall profitability and financial health of a company, taking into account all expenses and income streams.
Valuation Rank:
Valuation rank is a fundamental aspect of investment analysis that assesses the attractiveness of a company's stock price relative to its intrinsic value. It involves evaluating various valuation metrics to determine whether a stock is undervalued, overvalued, or fairly valued compared to its peers and the broader market. In our Global Financial Index indicator, the valuation rank segment is meticulously designed to provide investors with a comprehensive perspective on a company's valuation dynamics. Let's explore the key components and rationale behind their inclusion:
1. Price-to-Earnings (P/E) Ratio:
The Price-to-Earnings ratio is a widely used valuation metric that compares a company's current stock price to its earnings per share (EPS).
A lower P/E ratio may indicate that the stock is undervalued relative to its earnings potential, while a higher ratio may suggest overvaluation.
By incorporating the P/E ratio, we offer insight into market sentiment and investor expectations regarding a company's future earnings growth prospects.
2. Price-to-Book (P/B) Ratio:
The Price-to-Book ratio evaluates a company's market value relative to its book value, which represents its net asset value per share.
A P/B ratio below 1 may indicate that the stock is trading at a discount to its book value, potentially signaling an undervalued opportunity.
Conversely, a P/B ratio above 1 may suggest overvaluation, as investors are paying a premium for the company's assets.
By considering the P/B ratio, we assess the market's perception of a company's tangible asset value and its implications for investment attractiveness.
3. Dividend Yield:
Dividend Yield measures the annual dividend income received from owning a stock relative to its current market price.
A higher dividend yield may indicate that the stock is undervalued or that the company is returning a significant portion of its profits to shareholders.
Conversely, a lower dividend yield may signal overvaluation or a company's focus on reinvesting profits for growth rather than distributing them as dividends.
By analyzing dividend yield, we offer insights into a company's capital allocation strategy and its implications for shareholder returns and valuation.
4. Discounted Cash Flow (DCF) Analysis:
Discounted Cash Flow analysis estimates the present value of a company's future cash flows, taking into account the time value of money.
By discounting projected cash flows back to their present value using an appropriate discount rate, DCF analysis provides a fair value estimate for the company's stock.
Comparing the calculated fair value to the current market price allows investors to assess whether the stock is undervalued, overvalued, or fairly valued.
By integrating DCF analysis, we offer a rigorous framework for valuing stocks based on their underlying cash flow generation potential.
Earnings Transparency:
Mitigating the risk of fraudulent financial reporting is crucial for investors. The indicator incorporates the Beneish M-Score, a robust model designed to detect earnings manipulation or financial irregularities. By evaluating various financial ratios and metrics, this component provides valuable insights into the integrity and transparency of a company's financial statements, aiding investors in mitigating potential risks.
Overall Score:
The pinnacle of the "Global Financial Index" is the Overall Score, a comprehensive amalgamation of financial strength, profitability, valuation, and manipulation risk, further enhanced by the inclusion of the Piotroski F-Score. This holistic score offers investors a succinct assessment of a company's overall health and investment potential, facilitating informed decision-making.
The weighting and balancing of each metric within the indicator have been meticulously calibrated to ensure accuracy and reliability. By amalgamating these diverse metrics, the "Global Financial Index" empowers traders and investors with a powerful tool for evaluating investment opportunities with confidence and precision.
This indicator is provided for informational purposes only and does not constitute financial advice, investment advice, or any other type of advice. The information provided by this indicator should not be relied upon for making investment decisions. Trading and investing in financial markets involves risk, and you should carefully consider your financial situation and consult with a qualified financial advisor before making any investment decisions. Past performance is not necessarily indicative of future results. The creator of this indicator makes no representations or warranties of any kind, express or implied, about the completeness, accuracy, reliability, suitability, or availability with respect to the indicator or the information contained herein. Any reliance you place on such information is therefore strictly at your own risk. By using this indicator, you agree to assume full responsibility for any and all gains and losses, financial, emotional, or otherwise, experienced, suffered, or incurred by you.

Fair ValueThis indicator is designed to provide a valuation perspective based on a specified length and deviations from a base value. This code calculates fair value levels relative to a chosen source (typically closing prices) using simple moving averages (SMA) or exponential moving averages (EMA). Please note that this is purely educational and should not be considered financial advice.
Key Features:
1. Valuation Calculation: The indicator computes a base value using either SMA or EMA, providing a reference point for fair value.
2. Deviation Levels: Additional levels of valuation are defined as deviations from the base value, indicating potential overvalued or undervalued conditions.
3. Currency-Specific Display: It displays valuation levels in different currency symbols based on the asset's trading currency.
4. Visual Representation: The indicator plots fair value lines and shades areas to highlight potential deviations.
5. Line Projection: A projection line shows potential future movement based on the calculated slope. This feature forecasts future price movement using a linear regression line's slope, dynamically projecting the trend forward. It provides traders with valuable insight into potential future price behavior. The implementation involves complex mathematical computations to determine the slope and iterative drawing of projected segments.
Educational Purpose: This indicator is for educational purposes only. It does not guarantee accuracy or suitability for trading decisions.
Please use caution and consider consulting a financial professional before making any investment decisions based on this indicator. Keep in mind that market conditions can change rapidly, and historical performance may not predict future results.

BTC Valuation
The BTC Valuation indicator
is a powerful tool designed to assist traders and analysts in evaluating the current state of Bitcoin's market valuation. By leveraging key moving averages and a logarithmic trendline, this indicator offers valuable insights into potential buying or selling opportunities based on historical price value.
Key Features:
200MA/P (200-day Moving Average to Price Ratio):
Provides a perspective on Bitcoin's long-term trend by comparing the current price to its 200-day Simple Moving Average (SMA).
A positive value suggests potential undervaluation, while a negative value may indicate overvaluation.
50MA/P (50-day Moving Average to Price Ratio):
Focuses on short-term trends, offering insights into the relationship between Bitcoin's current price and its 50-day SMA.
Helps traders identify potential bullish or bearish trends in the near term.
LTL/P (Logarithmic TrendLine to Price Ratio):
Incorporates a logarithmic trendline, considering Bitcoin's historical age in days.
Assists in evaluating whether the current price aligns with the long-term logarithmic trend, signaling potential overvaluation or undervaluation.
How to Use:
Z Score Indicator Integration:
The BTC Valuation indicator leverages the Z Score Indicator to score the ratios in a statistical way.
Statistical scoring provides a standardized measure of how far each ratio deviates from the mean, aiding in a more nuanced and objective evaluation.
Z Score Indicator
This BTC Valuation indicator provides a comprehensive view of Bitcoin's valuation dynamics, allowing traders to make informed decisions.
While indicators like BTC Valuation provide valuable insights, it's crucial to remember that no indicator guarantees market predictions.
Traders should use indicators as part of a comprehensive strategy and consider multiple factors before making trading decisions.
Historical performance is not indicative of future results. Exercise caution and continually refine your approach based on market dynamics.

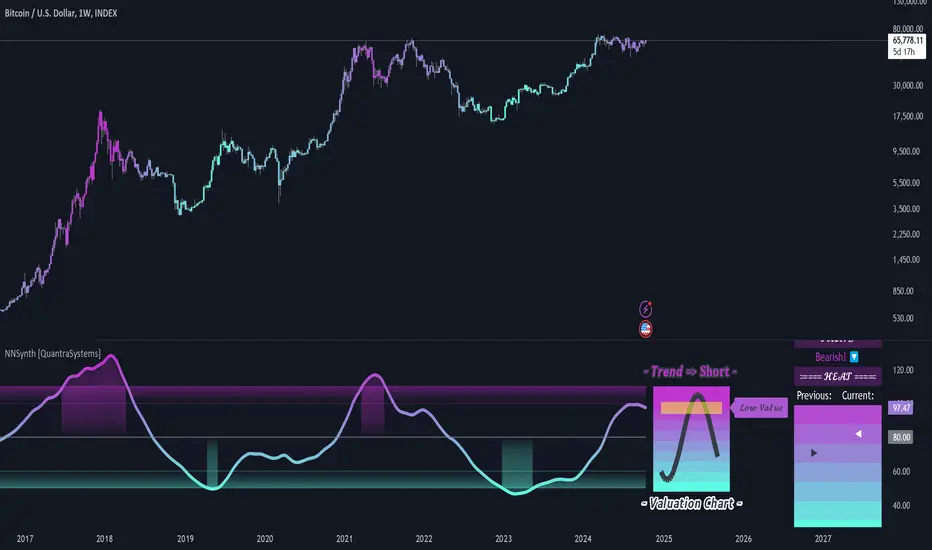
Neural Network Synthesis: Trend and Valuation [QuantraSystems]Neural Network Synthesis - Trend and Valuation
Introduction
The Neural Network Synthesis (𝓝𝓝𝒮𝔂𝓷𝓽𝓱) indicator is an innovative technical analysis tool which leverages neural network concepts to synthesize market trend and valuation insights.
This indicator uses a bespoke neural network model to process various technical indicator inputs, providing an improved view of market momentum and perceived value.
Legend
The main visual component of the 𝓝𝓝𝒮𝔂𝓷𝓽𝓱 indicator is the Neural Synthesis Line , which dynamically oscillates within the valuation chart, categorizing market conditions as both under or overvalued and trending up or down.
The synthesis line coloring can be set to trend analysis or valuation modes , which can be reflected in the bar coloring.
The sine wave valuation chart oscillates around a central, volatility normalized ‘fair value’ line, visually conveying the natural rhythm and cyclical nature of asset markets.
The positioning of the sine wave in relation to the central line can help traders to visualize transitions from one market phase to another - such as from an undervalued phase to fair value or an overvalued phase.
Case Study 1
The asset in question experiences a sharp, inefficient move upwards. Such movements suggest an overextension of price, and mean reversion is typically expected.
Here, a short position was initiated, but only after the Neural Synthesis line confirmed a negative trend - to mitigate the risk of shorting into a continuing uptrend.
Two take-profit levels were set:
The midline or ‘fair value’ line.
The lower boundary of the 𝓝𝓝𝒮𝔂𝓷𝓽𝓱 indicators valuation chart.
Although mean-reversion trades are typically closed when price returns to the mean, under circumstances of extreme overextension price often overcorrects from an overbought condition to an oversold condition.
Case Study 2
In the above study, the 𝓝𝓝𝒮𝔂𝓷𝓽𝓱 indicator is applied to the 1 Week Bitcoin chart in order to inform long term investment decisions.
Accumulation Zones - Investors can choose to dollar cost average (DCA) into long term positions when the 𝓝𝓝𝒮𝔂𝓷𝓽𝓱 indicates undervaluation
Distribution Zones - Conversely, when overvalued conditions are indicated, investors are able to incrementally sell holdings expecting the market peak to form around the distribution phase.
Note - It is prudent to pay close attention to any change in trend conditions when the market is in an accumulation/distribution phase, as this can increase the likelihood of a full-cycle market peak forming.
In summary, the 𝓝𝓝𝒮𝔂𝓷𝓽𝓱 indicator is also an effective tool for long term investing, especially for assets like Bitcoin which exhibit prolonged bull and bear cycles.
Special Note
It is prudent to note that because markets often undergo phases of extreme speculation, an asset's price can remain over or undervalued for long periods of time, defying mean-reversion expectations. In these scenarios it is important to use other forms of analysis in confluence, such as the trending component of the 𝓝𝓝𝒮𝔂𝓷𝓽𝓱 indicator to help inform trading decisions.
A special feature of Quantra’s indicators is that they are probabilistically built - therefore they work well as confluence and can easily be stacked to increase signal accuracy.
Example Settings
As used above.
Swing Trading
Smooth Length = 150
Timeframe = 12h
Long Term Investing
Smooth Length = 30
Timeframe = 1W
Methodology
The 𝓝𝓝𝒮𝔂𝓷𝓽𝓱 indicator draws upon the foundational principles of Neural Networks, particularly the concept of using a network of ‘neurons’ (in this case, various technical indicators). It uses their outputs as features, preprocesses this input data, runs an activation function and in the following creates a dynamic output.
The following features/inputs are used as ‘neurons’:
Relative Strength Index (RSI)
Moving Average Convergence-Divergence (MACD)
Bollinger Bands
Stochastic Momentum
Average True Range (ATR)
These base indicators were chosen for their diverse methodologies for capturing market momentum, volatility and trend strength - mirroring how neurons in a Neural Network capture and process varied aspects of the input data.
Preprocessing:
Each technical indicator’s output is normalized to remove bias. Normalization is a standard practice to preprocess data for Neural Networks, to scale input data and allow the model to train more effectively.
Activation Function:
The hyperbolic tangent function serves as the activation function for the neurons. In general, for complete neural networks, activation functions introduce non-linear properties to the models and enable them to learn complex patterns. The tanh() function specifically maps the inputs to a range between -1 and 1.
Dynamic Smoothing:
The composite signal is dynamically smoothed using the Arnaud Legoux Moving Average, which adjusts faster to recent price changes - enhancing the indicator's responsiveness. It mimics the learning rate in neural networks - in this case for the output in a single layer approach - which controls how much new information influences the model, or in this case, our output.
Signal Processing:
The signal line also undergoes processing to adapt to the selected assets volatility. This step ensures the indicator’s flexibility across assets which exhibit different behaviors - similar to how a Neural Network adjusts to various data distributions.
Notes:
While the indicator synthesizes complex market information using methods inspired by neural networks, it is important to note that it does not engage in predictive modeling through the use of backpropagation. Instead, it applies methodologies of neural networks for real-time market analysis that is both dynamic and adaptable to changing market conditions.
EPS GridIntroduction:
This simple indicator offers insights into the relationship between stock prices and earnings, aiding in the assessment of valuation dynamics during different periods.
Understanding Price-to-Earnings (P/E) Ratio:
The commonly used Price to Earnings (P/E) ratio, calculated as Current Price divided by Earnings Per Share (EPS) over the trailing 12 months (TTM), serves as a fundamental metric. Here, we use this formula to estimate a stock's price. For instance, multiplying EPS by 10 provides an approximation of the stock price with a P/E ratio of 10.
The Grid Concept:
Utilizing this principle, a visual grid is constructed to illustrate how stock prices correlate with earnings. This grid facilitates the identification of both potential bargains and overvalued stocks.
How to Utilize:
This indicator is pre-configured with earnings multiples of 10, 15, 20, and 25. Simply add it to your chart and observe whether earnings demonstrate consistent growth. If prices lag behind earnings, a potential catch-up phase may ensue in the future.
Happy Investing!
Embark on your investment journey armed with this indicator, and may it guide you towards informed decisions and successful ventures.
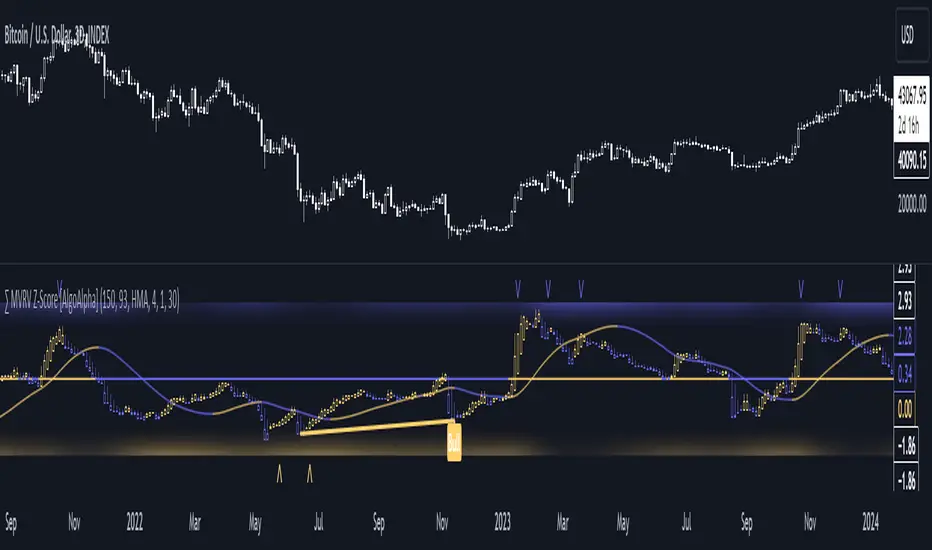
MVRV Z-Score [AlgoAlpha]Introducing the ∑ MVRV Z-Score by AlgoAlpha, a dynamic and sophisticated tool designed for traders seeking to gain an edge in INDEX:BTCUSD analysis. This script employs advanced statistical techniques on Bitcoin On-Chain data to offer a deeper understanding of market conditions, focusing on valuation extremes and momentum trends. Let's explore the features and functionalities that make this tool a valuable addition to your trading arsenal.
Key Features:
🔶 Adjustable Parameters: Customize the Z score lookback length, moving average lookback length, and choose from six moving average types, tailoring the analysis to your trading style.
🔶 Heiken Ashi Compatibility: Incorporate Heiken Ashi plots to visualize market trends, adding a layer of clarity to your technical analysis.
🔶 Divergence Alerts: Detect significant bullish and bearish divergences, allowing for timely identification of potential market reversals.
🔶 Configurable Alerts: Set alerts for overbought, oversold, and divergence conditions, ensuring you never miss an opportunity.
How to Use:
1. ➡️ Parameter Selection: Start by configuring the Z-Score and moving average settings according to your analysis needs. This includes selecting the lookback period and the type of moving average.
2. ➡️ Visualization Options: Choose to enable Heiken Ashi plots for an alternative view of the Z-Score, which can help in identifying trend directions more clearly.
3. ➡️ Monitor for Signals: Keep an eye out for divergence signals and overbought/oversold conditions as potential indicators for entering or exiting trades.
4. ➡️ Alert Setup: Configure alerts based on your selected parameters to receive notifications for important market movements and conditions.
How It Works:
The core of this tool is the Z-Score calculation, which assesses the standard deviation of the current market value from its mean, highlighting overvalued or undervalued market conditions. Here's a brief overview of the script's operational mechanics:
1. 📊 Calculating the Z-Score: The script first calculates the mean over a user-defined lookback period of the MVRV ratio, then it computes the Z-Score to identify deviations from the average.
meanValue = ta.sma(marketValue, zScoreLookback)
zScoreValue = (marketValue - meanValue) / ta.stdev(marketValue, zScoreLookback)
2. 📈 Applying a Moving Average: To smooth the Z-Score data and make trends more discernible, a moving average is applied. Users can choose from several types, such as SMA, EMA, or HMA, based on their preference.
3. 🔄 Heiken Ashi Visualization: For those opting for a more intuitive trend analysis, Heiken Ashi plots can be enabled, transforming the Z-Score data into candlestick charts that simplify trend identification.
4. 🔍 Identifying Divergences: The script is equipped to spot divergences between the market price action and the Z-Score, signaling potential bullish or bearish market reversals.
oscHigherLow = haClose > ta.valuewhen(findPivotLow, haClose , 1) and isInRange(findPivotLow )
priceLowerLow = low < ta.valuewhen(findPivotLow, low , 1)
bullishCondition = enablePlotBullish and priceLowerLow and oscHigherLow and findPivotLow
5. 🚨 Configurable Alerts: Lastly, the script allows for the setting of customizable alerts based on the Z-Score, moving averages, and identified divergences, enabling traders to react promptly to market changes.
The ∑ MVRV Z-Score by AlgoAlpha is an essential tool for traders looking to analyze and interpret market dynamics through a quantitatively rigorous lens. Whether you're focused on identifying market extremes or tracking trend momentum, this script offers the insights needed to support informed trading decisions. 🌟📊💡
Fair Value by MMEnglish
IMPORTANT NOTICE
This indicator is used to find fair value based on historical data. Past growth data may not be sustainable, which will cause the price targets given by the indicator to be inaccurate. Any price on this indicator cannot be considered as investment advice. Trading decisions are the responsibility of the person using the indicator.
What is the Fair Value by MM indicator?
This is an indicator that tries to find the fair value of a stock by looking at its historical data and growth over a certain period of time. By analyzing a stock's historical growth data, it generates a fair value and potential price estimate.
The indicator presents the financial data of a stock with 3 different data sets.
1. Summary and Valuation
2. Average Quarterly Growth
3. Profit margins
** Number of Lookback Periods for Quarters **
The first input of the indicator is where you specify how many quarters back to value the stock. By default, it is based on the last 12 quarters, i.e. 3 years. Since there is not enough historical data for newly listed companies, you can change this figure according to the company you are analyzing.
** Show Summary **
The Indicator starts in this mode by default. This mode gives you data such as sales, EBITDA, EBIT, net profit and free cash flow in PER SHARE and TTM values. The reason for using per share values is that a company's price is per share, and it saves you time to look at all other metrics on a per share basis. For example, if a company with a share price of $10 has sales per share of $5, we can say that this company has generated half of its market capitalization in sales revenue in the last 1 year.
In the indicator's default mode (Show Summary);
1. Sales per share TTM (Red)
2. EBITDA per share TTM (Orange)
3. EBIT per share TTM (Yellow)
4. Net Income per share TTM (Blue)
5. Free Cash Flow per share TTM (Green)
6. Share close price (White)
7. Fair value of the share (Green if price is below fair value, Red if price is above fair value)
8. Price target for the next 12 months (Yellow)
** Show AVG Growth QoQ **
When this option is selected, you can see the average quarterly growth in sales, EBITDA, EBIT, net profit and free cash flow, respectively, over the period you have selected (e.g. the last 12 quarters). This data gives an idea about the company's growth and the pace of its growth.
** Show Profit Margins **
When this option is selected, you can see gross profit margin, EBITDA margin, EBIT margin, net profit margin and free cash flow margin data respectively. It provides a quick overview to determine whether the company is increasing revenue by narrowing profit margins or increasing both revenue growth and profit margins.
** Include Sales **
When this option is selected, sales revenues are included in the company's valuation.
** Include Ebitda **
When this option is selected, EBITDA is included in the valuation of the company.
** Include Ebit **
When this option is selected, EBIT is included in the valuation of the company.
** Include Net Profit **
When this option is selected, net profit is included in the valuation of the company.
** Include FCF **
When this option is selected, free cash flow is included in the valuation of the company.
By default, the valuation is based on sales, EBITDA and EBIT. Net profit and free cash flow can be optionally selected. Or the metrics you do not want can be excluded from the valuation calculation.
What do the colors mean?
** Red **
Represents the company's data related to the company's sales.
** Orange **
Represents the company's data related to the company's EBITDA.
** Yellow **
Represents the company's data related to the company's EBIT.
** Blue **
Represents the company's data related to the company's Net Income.
** Green **
Represents the company's data related to the company's Free Cash Flow.
Turkish
ÖNEMLİ UYARI
Bu indikatör geçmiş verileri baz alarak adil değer bulmaya yarar. Geçmişte oluşan büyüme verileri sürdürelebilir olmayabilir, bu da indikatörün verdiği fiyat hedeflerinin yanılmasına sebep olacaktır. Bu indikatör üzerinde yer alan herhangi bir fiyat, yatırım tavsiyesi kapsamında değerlendirilemez. Alım/satım kararları indikatörü kullanan kişinin sorumluluğundadır.
Fair Value by MM indikatörü nedir?
Bu bir hissenin belirli bir periyotu kapsayan geçmiş verilerine ve gelişimlerine bakarak adil değerini bulmaya çalışan bir indikatördür. Bir hissenin geçmiş büyüme verilerini analiz ederek adil değer ve potansiyel fiyat tahmini oluşturur.
İndikatör bir hissenin finansal datasını 3 farklı veri seti ile sunmaktadır.
1. Özet ve Değerleme
2. Ortalama Çeyreklik Büyümeler
3. Kar marjları
** Number of Lookback Periods for Quarters **
İndikatörün ilk input’u, hisseyi değerlemek için kaç çeyrek geriye bakacağınızı belirttiğiniz kısımdır. Varsayılan olarak son 12 çeyrek, yani 3 yılı baz alır. Yeni arz olmuş şirketlerde yeterli geçmiş veri bulunmadığı için bu rakamı incelediğiniz şirkete göre değiştirebilirsiniz.
** Show Summary **
İndikatör varsayılan olarak bu modda başlar. Bu mod, satışlar, favök, esas faaliyet karı, net kar ve serbest nakit akışı gibi verileri HİSSE BAŞINA ve YILLIKLANDIRILMIŞ değerleri ile size verir. Hisse başına değerlerin kullanılmasındaki sebep, bir şirketin fiyatı hisse başınadır, ve diğer tüm metriklere hisse başına bakmak size zaman kazandırır. Örneğin, hisse fiyatı $10 olan bir şirketin, hisse başına satışları $5 ise, bu şirket son 1 yılda piyasa değerinin yarısı kadar satış geliri elde etmiş diyebiliriz.
İndikatörün varsayılan modunda (Show Summary);
1. Hisse başına yıllıklandırılmış Satışlar (Kırmızı)
2. Hisse başına yıllıklandırılmış FAVÖK (Turuncu)
3. Hisse başına yıllıklandırılmış Esas Faaliyet Karı (Sarı)
4. Hisse başına yıllıklandırılmış Net Kar (Mavi)
5. Hisse başına yıllıklandırılmış Serbest Nakit Akışı (Yeşil)
6. Hisse kapanış fiyatı (Beyaz)
7. Hissenin adil değeri (Fiyat Adil değerin altında ise Yeşil, Üstünde ise Kırmızı)
8. Önümüzdeki 12 aylık fiyat hedefi (Sarı)
** Show AVG Growth QoQ **
Bu seçenek seçildiğinde, sırası ile satışlar, favök, esas faaliyet karı, net kar ve serbest nakit akışının, seçmiş olduğunuz periyotta (örneğin son 12 çeyrek), çeyreklik olarak ortalama % kaç büyüdüğünü görebilirsiniz. Bu veri, şirketin gelişimi ve gelişim hızı hakkında fikir vermektedir.
** Show Profit Margings **
Bu seçenek seçildiğinde, sırası ile brüt kar marjı, favök marjı, esas faaliyet kar marjı, net kar marjı ve serbest nakit akışı marjı verilerini görebilirsiniz. Şirketin karlılık marjlarını daraltarak mı gelirini arttırdığını yoksa hem gelir artışı hem de kar marjlarını arttırdığını tespit etmek için hızlı bir bakış sunar.
** Include Sales **
Bu seçenek seçildiğinde, şirketin değerlemesine satış gelirleri dahil edilir.
** Include Ebitda **
Bu seçenek seçildiğinde, şirketin değerlemesine favök dahil edilir.
** Include Ebit **
Bu seçenek seçildiğinde, şirketin değerlemesine esas faaliyet karları dahil edilir.
** Include Net Profit **
Bu seçenek seçildiğinde, şirketin değerlemesine net kar dahil edilir.
** Include FCF **
Bu seçenek seçildiğinde, şirketin değerlemesine serbest nakit akışı dahil edilir.
Varsayılan olarak, satışlar, favök ve esas faaliyet karı üzerinden değerleme yapılır. Net kar ve serbest nakit akışı isteğe göre seçilebilir. Ya da istemediğiniz metrikler değerleme hesaplamasından çıkarılabilir.
Renkler ne anlama geliyor?
** Kırmızı **
Şirketin satışları ile ilgili verilerini temsil eder.
** Turuncu **
Şirketin favök’ü ile ilgili verilerini temsil eder.
** Sarı **
Şirketin esas faaliyet karı ile ilgili verilerini temsil eder.
** Mavi **
Şirketin net karı ile ilgili verileri temsil eder.
** Yeşil **
Şirketin serbest nakit akışı ile ilgili verilerini temsil eder.
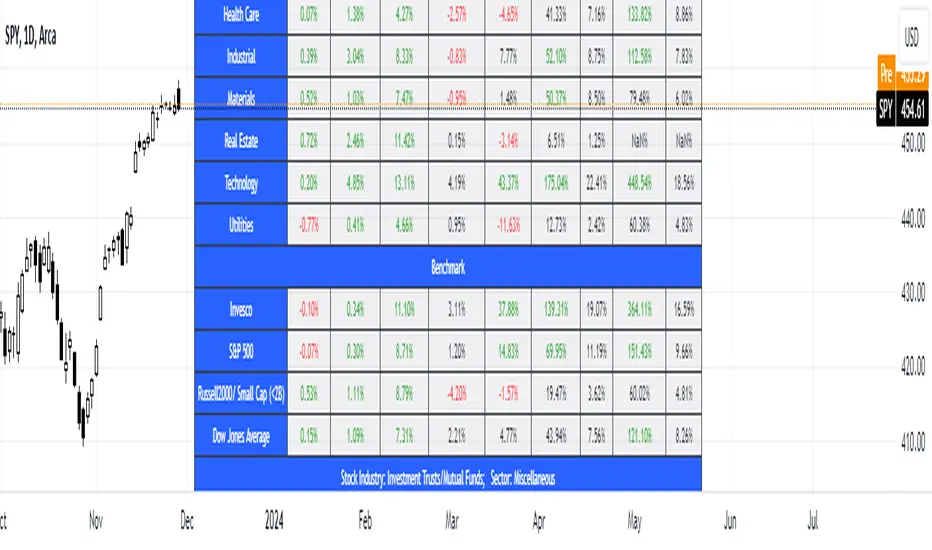
SFC Valuation Model - US SectorSector analysis is an assessment of the economic and financial condition and prospects of a given sector of the economy. Sector analysis serves to provide an investor with a judgment about how well companies in the sector are expected to perform. Sector analysis is typically employed by investors who specialize in a particular sector, or who use a top-down or sector rotation approach to investing.
Sector analysis is based on the premise that certain sectors perform better during different stages of the business cycle. The business cycle refers to the up and down changes in economic activity that occur in an economy over time. The business cycle consists of expansions, which are periods of economic growth, and contractions, which are periods of economic decline.
Investors who employ a top-down approach to sector analysis focus first on macroeconomic conditions in their search for companies that have the potential to outperform. They start by looking at those macroeconomic factors that have the biggest impact on the largest part of the population and the economy, such as unemployment rates, economic outputs, and inflation.
Every sector shows the average return from three ETFs - SPDR, Vanguard, iShares. There is a possibility to see the returns from every ETF by just holding the cursor on the sector name.
There are few valuation methods/steps
- Macroeconomics - analyse the current economic;
- Define how the sector is performing;
- Relative valuation method - compare few stocks and find the Outlier;
- Absolute valuation method historically- define how the stock performed in the past;
- Absolute valuation method - define how the stock is performed now and find the fair value;
- Technical analysis
How to use:
1. Once you have completed the initial evaluation step, simply load the indicator.
2. Analyse which sector is outperforming.
SFC Valuation Model - AbsoluteFinancial statement analysis is the process of analyzing a company’s financial statements for decision-making purposes. External stakeholders use it to understand the overall health of an organization and to evaluate financial performance and business value. Internal constituents use it as a monitoring tool for managing the finances.
Most often, analysts will use three main techniques for analyzing a company’s financial statements.
First, horizontal analysis involves comparing historical data. Usually, the purpose of horizontal analysis is to detect growth trends across different time periods.
Second, vertical analysis compares items on a financial statement in relation to each other. For instance, an expense item could be expressed as a percentage of company sales.
Finally, ratio analysis, a central part of fundamental equity analysis, compares line-item data. Price-to-earnings (P/E) ratios, earnings per share, or dividend yield are examples of ratio analysis.
The indicator shows the most important metrics to help investors evaluate a stock. It saves a lot of time searching for metrics on different websites and writing them into different platforms for further analysis.
There are few valuation methods/steps
- Macroeconomics - analyse the current economic;
- Define how the sector is performing;
- Relative valuation method - compare few stocks and find the Outlier;
- Absolute valuation method historically- define how the stock performed in the past;
- Absolute valuation method - define how the stock is performed now and find the fair value;
- Technical analysis
How to use:
1. Once you have completed the initial evaluation steps, simply load the indicator.
2. Make your analysis.
3. Complete the checklist by writing down your thoughts.

SFC Valuation Model - RelativeComparable company analysis, or “Comps” for short, is commonly used to value firms by comparing them to publicly traded companies with similar business operations. An analyst will compare the current share price a public company relative to some metric such as its earnings to derive a P/E ratio. It will then use that ratio to value the company it is trying to determine the worth of.
One of the most popular relative valuation multiples is the price-to-earnings (P/E) ratio. It is calculated by dividing stock price by earnings per share (EPS), and is expressed as a company's share price as a multiple of its earnings. A company with a high P/E ratio is trading at a higher price per dollar of earnings than its peers and is considered overvalued. Likewise, a company with a low P/E ratio is trading at a lower price per dollar of EPS and is considered undervalued. This framework can be carried out with any multiple of price to gauge relative market value. Therefore, if the average P/E for an industry is 10x and a particular company in that industry is trading at 5x earnings, it is relatively undervalued to its peers.
Limitations
Like any valuation tool, relative valuation has its limitations. The biggest limitation is the assumption that the market has valued the business correctly.
Second, all valuation metrics are based on past performance. Investors' perceptions of future performance heavily influence stock prices and most relative valuation metrics don’t account for growth.
Finally and most importantly, relative valuation is no assurance that the "cheaper" company will outperform its peer.
With this indicator, investors can easily compare a few companies and find the outlier. It calculates the average for the sector and highlights the stock that is above the average.
Due to some limitations, the indicator can only compare 5 tickers, but users can always load it twice for more stocks.
Save hours of data entry into Excel spreadsheets to compare stocks !
There are few valuation methods/steps
- Macroeconomics - analyse the current economic;
- Define how the sector is performing;
- Relative valuation method - compare few stocks and find the Outlier;
- Absolute valuation method historically- define how the stock performed in the past;
- Absolute valuation method - define how the stock is performed now and find the fair value;
- Technical analysis
How to use:
1. Once you have completed the initial evaluation steps, simply load the indicator.
2. Add the forwarded EPS.
3. The indicator will do the rest of the calculations for you.

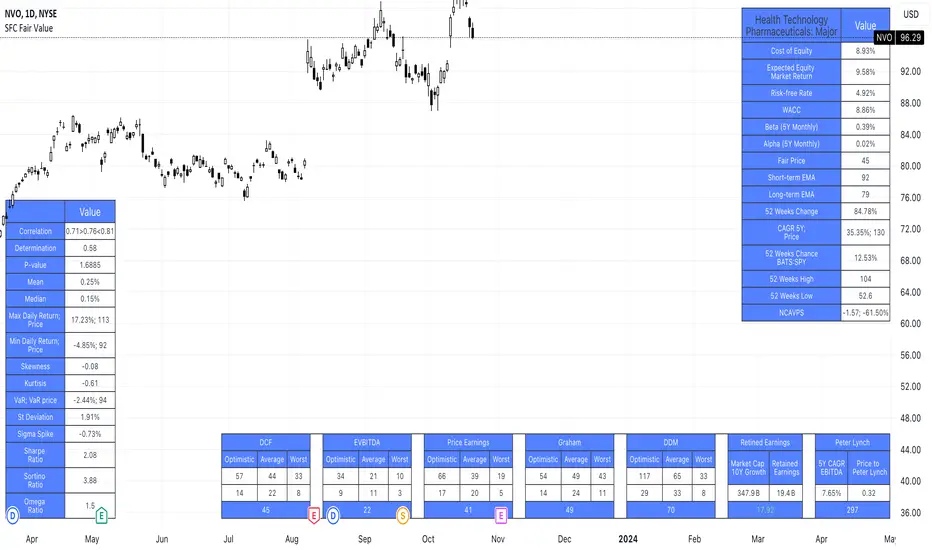
SFC Valuation Model - Fair ValueValuation is the analytical process of determining the current (or projected) worth of an asset or a company. There are many techniques used for doing a valuation. An analyst placing a value on a company looks at the business's management, the composition of its capital structure, the prospect of future earnings, and the market value of its assets, among other metrics.
Fundamental analysis is often employed in valuation, although several other methods may be employed such as the capital asset pricing model (CAPM) or the dividend discount model (DDM), Discounted Cash Flow (DCF) and many others.
A valuation can be useful when trying to determine the fair value of a security, which is determined by what a buyer is willing to pay a seller, assuming both parties enter the transaction willingly. When a security trades on an exchange, buyers and sellers determine the market value of a stock or bond.
There is no universal standard for calculating the intrinsic value of a company or stock. Financial analysts attempt to determine an asset's intrinsic value by using fundamental and technical analyses to gauge its actual financial performance.
Intrinsic value is useful because it can help an investor understand whether a potential investment is overvalued or undervalued.
This indicator allows investors to simulate different scenarios depending on their view of the stock's value. It calculates different models automatically, but users can define the fair value manually by changing the settings.
For example: change the weight of the model; choose how conservatively want to evaluate the stock; use different growth rate or discount rate and so on.
The indicator shows other useful metrics in order to help investors to evaluate the stock.
This indicator can save users hours of searching financial data and calculating fair value.
There are few valuation methods/steps
- Macroeconomics - analyse the current economic;
- Define how the sector is performing;
- Relative valuation method - compare few stocks and find the Outlier;
- Absolute valuation method historically- define how the stock performed in the past;
- Absolute valuation method - define how the stock is performed now and find the fair value;
- Technical analysis
How to use:
1. Once you have completed the initial evaluation steps, simply load the indicator.
2. Check the default settings and see if they suit you.
3. Find the fair value and wait for the stock to reach it.
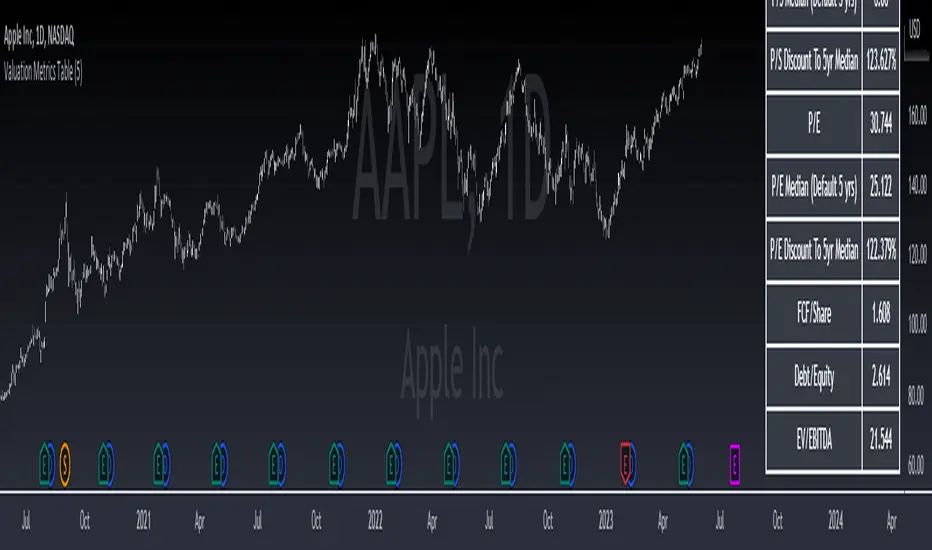
Valuation Metrics Table (P/S, P/E, etc.)This table gives the user a very easy way of seeing many valuation metrics. I also included the 5 year median of the price to sales and price to earnings ratios. Then I calculated the percent difference between the median and the current ratio. This gives a sense of whether or not a stock is over valued or under valued based on historical data. The other ratios are well known and don't require any explanation. You can turn off the ones you don't want in the settings of the indicator. Another thing to mention is that diluted EPS is used in calculations
Rolling Risk-Adjusted Performance RatiosThis simple indicator calculates and provides insights into different performance metrics of an asset - Sharpe, Sortino and Omega Ratios in particular. It allows users to customize the lookback period and select their preferred data source for evaluation of an asset.
Sharpe Ratio:
The Sharpe Ratio measures the risk-adjusted return of an asset by considering both the average return and the volatility or riskiness of the investment. A higher Sharpe Ratio indicates better risk-adjusted performance. It allows investors to compare different assets or portfolios and assess whether the returns adequately compensate for the associated risks. A higher Sharpe Ratio implies that the asset generates more return per unit of risk taken.
Sortino Ratio:
The Sortino Ratio is a variation of the Sharpe Ratio that focuses specifically on the downside risk or volatility of an asset. It takes into account only the negative deviations from the average return (downside deviation). By considering downside risk, the Sortino Ratio provides a more refined measure of risk-adjusted performance, particularly for investors who are more concerned with minimizing losses. A higher Sortino Ratio suggests that the asset has superior risk-adjusted returns when considering downside volatility.
Omega Ratio:
The Omega Ratio measures the probability-weighted ratio of gains to losses beyond a certain threshold or target return. It assesses the skewed nature of an asset's returns by differentiating between positive and negative returns and assigning more weight to extreme gains or losses. The Omega Ratio provides insights into the potential asymmetry of returns, highlighting the potential for significant positive or negative outliers. A higher Omega Ratio indicates a higher probability of achieving large positive returns compared to large negative returns.
Utility:
Performance Evaluation: Provides assessment of an asset's performance, considering both returns and risk factors.
Risk Comparison: Allows for comparing the risk-adjusted returns of different assets or portfolios. Helps identify investments with better risk-reward trade-offs.
Risk Management: Assists in managing risk exposure by evaluating downside risks and volatility.

Index Value RainbowThis indicator is used to estimate Index valuation based on each countries base money supply M0. The chart will compare how the index value will move alongside with base money supply for comparison study. The chart presented here is just a relative comparison with some scaling and shifting so it doesn't refers to any real measurement. However it can be used to track the index whether it's too cheap or too expensive in relative to money supply available in the market.
- The gray line represent the money supply M0
- The rainbow above the gray line represent the multiplication factors from 1x, 2x, ..., 10x
- The rainbow below the gray line represent the division factors from 0.8x, 0.6x, ..., 0.2x
This indicator can only be used with specific indices mentioned below. Currently can be used to estimate the value of largest indices by market cap:
- US Index - based on Fed Balance Sheet (SPX, NDX, DJI, RUI, RUT, RUA, ES1!, NQ1!, YM1!, RTY1!)
- EU Index - based on M1 Money Supply (N100, EU500)
- JP Index - based on M0 Money Supply (NI225, NKY)
- CN Index - based on M0 Money Supply (000001, 399001)
- HK Index - based on M0 Money Supply (HSI)
- SG Index - based on M0 Money Supply (STI)
- CA Index - based on M0 Money Supply (TSX)
- AU Index - based on M0 Money Supply (ASX200, AUS200)
- ID Index - based on M0 Money Supply (COMPOSITE)
Check other script to value stock and index:
- Stock Value Rainbow: script to value stock based on book value, earning, dividend and cash flow
- Index Value Rainbow: script to value index based on fed balance sheet and base money supply
- Gold Value Rainbow: script to value gold based on global money supply
- Stock Value US: script to check US stock value
- Stock Value EU: script to check EU stock value
- Stock Value JP: script to check JP stock value
- Stock Value CN: script to check CN stock value

Valuation RainbowValuation Rainbow
© danny_peanuts
Stock value based on Book Value, Earnings, Dividends and Money Multiplier
SV = (BVPS + EPS + DPS) * MM
BVPS = Book Value Per Share
EPS = Earnings Per Share
DPS = Dividends Per Share
MM = Money Multiplier - Integer Number from 1,2,3, ... ,7
There are multiple ways of valuing the stock. Book value is traditionally used as the basic valuation since it's calculate the total asset value minus the liabilities of any company. There are valuation based on multiplication of book value, there are valuation based on multiplication of earnings, and valuation based on multiplication of dividends. Here I'm proposing valuation based on all of these combined. So this indicator is measuring stock value based on multiplication of book value plus earning plus dividend per share. Since the money supply could have an multiplication effect so does the stock value could have a multiplication effect. Also notes that some blue chips stock tends to value higher than startup stock due to money is not equally distributed. So for simplicity I will use simple integer number to represent this multiplication effect as rainbow color plots, thus it can be applied to any stock at any given countries. The higher the stock price on valuation bands the most expensive it is and the lower the price on valuation bands the cheaper it is.
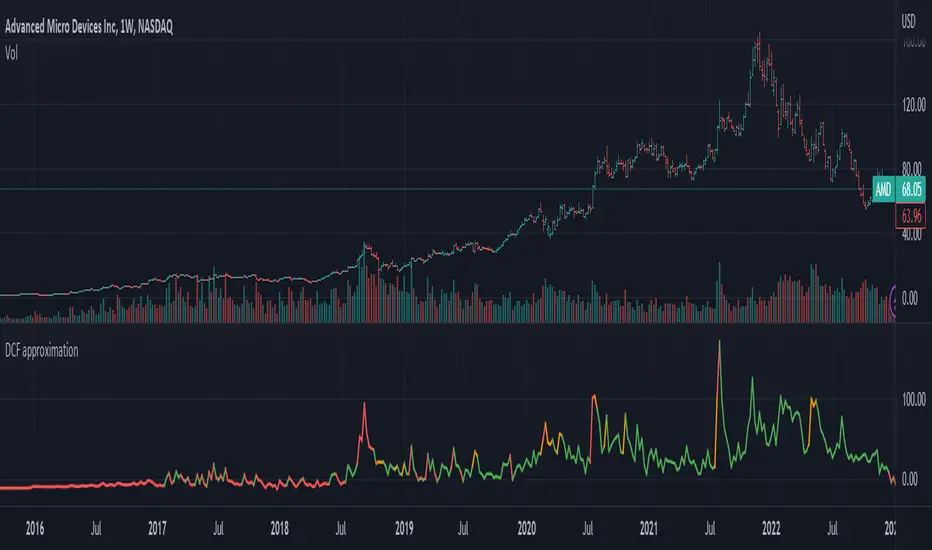
DCF ApproximationThe indicator for calculating and visualizing the Discounted Cash Flow (DCF) for a selected stock.
It uses the Weighted Average Cost of Capital (WACC) with a margin of safety and the Free Cash Flow (FCF) calculation for cash flow analysis. The DCF is calculated by summing the discounted annual FCFs over a 10-year period.
The chart color depends on the value of the current price percentage - it turns red when the market price is over valuation, yellow around a fair value, and green for the price under valuation.
This is an early version of the indicator, so I would appreciate your suggestions for improving the code and formulas.
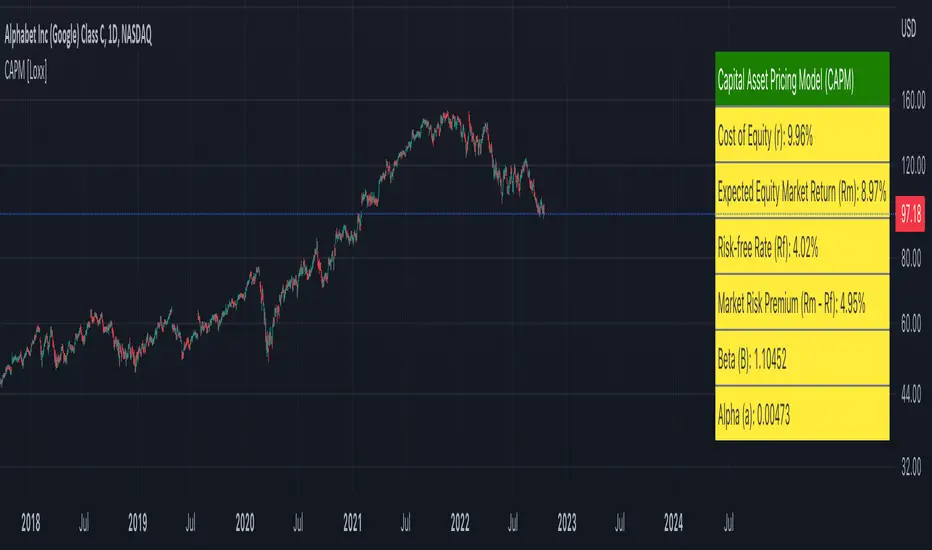
Capital Asset Pricing Model (CAPM) [Loxx]Capital Asset Pricing Model (CAPM) demonstrates how to calculate the Cost of Equity for an underlying asset using Pine Script. This script will only work on the monthly timeframe. While you can change the default inputs, you should study what CAPM is and how this works before doing so. This indicator pulls various types of data from SPY from various timeframes to calculate risk-free rates, market premiums, and log returns. Alpha and Beta are computed using the regression between underlying asset and SPY. This indicator only calculates on the most recent data. If you wish to change this, you'll have to save the script and make adjustments. A few examples where CAPM is used:
Used as the mu factor Geometric Brownian Motion models for options pricing and forecasting price ranges and decay
Calculating the Weighted Average Cost of Capital
Asset pricing
Efficient frontier
Risk and diversification
Security market line
Discounted Cashflow Analysis
Investment bankers use CAPM to value deals
Account firms use CAPM to verify asset prices and assumptions
Real estate firms use variations of CAPM to value properties
... and more
Details of the calculations used here
Rm is calculated using yearly simple returns data from SPY, typically this is just hard coded as 10%.
Rf is pulled from US 10 year bond yields
Beta and Alpha are pulled form monthly returns data of the asset and SPY
In the past, typically this data is purchased from investments banks whose research arms produce values for beta, alpha, risk free rate, and risk premiums. In 2022 ,you can find free estimates for each parameter but these values might not reflect the most current data or research.
History
The CAPM was introduced by Jack Treynor (1961, 1962), William F. Sharpe (1964), John Lintner (1965) and Jan Mossin (1966) independently, building on the earlier work of Harry Markowitz on diversification and modern portfolio theory. Sharpe, Markowitz and Merton Miller jointly received the 1990 Nobel Memorial Prize in Economics for this contribution to the field of financial economics. Fischer Black (1972) developed another version of CAPM, called Black CAPM or zero-beta CAPM, that does not assume the existence of a riskless asset. This version was more robust against empirical testing and was influential in the widespread adoption of the CAPM.
Usage
The CAPM is used to calculate the amount of return that investors need to realize to compensate for a particular level of risk. It subtracts the risk-free rate from the expected rate and weighs it with a factor – beta – to get the risk premium. It then adds the risk premium to the risk-free rate of return to get the rate of return an investor expects as compensation for the risk. The CAPM formula is expressed as follows:
r = Rf + beta (Rm – Rf) + Alpha
Therefore,
Alpha = R – Rf – beta (Rm-Rf)
Where:
R represents the portfolio return
Rf represents the risk-free rate of return
Beta represents the systematic risk of a portfolio
Rm represents the market return, per a benchmark
For example, assuming that the actual return of the fund is 30, the risk-free rate is 8%, beta is 1.1, and the benchmark index return is 20%, alpha is calculated as:
Alpha = (0.30-0.08) – 1.1 (0.20-0.08) = 0.088 or 8.8%
The result shows that the investment in this example outperformed the benchmark index by 8.8%.
The alpha of a portfolio is the excess return it produces compared to a benchmark index. Investors in mutual funds or ETFs often look for a fund with a high alpha in hopes of getting a superior return on investment (ROI).
The alpha ratio is often used along with the beta coefficient, which is a measure of the volatility of an investment. The two ratios are both used in the Capital Assets Pricing Model (CAPM) to analyze a portfolio of investments and assess its theoretical performance.
To see CAPM in action in terms of calculate WACC, see here for an example: finbox.com
Further reading
en.wikipedia.org