52SIGNAL RECIPE Directional Consistency Index═══ 52SIGNAL RECIPE Directional Consistency Index (DCI) ═══
◆ Overview
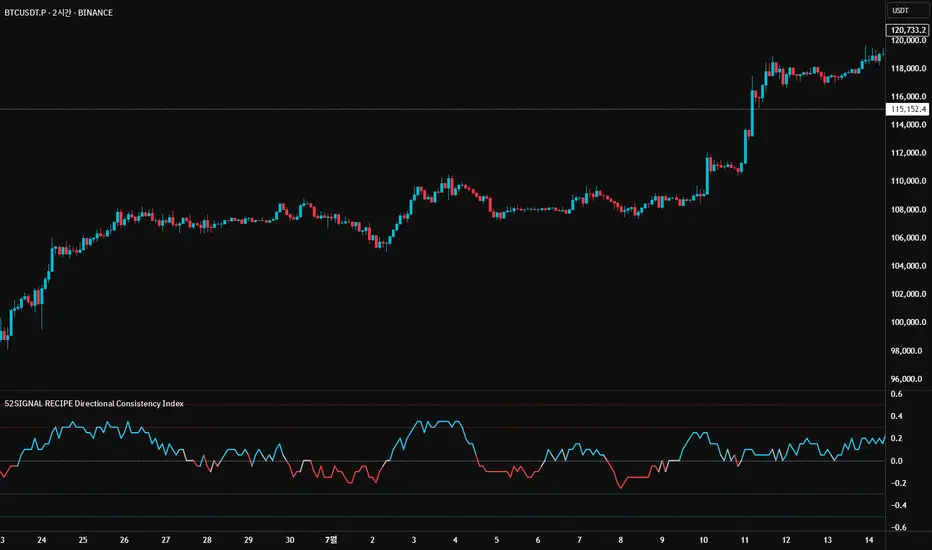
52SIGNAL Directional Consistency Index (DCI) is a technical indicator that measures the directional consistency of market movements. This indicator focuses on the consistency of direction rather than the magnitude of price changes, analyzing the strength of market trends and providing more reliable trend analysis by filtering out noise to reflect only meaningful price movements.
─────────────────────────────────────
◆ Key Features
• Direction-Focused Analysis: Concentrates solely on directional consistency rather than magnitude of price changes
• Noise Filtering: Ignores insignificant price movements through minimum percentage change settings
• Trend Exhaustion Detection: Identifies potential trend reversals as values approach ±0.5 levels
• Intuitive Visualization: Instant recognition of trend direction through color changes based on rising/falling zones
• Multi-Market Application: Adaptable to various financial markets including stocks, cryptocurrencies, and forex
─────────────────────────────────────
◆ Technical Foundation
■ Directional Calculation
• Basic Principle: Counts only the up/down movement of each candle to measure directional consistency
• Calculation Method: Determines direction based on percentage change between current close and previous close
• Direction Values: Simplified into Rising (+1), Falling (-1), or Insignificant Change (0)
• Averaging: DCI calculated as the moving average of direction values over the specified period
■ Noise Filtering Mechanism
• Minimum Percentage Change: The minimum percent change required to consider a price movement significant
• Filtering Effect: Movements smaller than the minimum change are excluded from direction calculation (treated as 0)
• Enhanced Reliability: Adjustable filtering strength for optimization across different market environments
─────────────────────────────────────
◆ Practical Applications
■ Trend Identification & Reversal Prediction
• Early Uptrend Detection:
▶ When DCI enters the 0 to +0.3 range
▶ When recent directional consistency begins to consistently rise
• Early Downtrend Detection:
▶ When DCI enters the 0 to -0.3 range
▶ When recent directional consistency begins to consistently fall
• Trend Reversal Signals:
▶ When DCI approaches +0.5 (uptrend exhaustion, potential downward reversal)
▶ When DCI approaches -0.5 (downtrend exhaustion, potential upward reversal)
■ Trading Strategy Implementation
• Trend Following Strategies:
▶ Consider buying when DCI crosses above the 0 line
▶ Consider selling when DCI crosses below the 0 line
• Reversal Trading:
▶ Consider taking profits or short positions when DCI approaches +0.5
▶ Consider long positions when DCI approaches -0.5
• Divergence Confirmation:
▶ Weakening uptrend signal when price rises but DCI weakens
▶ Weakening downtrend signal when price falls but DCI strengthens
─────────────────────────────────────
◆ Advanced Setting Options
■ Period (Length) Settings
• Short-term Analysis: 5-10 days (faster signals, more sensitive responses)
• Medium-term Analysis: 10-20 days (balanced signals, recommended default)
• Long-term Analysis: 20-30 days (slower signals, long-term trend identification)
■ Minimum Percentage Change Settings
• Low Volatility Markets: 0.05-0.2% (suitable for forex markets)
• Medium Volatility Markets: 0.3-0.5% (suitable for stock markets)
• High Volatility Markets: 0.5-1.0% (suitable for cryptocurrency markets)
■ Settings by Trading Style
• Scalping: Lower period (5-10), lower minimum change (0.05-0.1%)
• Day Trading: Medium period (10-15), medium minimum change (0.2-0.3%)
• Swing Trading: Higher period (15-25), higher minimum change (0.3-0.5%)
─────────────────────────────────────
◆ Synergy with Other Indicators
• Moving Averages: Strengthen signals by confirming moving average crossovers when DCI crosses the 0 line
• RSI: Combine DCI trend direction with RSI overbought/oversold levels to confirm entry points
• MACD: Enhance reliability by pairing DCI directional signals with MACD momentum confirmation
• Bollinger Bands: Analyze volatility by checking Bollinger Band expansion/contraction when DCI approaches ±0.5
─────────────────────────────────────
◆ Conclusion
52SIGNAL Directional Consistency Index (DCI) is a powerful tool for objectively measuring market directionality and visualizing trend strength. The noise filtering through minimum percentage change settings can be adjusted to match your trading style and market characteristics for optimal results. Its ability to identify early trend stages and detect overextended zones provides traders with important entry and exit points. When used in conjunction with other technical indicators, it can significantly enhance the reliability of trading decisions.
─────────────────────────────────────
※ Disclaimer: Past performance does not guarantee future results. Always use appropriate risk management strategies.
═══ 52SIGNAL 방향성 일관성 지수 (DCI) ═══
◆ 개요
52SIGNAL 방향성 일관성 지수(DCI)는 시장의 방향성 일관성을 측정하는 기술적 지표입니다. 이 지표는 가격 변화의 크기가 아닌 방향의 일관성에 중점을 두어 시장의 추세 강도를 분석하고, 노이즈 필터링 기능을 통해 의미 있는 가격 변동만을 반영하여 더 신뢰할 수 있는 추세 분석을 제공합니다.
─────────────────────────────────────
◆ 주요 특징
• 방향성 중심 분석: 가격 변화의 크기가 아닌 방향성에만 집중하여 추세의 일관성 측정
• 노이즈 필터링: 최소 변화율 설정을 통해 의미 없는 작은 가격 변동을 무시
• 추세 과열 감지: ±0.5 수준에 접근할 때 추세 전환 가능성 식별
• 직관적인 시각화: 상승/하락 구간에 따른 색상 변화로 추세 방향 즉각 인식
• 다양한 시장 적용: 주식, 암호화폐, 외환 등 다양한 금융 시장에 적용 가능
─────────────────────────────────────
◆ 기술적 기반
■ 방향성 계산
• 기본 원리: 각 캔들의 상승/하락 여부만 카운트하여 방향의 일관성 측정
• 계산 방법: 현재 종가와 이전 종가의 퍼센트 변화를 기준으로 방향 판단
• 방향 값: 상승(+1), 하락(-1), 의미 없는 변화(0)로 단순화
• 평균화: 설정된 기간 동안의 방향 값의 이동평균으로 DCI 산출
■ 노이즈 필터링 메커니즘
• 최소 변화율: 의미 있는 가격 변동으로 인정할 최소 퍼센트 변화
• 필터링 효과: 최소 변화율보다 작은 변동은 방향 계산에서 제외(0으로 처리)
• 신뢰도 향상: 필터링 강도 조절을 통해 다양한 시장 환경에 최적화 가능
─────────────────────────────────────
◆ 실용적 응용
■ 추세 식별 및 전환점 예측
• 상승 추세 초입:
▶ DCI가 0에서 +0.3 사이로 진입할 때
▶ 최근 방향성이 일관되게 상승하기 시작할 때
• 하락 추세 초입:
▶ DCI가 0에서 -0.3 사이로 진입할 때
▶ 최근 방향성이 일관되게 하락하기 시작할 때
• 추세 전환 신호:
▶ DCI가 +0.5에 가까워질 때 (상승 추세 과열, 하락 전환 가능성)
▶ DCI가 -0.5에 가까워질 때 (하락 추세 과열, 상승 전환 가능성)
■ 트레이딩 전략 적용
• 추세 추종 전략:
▶ DCI가 0선을 위로 돌파할 때 매수 고려
▶ DCI가 0선을 아래로 돌파할 때 매도 고려
• 반전 트레이딩:
▶ DCI가 +0.5에 근접할 때 이익실현 또는 매도 포지션 고려
▶ DCI가 -0.5에 근접할 때 매수 포지션 고려
• 다이버전스 확인:
▶ 가격은 상승하나 DCI가 약화될 때 상승 추세 약화 신호
▶ 가격은 하락하나 DCI가 강화될 때 하락 추세 약화 신호
─────────────────────────────────────
◆ 고급 설정 옵션
■ 기간(Length) 설정
• 단기 분석: 5-10일 (빠른 신호, 민감한 반응)
• 중기 분석: 10-20일 (균형 잡힌 신호, 기본 권장)
• 장기 분석: 20-30일 (느린 신호, 장기 추세 식별)
■ 최소 변화율(Minimum % Change) 설정
• 저변동성 시장: 0.05-0.2% (외환 시장에 적합)
• 중변동성 시장: 0.3-0.5% (주식 시장에 적합)
• 고변동성 시장: 0.5-1.0% (암호화폐 시장에 적합)
■ 트레이딩 스타일별 설정
• 스캘핑: 낮은 기간(5-10), 낮은 최소 변화율(0.05-0.1%)
• 데이 트레이딩: 중간 기간(10-15), 중간 최소 변화율(0.2-0.3%)
• 스윙 트레이딩: 높은 기간(15-25), 높은 최소 변화율(0.3-0.5%)
─────────────────────────────────────
◆ 다른 지표와의 시너지
• 이동평균선: DCI가 0선을 돌파할 때 이동평균 교차 확인으로 신호 강화
• RSI: DCI의 추세 방향과 RSI의 과매수/과매도 수준을 결합하여 진입점 확인
• MACD: DCI의 방향성 신호와 MACD의 모멘텀 확인을 결합하여 신뢰도 향상
• 볼린저 밴드: DCI가 ±0.5에 근접할 때 볼린저 밴드 확장/수축 확인으로 변동성 분석
─────────────────────────────────────
◆ 결론
52SIGNAL 방향성 일관성 지수(DCI)는 시장의 방향성을 객관적으로 측정하고 추세의 강도를 시각화하는 강력한 도구입니다. 최소 변화율 설정을 통한 노이즈 필터링은 각자의 트레이딩 성향과 시장 특성에 맞게 조정할 수 있어 최적의 효과를 누릴 수 있습니다. 추세의 초기 단계를 식별하고 과열 구간을 감지하는 능력은 트레이더에게 중요한 진입 및 퇴출 포인트를 제공합니다. 다른 기술적 지표와 함께 사용하면 트레이딩 결정의 신뢰도를 크게 향상시킬 수 있습니다.
─────────────────────────────────────
※ 면책 조항: 과거 성과가 미래 결과를 보장하지 않습니다. 항상 적절한 리스크 관리 전략을 사용하세요.
Trend
52SIGNAL RECIPE EMA Trend ═══ 52SIGNAL RECIPE EMA Trend ═══
◆ Overview
52SIGNAL RECIPE EMA Trend is a powerful visual tool that allows you to instantly grasp market trends without complex chart analysis. It represents the direction and strength of trends through an intuitive color-coding system based on the relative positions of three Exponential Moving Averages (EMAs).
─────────────────────────────────────
◆ Key Features
• Trend Direction and Strength Visualization: Instantly identify trend direction and strength through an intuitive color-coding system
• EMA Relationship Analysis: Analyze the relative positions of short-term, medium-term, and long-term EMAs to determine trend status
• Clean Separate Window Display: Provides clear visual representation in a window separate from the price chart
─────────────────────────────────────
◆ Technical Foundation
52SIGNAL RECIPE EMA Trend utilizes the following three EMAs:
• Short-term EMA (default: 9)
• Medium-term EMA (default: 20)
• Long-term EMA (default: 50)
By analyzing the relative positions of these three EMAs, it determines the following trend states:
■ Intuitive Color-Coding System
• Bullish Trend (Blue Zones)
▶ Bright Blue: Strong bullish trend - Short-term EMA > Medium-term EMA and Short-term EMA > Long-term EMA
▶ Dark Blue: Weak bullish trend - Short-term EMA > Medium-term EMA but Short-term EMA < Long-term EMA
• Bearish Trend (Red Zones)
▶ Bright Red: Strong bearish trend - Short-term EMA < Medium-term EMA and Short-term EMA < Long-term EMA
▶ Dark Red: Weak bearish trend - Short-term EMA < Medium-term EMA but Short-term EMA > Long-term EMA
─────────────────────────────────────
◆ Practical Applications
■ Trend Identification
• Bullish Trend: Blue zones indicate an ongoing bullish trend. Particularly, bright blue zones represent a strong bullish trend with all EMAs aligned.
• Bearish Trend: Red zones indicate an ongoing bearish trend. Bright red zones suggest strong bearish momentum.
• Trend Reversal: When the color changes from blue to red (or vice versa), it indicates that a trend reversal has occurred.
■ Trading Strategy Applications
• Consider Long Positions: When transitioning to blue zones, especially when changing from dark blue to bright blue, consider long positions.
• Consider Short Positions: When transitioning to red zones, especially when changing from dark red to bright red, consider short positions.
• Position Maintenance/Management: Maintain existing positions while the same color persists, and reassess risk management when color intensity changes.
■ Synergy with Other Indicators
52SIGNAL RECIPE EMA Trend is more effective when used alongside these indicators:
• RSI: Verify overbought/oversold conditions to optimize entry points within trends
• Volume Indicators: Validate trend strength through volume confirmation
• Support/Resistance Levels: Analyze with key price levels to determine entry/exit points
• Bollinger Bands: Identify volatility within trends and potential reversal points
─────────────────────────────────────
◆ Customization
You can adjust the following parameters as needed:
• Short-term EMA Length: Decrease for more sensitive reactions, increase for smoother signals
• Medium-term EMA Length: Adjust for medium-term trend perspective
• Long-term EMA Length: Adjust for long-term trend filtering strength
─────────────────────────────────────
◆ Conclusion
52SIGNAL RECIPE EMA Trend is a powerful visualization tool that enables intuitive understanding of market trends. It allows for immediate recognition of trend direction and strength without complex analysis, making it applicable to various trading styles from short-term traders to long-term investors.
This indicator is most effective when used as a tool to visualize trend conditions rather than as an independent trading signal generator. Always use it in conjunction with other technical/fundamental analysis tools to make more robust trading decisions.
─────────────────────────────────────
※ Disclaimer: Past performance does not guarantee future results. Always use appropriate risk management strategies.
═══ 52SIGNAL RECIPE EMA 트렌드 ═══
◆ 개요
52SIGNAL RECIPE EMA 트렌드는 복잡한 차트 분석 없이도 시장 트렌드를 즉시 파악할 수 있는 강력한 시각적 도구입니다. 세 가지 지수 이동 평균선(EMA)의 상대적 위치를 기반으로 한 직관적인 색상 코딩 시스템을 통해 트렌드의 방향과 강도를 표현합니다.
─────────────────────────────────────
◆ 주요 특징
• 트렌드 방향 및 강도 시각화: 직관적인 색상 코딩 시스템을 통해 트렌드 방향과 강도를 즉시 식별
• EMA 관계 분석: 단기, 중기, 장기 EMA의 상대적 위치를 분석하여 트렌드 상태 판단
• 깔끔한 별도 창 표시: 가격 차트와 별도의 창에서 명확한 시각적 표현 제공
─────────────────────────────────────
◆ 기술적 기반
52SIGNAL RECIPE EMA 트렌드는 다음 세 가지 EMA를 활용합니다:
• 단기 EMA (기본값: 9)
• 중기 EMA (기본값: 20)
• 장기 EMA (기본값: 50)
이 세 가지 EMA의 상대적 위치를 분석하여 다음과 같은 트렌드 상태를 결정합니다:
■ 직관적인 색상 코딩 시스템
• 강세 트렌드 (파란색 영역)
▶ 밝은 파란색: 강한 강세 트렌드 - 단기 EMA > 중기 EMA 그리고 단기 EMA > 장기 EMA
▶ 어두운 파란색: 약한 강세 트렌드 - 단기 EMA > 중기 EMA 하지만 단기 EMA < 장기 EMA
• 약세 트렌드 (빨간색 영역)
▶ 밝은 빨간색: 강한 약세 트렌드 - 단기 EMA < 중기 EMA 그리고 단기 EMA < 장기 EMA
▶ 어두운 빨간색: 약한 약세 트렌드 - 단기 EMA < 중기 EMA 하지만 단기 EMA > 장기 EMA
─────────────────────────────────────
◆ 실용적 응용
■ 트렌드 식별
• 강세 트렌드: 파란색 영역은 진행 중인 강세 트렌드를 나타냅니다. 특히 밝은 파란색 영역은 모든 EMA가 정렬된 강한 강세 트렌드를 나타냅니다.
• 약세 트렌드: 빨간색 영역은 진행 중인 약세 트렌드를 나타냅니다. 밝은 빨간색 영역은 강한 약세 모멘텀을 시사합니다.
• 트렌드 반전: 색상이 파란색에서 빨간색으로(또는 그 반대로) 변경되면 트렌드 반전이 발생했음을 나타냅니다.
■ 트레이딩 전략 응용
• 롱 포지션 고려: 파란색 영역으로 전환될 때, 특히 어두운 파란색에서 밝은 파란색으로 변경될 때 롱 포지션을 고려하세요.
• 숏 포지션 고려: 빨간색 영역으로 전환될 때, 특히 어두운 빨간색에서 밝은 빨간색으로 변경될 때 숏 포지션을 고려하세요.
• 포지션 유지/관리: 같은 색상이 지속되는 동안 기존 포지션을 유지하고, 색상 강도가 변경될 때 리스크 관리를 재평가하세요.
■ 다른 지표와의 시너지
52SIGNAL RECIPE EMA 트렌드는 다음 지표들과 함께 사용할 때 더 효과적입니다:
• RSI: 과매수/과매도 상태를 확인하여 트렌드 내 진입 시점 최적화
• 거래량 지표: 거래량 확인을 통한 트렌드 강도 검증
• 지지/저항 레벨: 주요 가격 레벨과 함께 분석하여 진입/퇴출 시점 결정
• 볼린저 밴드: 트렌드 내 변동성과 잠재적 반전 지점 식별
─────────────────────────────────────
◆ 커스터마이징
필요에 따라 다음 매개변수를 조정할 수 있습니다:
• 단기 EMA 길이: 더 민감한 반응을 위해 감소, 더 부드러운 신호를 위해 증가
• 중기 EMA 길이: 중기 트렌드 관점에 맞게 조정
• 장기 EMA 길이: 장기 트렌드 필터링 강도 조정
─────────────────────────────────────
◆ 결론
52SIGNAL RECIPE EMA 트렌드는 시장 트렌드를 직관적으로 이해할 수 있게 해주는 강력한 시각화 도구입니다. 복잡한 분석 없이 트렌드 방향과 강도를 즉시 인식할 수 있어, 단기 트레이더부터 장기 투자자까지 다양한 트레이딩 스타일에 적용할 수 있습니다.
이 지표는 독립적인 트레이딩 신호 생성기보다는 트렌드 상태를 시각화하는 도구로 사용할 때 가장 효과적입니다. 항상 다른 기술적/기본적 분석 도구와 함께 사용하여 더 견고한 트레이딩 결정을 내리세요.
─────────────────────────────────────
※ 면책 조항: 과거 성과가 미래 결과를 보장하지 않습니다. 항상 적절한 리스크 관리 전략을 사용하세요.
[CRTT] Dragon TrendModified Sonic R system based on Wyckoff logic to indicate current trend phase and strength based on the Dragon (EMA34) color.
1. Red : downtrend but the trend strength is weak and can be consider as phase |B| or |D|. Open positions in this color is risk, we should wait more.
2. Green : uptrend but the trend strength is weak and can be consider as phase |B| or |D|. Open positions in this color is risk, we should wait more.
3. Purple : uptrend and the strength of trend is strongly bullish that can be considered as phase |D| or |E| in accumulation phase. This is where we place our Long positions because the trend is strongly bullish and price could continue to run upward.
4. Blue : downtrend and the strength of trend is strongly bearish that can be considered as phase |D| or |E| in distribution phase. This is where we place our Short positions because the trend is strongly bearish and price could continue to run downward.

Adaptive Causal Wavelet Trend FilterThe Adaptive Causal Wavelet Trend Filter is a technical indicator implementing causal approximations of wavelet transform properties for better trend detection with adaptive volatility response.
The Adaptive Causal Wavelet Trend Filter (ACWTF) applies mathematical principles derived from wavelet analysis to financial time series, providing robust trend identification with minimal lag. Unlike conventional moving averages, it preserves significant price movements while filtering market noise through signal processing that i describe below.
I was inspired to build this indicator after reading " Wavelet-Based Trend Identification in Financial Time Series " by In, F., & Kim, S. 2013 and reading about Mexican Hat wavelet filters.
The ACWTF maintains optimal performance across varying market regimes without requiring parameter adjustments by adapting filter characteristics to current volatility conditions.
Mathematical Foundation
Inspired by the Mexican Hat wavelet (Ricker wavelet), this indicator implements causal approximations of wavelet filters optimized for real-time financial analysis. The multi-resolution approach identifies features at different scales and the adaptive component dynamically adjusts filtering characteristics based on local volatility measurements.
Key mathematical properties include:
Non-linear frequency response adaptation
Edge-preserving signal extraction
Scale-space analysis through dual filter implementation
Volatility-dependent coefficient adjustment, which I love
Filter Methods
Adaptive: Implements a volatility-weighted combination of multiple filter types to optimize the time-frequency resolution trade-off
Hull: Provides a causal approximation of wavelet edge detection properties with forward-projection characteristics
VWMA: Incorporates volume information into the filtering process for enhanced signal detection
EMA Cascade: Creates a multi-pole filter structure that approximates certain wavelet scaling properties
Suggestion: try all as they will provide slightly different signals. Try also different time-frames.
Practical Applications
Trend Direction Identification: Clear visual trend direction with reduced noise and lag
Regime Change Detection: Early identification of significant trend reversals
Market Condition Analysis: Integrated volatility metrics provide context for current market behavior
Multi-timeframe Confirmation: Alignment between primary and secondary filters offers additional confirmation
Entry/Exit Timing: Filter crossovers and trend changes provide potential trading signals
The comprehensive information panel provides:
Current filter method and trend state
Trend alignment between timeframes
Real-time volatility assessment
Price position relative to filter
Overall trading bias based on multiple factors
Implementation Notes
Log returns option provides improved statistical properties for financial time series
Primary and secondary filter lengths can be adjusted to optimize for specific instruments and timeframes
The indicator performs particularly well during trend transitions and regime changes
The indicator reduces the need for using additional indicators to check trend reversion

Volume MAs Oscillator | Lyro RSVolume MAs Oscillator | Lyro RS
Overview
The Volume MAs Oscillator is a powerful volume‑adjusted momentum tool that combines custom‑weighted moving averages on volume‑weighted price with smoothed deviation bands. It offers dynamic insights into trend direction, overbought/oversold conditions, and relative valuation — all within a single indicator
Key Features
Volume‑Adjusted Moving Averages: Moving averages can be volume‑weighted using the following formula: a moving average of (Price × Volume) divided by a moving average of Volume. This formula is applied across more than 14 different moving averages; however, it is not used with the VWMA, as VWMA is inherently a volume-weighted moving average.
Percentage Oscillator: Displays the normalized difference: (source – MA) / MA * 100, centered around zero for easy interpretation of strength and direction.
Deviation Bands: Builds upper and lower bands from standard deviation of the oscillator over a selected lookback, with distinct positive/negative multipliers and optional smoothing to reduce noise.
Inputs: Band Length, Band Smoothing, Positive Band Multiplier, Negative Band Multiplier.
Multi‑Mode Signal System:
1. Trend Mode – Colors oscillator according to breaks above (bullish) or below (bearish) respective bands.
2. Reversion Mode – Inverses color logic: signals overextensions beyond bands as reversion opportunities, greys inside the bands.
3. Valuation Mode – Applies a gradient color scale (UpC ⇄ DnC) to reflect relative valuation strength.
Customizable Visuals: Select from 5 pre‑set palettes—Classic, Mystic, Major Themes, Accented, Royal—or define your own custom bullish/bearish colors.
Chart enhancements include color‑coded oscillator line, deviation bands, glow‑effect midline at zero, background shading and candlestick/bar coloring aligned to signal mode.
Built‑In Signals: Automatically plots ▲ oversold and ▼ overbought markers upon crosses of lower/upper bands (in trend or reversion modes), enhancing signal clarity.
How It Works
MA Calculation – Applies the selected MA type to price × volume (normalized by MA of volume) or direct VWMA.
Oscillator Output – Calculates the % difference of source vs. derived MA.
Band Construction – Computes rolling standard deviation; applies user‑defined multipliers; smooths bands with exponential blending.
Mode-Dependent Coloring & Signals –
• Trend: Highlights strength trends via band cross coloring.
• Reversion: Flags extremes beyond bands as potential pullbacks.
• Valuation: Uses gradient to reflect oscillator’s position relative to recent range.
Signal Markers – Deploys arrows and color rules to flag overbought (▼) or oversold (▲) conditions when bands are breached.
Practical Use
Trend Confirmation – In Trend Mode, use upward price_diff cross above upper band as bullish; downward cross below lower band as bearish.
Mean Reversion – In Reversion Mode, fading extremes beyond bands may precede a retracement.
Relative Valuation – Valuation Mode shines when assessing how extended price_diff is, with gradient colors indicating valuation zones.
Bars/candles color‑coded to oscillator state boosts clarity of market tone and allows for rapid visual scanning.
Customization
Adjust MA type/length to tune responsiveness vs. smoothing.
Configure band settings for volatility sensitivity.
Toggle between signal modes for trend-following or reversion strategies.
Stylish visuals: pick or customize color schemes to match your chart setup.
⚠️Disclaimer
This indicator is a tool for technical analysis and does not provide guaranteed results. It should be used in conjunction with other analysis methods and proper risk management practices. The creators of this indicator are not responsible for any financial decisions made based on its signals.

TradersAID - Adaptive Smoothing Velocity ColoringTradersAID – Adaptive Smoothing Velocity Coloring
1. Overview
TradersAID – Adaptive Smoothing Velocity Coloring is a momentum visualization tool designed to highlight bullish or bearish pressure directly on price bars — helping you intuitively read directional strength and velocity shifts in any market or timeframe.
Using a Kalman-inspired estimation framework originally developed for aerospace and autonomous navigation, this tool analyzes the velocity of price movement and assigns a contextual candle color — offering a clean and readable way to interpret short-term flow.
Whether you’re navigating ranges or watching for trend continuation, this visualization simplifies complex data into actionable visual rhythm.
2. What It Does
Instead of measuring only price, the script focuses on price velocity — the rate of change over time. It computes this through a proprietary estimator that continuously adapts to volatility and momentum shifts.
The output is color-coded candles that reflect velocity dynamics:
• Green shades represent bullish acceleration
• Red shades reflect bearish velocity
• Neutral tones indicate fading momentum or transition phases
This allows you to quickly assess market tone:
• In strong trends: Watch for fading momentum (weaker colors)
• In ranges: Spot subtle shifts that hint at upcoming breakout direction
• Near potential reversals: Diverging velocity and price can stand out at a glance
3. How to Use It
• Momentum Insight:
Use color intensity to judge whether the current move is gaining or losing strength.
• Breakout Anticipation:
In sideways markets, shifting colors within the range can help anticipate which side may take control next.
• Divergence Reading:
Look for double tops or bottoms where price holds but velocity changes — often a hint that the move is maturing.
• Visual Confirmation Layer:
Combine with structural tools (like TradersAID Warning Dots or Trend Bands) to add a layer of momentum awareness.
4. Key Features
• Adaptive Velocity Model: Kalman-filter-like algorithm continuously tracks price velocity
• Gradient Candle Coloring: Smooth scale from deep red (strong bearish) to deep green (strong bullish)
• Flexible Sensitivity Modes:
o Slow – smoothest interpretation
o Regular – balanced tone
o Fast – more responsive
• RSI Normalization: Translates raw velocity into a familiar oscillator scale
• Full Overlay Integration: Candle coloring works seamlessly with other studies on the same chart
5. Technical Basis (Why It’s Closed Source)
The tool is built on a proprietary Unscented Kalman Filter implementation that estimates both price and its velocity simultaneously.
This advanced approach is rare in retail tools, drawing from real-time estimation techniques used in robotics and aerospace applications.
While the source remains closed to protect the performance logic and smoothing implementation, the core concepts — adaptive filtering, velocity-based analysis, and visual gradient output — are fully explained here for transparency and compliant understanding.
6. Settings
• Sensitivity Modes: Fast / Regular / Slow
• RSI Length: Adjustable to control the smoothness of velocity normalization
• Color Theme: Intuitive gradient from red (bearish) to green (bullish)
• Compatible Timeframes: Designed to work across all timeframes — no restriction
7. Disclaimer
This tool is for educational and informational purposes only. It does not offer financial advice, predict outcomes, or generate trading signals. Always use in conjunction with your own analysis and supporting systems.
Traders AID / Adaptive Smoothing Line (use on 1-week TF)TradersAID – Adaptive Smoothing Line (use on 1-week TF)
1. Overview
TradersAID – Adaptive Smoothing Line is a trend-following overlay designed to bring structure to noisy markets — especially on the 1-week chart, where clarity is crucial.
Instead of using conventional moving averages, this tool applies a Kalman-inspired smoothing method that adapts to changing price behavior.
Originally used in fields like robotics and autonomous driving, this filtering concept helps track directional flow without overreacting to minor fluctuations — making it easier to identify sustained moves or exhaustion patterns.
2. What It Does
The line continuously adapts to current market conditions by filtering volatility and directional flow through an internal estimator logic.
Unlike laggy moving averages, it does not simply average past prices — it adjusts dynamically based on how price behaves.
Key behaviors include:
• Directional slope that reflects trend strength
• Increased sensitivity during acceleration phases
• Stabilized flattening during sideways periods
This makes the trend easier to follow without being distracted by short-term chop.
3. How to Use It
• Trend Interpretation:
Use the line’s angle to judge momentum. Steep slopes show conviction, while flattening may signal transition or fading strength.
• Support & Resistance Context:
During trending phases, the line often acts as dynamic support or resistance — especially when combined with other tools.
• Volatility Filtering:
In consolidation, the line becomes smoother, helping reduce noise and simplify your view of structure.
• Layering Tool:
Use it as a visual foundation beneath more reactive tools like TradersAID Warning Dots or Velocity Coloring to stay grounded in context.
4. Key Features
• Adaptive Behavior: Responds to both price and volatility
• Three Modes:
o Slow for structure clarity
o Regular for balanced responsiveness
o Fast for shorter-term context
• Overlay Design: Plots directly on price for seamless interpretation
• Minimalist Output: Clean, unobtrusive line — no clutter
5. Technical Basis (Why It’s Closed Source)
This tool uses a custom smoothing technique based on Kalman-inspired logic, tuned specifically for longer-term trend structure.
While not a full Kalman implementation, the core idea is drawn from systems that track state under uncertainty — offering stability without lagging behind price.
The algorithm adapts continuously to live market input, producing a smooth yet responsive curve that reflects trend direction and change in a visually intuitive way.
As this smoothing mechanism is not available in open-source scripts and is part of a broader proprietary system, the code remains closed to protect its originality and performance edge.
6. Settings
• Mode Selection: Fast / Regular / Slow
• Styling Controls: Color, line width, smoothing curve
• Frame Lock:
✅ This tool is designed to work exclusively on the 1-week timeframe.
7. Disclaimer
This script is for educational and informational purposes only. It does not provide financial advice or generate trading signals. Use with your own judgment and supporting tools.
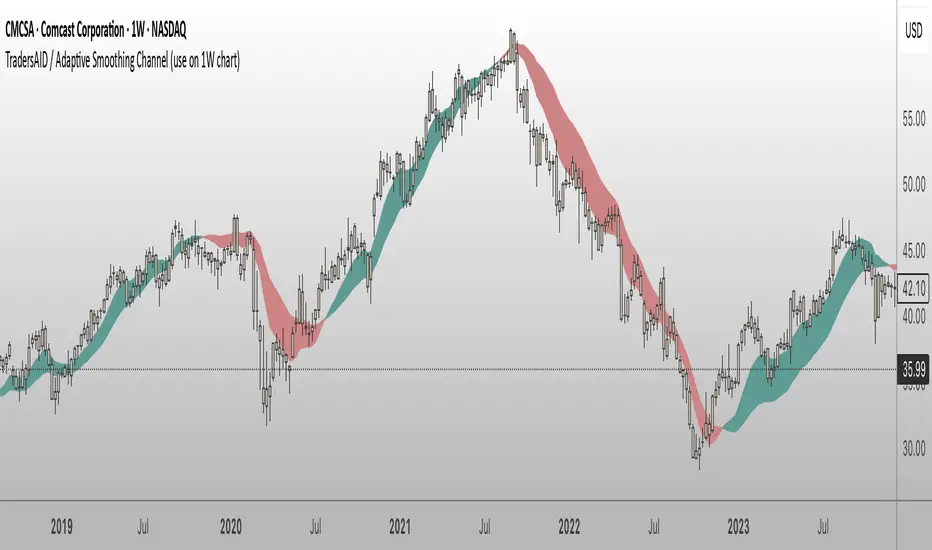
TradersAID / Adaptive Smoothing Channel (use on 1W chart)TradersAID – Adaptive Smoothing Channel (use on 1-Week chart)
Overview
TradersAID – Adaptive Smoothing Channel is a two-line price overlay designed to help traders interpret trend structure and shifting momentum zones on the 1-week chart only.
Unlike traditional moving averages or fixed smoothing methods, this tool uses an adaptive approach inspired by Kalman filtering — a concept widely used in robotics and control systems to track signals in noisy environments. Applied to price, this allows the band to adapt to directional flow and volatility while filtering out distracting short-term fluctuations.
1.What It Does
This tool builds a dynamic corridor around price using:
• A faster line that follows near-term directional movement
• A slower line that anchors broader market structure
Together, they form a responsive band that:
• Tilts with trend direction (via slope)
• Expands or contracts with volatility
• Fills the space between to show directional rhythm
It’s especially useful for observing how price moves within sustained trends or compression zones, helping traders visually interpret market structure with more clarity.
2. How to Use It
• Trend Structure:
Follow the slope of the band to understand overall direction. A narrowing band may indicate consolidation; a widening band may reflect strong follow-through.
• Momentum Compression Zones:
Watch for tightening distance between the lines — this may signal the market is preparing for a structural transition or breakout.
• Clarity Layer:
Overlay this tool with others (e.g. TradersAID Warning Dots) to reduce noise and improve decision context.
3. Key Features
• Dual Adaptive Lines: One fast, one slow — capturing different time dynamics
• Shaded Fill Zone: Highlights directional bias and rhythm
• 3 Reaction Modes: Slow / Regular / Fast for different sensitivities
• Overlay Style: Plots directly on price
• Minimalist Layout: Clean visual language
4. Technical Basis (Why It’s Closed Source)
This tool is based on a custom smoothing logic inspired by Kalman filtering, adapted specifically for charting market structure.
While it does not replicate a full Kalman system, it borrows key principles: dynamically adjusting to noisy input while maintaining structural clarity.
The algorithm was developed internally to provide a visual layer that integrates into the broader TradersAID analysis system — offering something distinct from public indicators. Its behavior, flexibility, and integration were designed to serve advanced structural analysis, and as such, the script is closed to protect proprietary logic and intellectual property.
5. Settings
• Mode Selector: Fast / Regular / Slow
• Color Fill Toggle & Styling
• Frame Lock:
✅ This script is built to work exclusively on the 1-week timeframe.
6. Disclaimer
This tool is for educational and informational purposes only. It does not offer financial advice or generate trading signals. Always use with your own strategy and discretion.
Volatility & Market Regimes [AlgoXcalibur]Analyze Market Conditions Like a Pro.
Volatility & Market Regimes is a specialized, institution-inspired indicator designed to help traders instantly identify the current conditions of the market with clarity and confidence.
By combining a real-time Volatility Histogram and Strength Line with a compact Regime Table, this tool reveals four essential market dimensions—Volatility, Strength, Participation, and Noise—in a clean and intuitive format. Whether you’re confirming trade setups or managing risk, knowing the current regimes enhances awareness across all assets and timeframes.
🧠 Algorithm Logic
This sophisticated tool continuously monitors four independent regimes, each reflecting a distinct dimension of market behavior:
• Volatility – Gauges how active or dormant the market is by comparing current price action movement to historical averages. A dynamic, color-gradient Volatility Histogram transitions from Low (ice blue/white) to Medium (green/yellow) to High (orange/red), giving you an immediate assessment of volatility and risk.
• Strength – Measures directional intensity by assessing trend momentum, pressure, and persistence. A color-gradient Strength Line ranges from weak (red) to strong (green), helping traders determine if directional strength is trending, weakening, or consolidating.
• Participation – Analyzes relative volume to assess the level of trader engagement. Higher volume indicates stronger participation and conviction, while low volume may signal uncertainty, fading momentum, or even liquidity traps.
• Noise – Evaluates structural stability by measuring how orderly or chaotic the price action is. High noise suggests choppy, unstable conditions, while low noise reflects clean, stable moves.
Each regime includes a High / Medium / Low classification and a color-coded directional arrow to indicate whether condition parameters are increasing or decreasing. Together, these components deliver real-time market context—helping you stay grounded in logic, not emotion.
⚙️ User-Selectable Features
Each component of the indicator—the Volatility Histogram, Strength Line, and Regime Table—can be independently made visible or hidden to match your preference. This flexibility allows you to display only the Regime Table and move it directly to your main chart, where it auto-positions to the center-right and integrates seamlessly with other AlgoXcalibur indicators that also use data tables for a cohesive and refined experience.
📊 Clarity, Not Guesswork
Volatility & Market Regimes is a unique, institution-inspired algorithm rarely seen in retail trading. Not only does it clearly display volatility—it translates complex market behavior into a clear context to reveal what’s happening behind the candles. By decoding core regimes in real-time, this tool transforms uncertainty into structured insight—empowering traders to act with clarity, not guesswork.
🔐 To get access or learn more, visit the Author’s Instructions section.

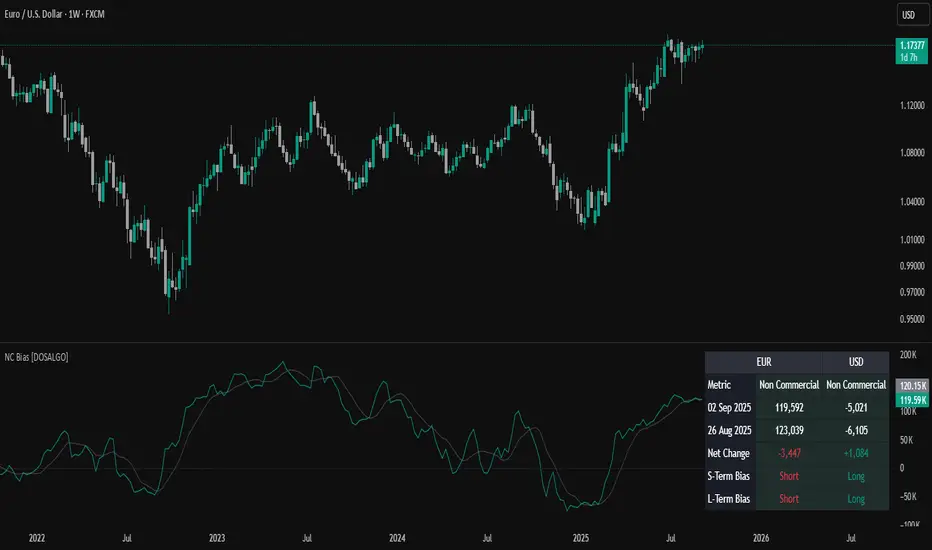
Non-Commercial Bias TrackerNon-Commercial Bias Tracker
Overview
The Non-Commercial Bias Tracker is a sophisticated sentiment analysis tool designed to provide traders with a clear view of the positioning of institutional speculators in the futures market. By analyzing the weekly Commitment of Traders (COT) report, this indicator helps you understand the underlying bias of large market participants for a wide range of assets, including forex, commodities, and indices.
The primary goal of this tool is to identify the prevailing trend in market sentiment and alert you to significant shifts in that trend, allowing you to align your strategy with the flow of institutional money.
Key Features
Dual Asset Analysis: Automatically detects the two assets in a trading pair (e.g., EUR and USD in EURUSD) or a single asset (e.g., GOLD) and displays their sentiment data side-by-side.
Comprehensive Data Table: A clean, customizable dashboard shows you the most critical sentiment metrics at a glance, including the current Net Position, the Change %, and the Overall Bias.
Visual Sentiment Plot: The indicator plots the primary sentiment metric and its signal line, giving you a visual representation of momentum and trend.
Clear Bias-Shift Signals: Green and red circles appear directly on the plot to highlight the exact moment the underlying sentiment momentum shifts, providing clear and timely signals.
How to Use the Indicator
Important Note: The Commitment of Traders data is released weekly. For the most accurate and meaningful signals, it is strongly recommended to use this indicator on the Weekly (W) chart timeframe.
1. The Data Table
The table in the corner of your screen is your main dashboard. Here’s what each row means:
Net Position: Shows the net difference between long (bullish) and short (bearish) contracts held by non-commercial traders. A positive number indicates a net long position; a negative number indicates a net short position.
Change %: This is the primary metric used for analysis, representing the net sentiment as a percentage.
Overall Bias: This is the final output of the indicator's analysis. It provides a clear "Long" or "Short" signal based on the current sentiment momentum. This cell is color-coded for quick interpretation (Green for Long, Red for Short).
2. The Chart Plots
Blue Line: Represents the current sentiment metric ("Change %" or "Net Position %").
Orange Line: Represents the signal line, or the average sentiment over a specific period.
Crossover Signals:
A Green Circle appears when the blue line crosses above the orange line, signaling a shift to a Long Bias.
A Red Circle appears when the blue line crosses below the orange line, signaling a shift to a Short Bias.
Settings & Customization
You can tailor the indicator to your specific needs via the Settings menu:
Data Source: Choose between "Futures Only" or the combined "Futures and Options" data.
Metric Type: Select whether to analyze the market using "Change %" (for momentum) or "Net Position %" (for conviction).
Bias Signal Line Length: Adjust the sensitivity of the crossover signals. A shorter length is faster, while a longer length provides smoother, more confirmed signals.
Style Settings: Customize the position of the data table and the color of the text to match your chart theme.
Disclaimer: This indicator is a tool for analysis and should not be considered as direct financial advice. All trading involves risk. Always use proper risk management and conduct your own due diligence before making any trading decisions.
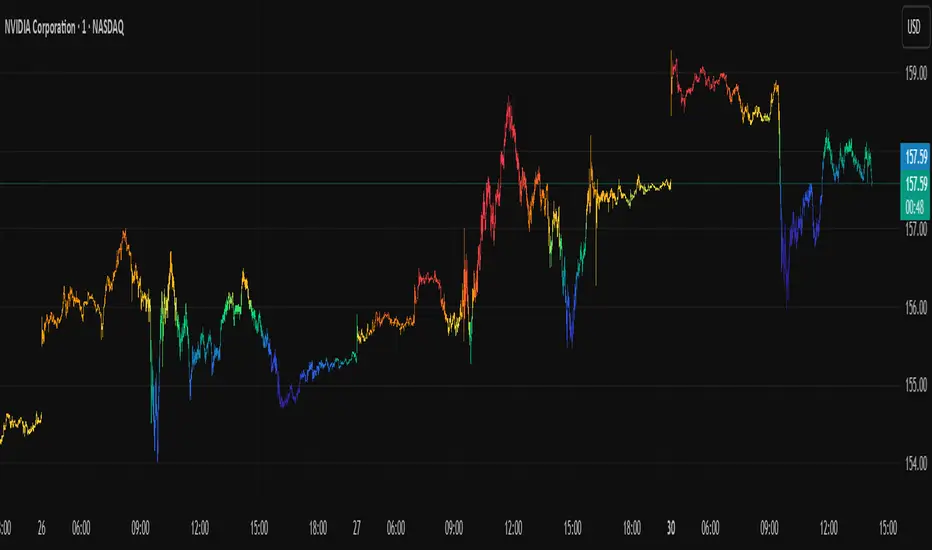
Icy-Hot Visual Indicator [SciQua]🧊 Icy-Hot Visual Indicator
This indicator colors your price bars and/or chart background based on a normalized & smoothed transform of any price-based input (default: close). It gives you a quick “temperature map” of market momentum or volatility—cool blues for low readings, hot reds for high readings—without cluttering your chart.
🔍 Key Features
1. Dual Visual Layers
Candle Gradient: Applies a smooth, multi-color gradient to candle bodies and wicks based on normalized, smoothed input data
Background Gradient: Adds a semi-transparent gradient behind the candles to highlight broader trend zones or volatility regimes
2. Advanced Customization
Normalization Types: bounded, unbounded, z-score, MAD, percentile, sigmoid, tanh, rank, robust, and more
Smoothing Methods: EMA, SMA, WMA, RMA, HMA, TEMA, VWMA, Gaussian, LinReg, ExpReg, and others (12+ options)
3. Gradient Control: Choose 2–7 color stops, reverse direction, adjust display length
Flexible Source Inputs
Use any built-in price series (close, hl2, volume, etc.)
Feed outputs from external indicators (RSI, custom oscillators, moving averages) into either layer
❓How It Works
Inputs are normalized (z-score, bounded, etc.) then smoothed (EMA, LinReg, etc.) in the order you choose. The result is clamped to 0–1 and passed through a multi-stop gradient engine for precise color mapping.
✨ What Makes It Original
While many indicators apply colors or smoothing, this script combines multi-stage normalization, adaptive smoothing, and a modular gradient rendering engine in a highly customizable dual-layer system. It’s built using proprietary functions from the SciQua suite that are not available in public libraries and allow for advanced visual encoding without relying on alerts, signals, or extra panes.
This makes it original in both design and execution—offering a visual-first approach with unique depth, clarity, and flexibility.
🔐 Why This Script Is Closed-Source
While the underlying functions are published in the open-source SciQua library, this indicator’s specific implementation, configuration architecture, and visual behavior are proprietary. It combines multiple library utilities into a dual-layer adaptive system that handles advanced gradient rendering, multi-stage normalization, and smoothing pipelines in a unique way.
The source is closed to protect the design logic, interface abstraction, and fine-tuned behaviors that make this indicator commercially valuable. The building blocks are open to the Pine community, but this assembled product is not meant for replication or redistribution.
How to Use It
1. Highlight Trend Strength
Source: RSI percentile
Setup: 200-bar look-back, mild smoothing
Result: Warm tones when momentum is peaking; cool when it’s fading. Use as a quick filter for entries in the direction of the trend.
2. Visualize Volatility Regimes
Source: ATR or True Range
Setup: Bounded normalization with tighter smoothing bar color off, bg color on.
Result: Background bands that shade when volatility spikes. Helps you avoid low-volatility breakouts or throttle position sizing in choppy markets.
3. Combine with Other Indicators
Source: Output of your custom indicator (e.g., a Keltner Band width)
Setup: Match normalization period to your strategy’s timeframe
Result: Bars colored by your own logic—no extra panes, just enhanced candles.
4. Background Only Heatmap
Turn off bar coloring and dial in semi-transparent background shades—keeps candles crisp while still giving you a context heat-map behind price.
TrendBoxThis indicator is called "TrendBox," designed to help traders analyze daily price ranges using several technical indicators. Below is a breakdown of its functionality, purpose, and key components:
Purpose
The script overlays indicators on a chart to assess whether the price is above or below key levels and moving in a trend.
VIX-based expected range (index fund targeted)
- This helps calculate the expected dealers range based on VIX implications. You can expect to see ranges be bought on and sold on. Moving outside this range creates heightened volatility and most of the time a gamma squeeze follows.
VWAP (Volume Weighted Average Price)
- This allows you to understand the mid point or average pricing of the daily session. If you're paying a premium or getting a discount on the daily session.
Daily Market Open
- Identifying the market open price is a key level on a daily session and allows you to identify some level of intraday trend.
Daily 4-period VWMA
- This is a crucial role of our indicator and showing short term time frame bias. Seeing price move over the top of our daily 4 level establishes a short term trend and can be used as a distribution guide, closing positions when we see longer time frame candles close under it. Vice versa for shorting.
It also displays a status box (optional) summarizing whether the price is above or below these levels, helping traders quickly evaluate market conditions.

Market Shift Levels [ChartPrime]Market Shift Levels
This indicator detects trend shifts and visualizes key market structure turning points using Hull Moving Average logic. It highlights potential areas of support and resistance where price is likely to react, empowering traders to spot early trend transitions.
Market Shift Levels are horizontal zones that mark the moment of a directional change in market behavior. These shifts are based on crossovers between two smoothed Hull Moving Averages (HMA), allowing the indicator to detect potential reversals with minimal lag.
Once a shift is detected:
A dashed horizontal Market Shift Level is plotted at the low (for bullish shift) or high (for bearish shift) of the candle.
These levels often become key reaction points during pullbacks and trend retests.
Volume or price labels are added when price wicks into these levels, helping traders gauge the strength of rejection or acceptance.
⯁ KEY FEATURES
Uses HMA-based logic to detect when price momentum shifts.
Plots clean Market Shift Levels (MSLs) that act as dynamic support and resistance.
Automatically colors bars and candles based on the price positioning relative to levels.
Labels wick-based retests with either:
Volume data of the 3-bar cluster (default).
Price level if toggled.
⯁ HOW TO USE
Look for trend shifts where the HMA crossover triggers a new level — this marks a possible structural pivot .
Use the horizontal level as a dynamic support or resistance zone — especially when price returns with wick rejections.
Watch for volume labels near the level — higher values signal stronger rejection and potential continuation.
Combine with confluence tools like Smart Money concepts or Fibonacci levels for added edge.
⯁ EXAMPLE SETUPS
After a bullish shift, wait for price to return and wick into the level — if volume spikes and candle closes strong, it’s a retest confirmation entry .
After a bearish shift, bearish wick rejections with volume may signal short re-entry zones .
⯁ CONCLUSION
The Market Shift Levels indicator offers a visual and data-backed approach to spotting trend reversals and critical retest zones. It’s a simple yet powerful tool to structure your trades around objective, repeatable market behavior — all in real-time.

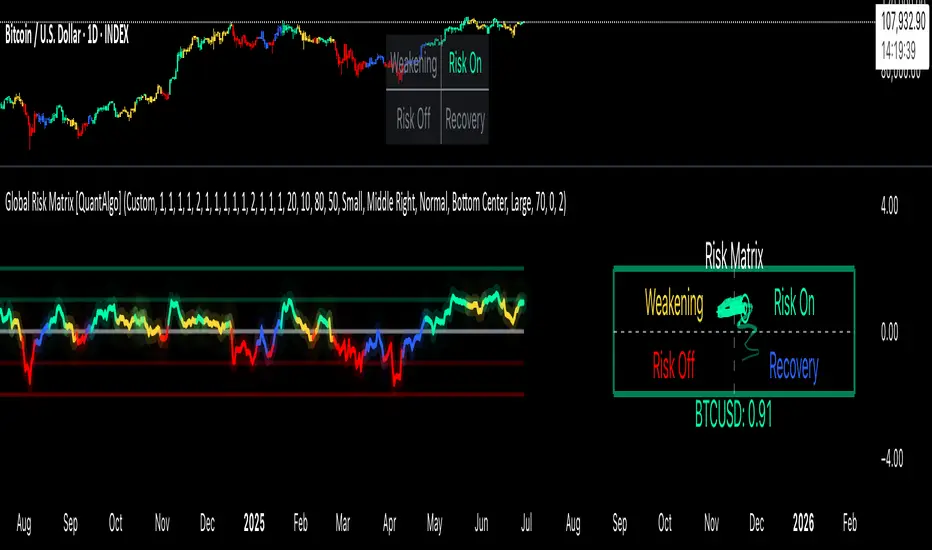
Global Risk Matrix [QuantAlgo]🟢 Overview
The Global Risk Matrix is a comprehensive macro risk assessment tool that aggregates multiple global financial indicators into a unified risk sentiment framework. It transforms diverse economic data streams (from currency strength and liquidity measures to volatility indices and commodity prices) into standardized Z-Score readings to identify market regime shifts across risk-on and risk-off conditions.
The indicator displays both a risk oscillator showing weighted average sentiment and a dynamic 2D matrix visualization that plots signal strength against momentum to reveal current market phase and historical evolution. This helps traders and investors understand broad market conditions, identify regime transitions, and align their strategies with prevailing macro risk environments across all asset classes.
🟢 How It Works
The indicator employs Z-Score normalization across various global macro components, each representing distinct aspects of market liquidity, sentiment, and economic health. Raw data from sources like DXY, S&P 500, Fed liquidity, global M2 money supply, VIX, and commodities undergoes statistical standardization. Several components are inverted (USDT.D, DXY, VIX, credit spreads, treasury bonds, gold) to align with risk-on interpretation, where positive values indicate bullish conditions.
This unique system applies configurable weights to each component based on selected asset class presets (Crypto Investor/Trader, Stock Trader, Commodity Trader, Forex Trader, Risk Parity, or Custom), creating a weighted average Z-Score. It then analyzes both signal strength and momentum direction to classify market conditions into four distinct phases: Risk-On (positive signal, rising momentum), Risk-Off (negative signal, falling momentum), Recovery (negative signal, rising momentum), and Weakening (positive signal, falling momentum). The 2D matrix visualization plots these dimensions with historical trail tracking to show regime evolution over time.
🟢 How to Use
1. Risk Oscillator Interpretation and Phase Analysis
Positive Territory (Above Zero) : Indicates risk-on conditions with capital flowing toward growth assets and higher risk tolerance
Negative Territory (Below Zero) : Signals risk-off sentiment with capital seeking safety and defensive positioning
Extreme Levels (±2.0) : Represent statistically significant deviations that often precede regime reversals or trend exhaustion
Zero Line Crosses : Mark critical transitions between risk regimes, providing early signals for portfolio rebalancing
Phase Color Coding : Green (Risk-On), Red (Risk-Off), Blue (Recovery), Yellow (Weakening) for immediate regime identification
2. Risk Matrix Visualization and Trail Analysis
Current Position Marker (⌾) : Shows real-time location in the risk/momentum space for immediate situational awareness
Historical Trail : Connected path showing recent market evolution and regime transition patterns
Quadrant Analysis : Risk-On (upper right), Risk-Off (lower left), Recovery (lower right), Weakening (upper left)
Trail Patterns : Clockwise rotation typically indicates healthy regime cycles, while erratic movement suggests uncertainty
3. Pro Tips for Trading and Investing
→ Portfolio Allocation Filter : Use Risk-On phases to increase exposure to growth assets, small caps, and emerging markets while reducing defensive positions during confirmed green phases
→ Entry Timing Enhancement : Combine Recovery phase signals with your technical analysis for optimal long entry points when macro headwinds are clearing but prices haven't fully recovered
→ Risk Management Overlay : Treat Weakening phase transitions as early warning systems to tighten stop losses, reduce position sizes, or hedge existing positions before full Risk-Off conditions develop
→ Sector Rotation Strategy : During Risk-On periods, favor cyclical sectors (technology, consumer discretionary, financials) while Risk-Off phases favor defensive sectors (utilities, consumer staples, healthcare)
→ Multi-Timeframe Confluence : Use daily matrix readings for strategic positioning while applying your regular technical analysis on lower timeframes for precise entry and exit execution
→ Divergence Detection : Watch for situations where your asset shows bullish technical patterns while the matrix shows Risk-Off conditions—these often provide the highest probability short opportunities and vice versa
Trend Direction (OTC)Trend Direction (OTC)
Welcome, and thank you for your interest in the Trend Direction (OTC) indicator. This is a private, invite-only tool designed to provide a clear and objective view of market structure and trend dynamics.
Overview
The primary goal of Trend Direction (OTC) is to declutter your charts and help you visually identify the prevailing market trend through a sophisticated analysis of swing points. By automatically plotting key structural points in the market, it helps traders see the bigger picture and make more informed decisions based on classic price action principles.
This indicator is suitable for all markets (Forex, Crypto, Stocks, Indices) and works on any timeframe.
Features
Intelligent Swing Detection: Automatically identifies and plots significant market swing points.
Market Structure Labels (HH, LL, LH, HL): Get instant context on the trend's health. The indicator clearly labels swing points as Higher Highs (HH), Lower Lows (LL), Lower Highs (LH), and Higher Lows (HL), allowing you to see trend continuation and potential reversals at a glance.
Trend Dashboard: A simple, color-coded dashboard in the corner of your chart provides a real-time assessment of the trend, classifying it as "Confirmed," "Unconfirmed". This helps filter out market noise and provides an extra layer of confirmation.
Customizable Display: You have full control over the visual elements.
Adjust the sensitivity of the swing detection to focus on either short-term or long-term trends.
Toggle the visibility of trend lines and labels.
Limit the number of historical swings shown on the chart to keep your workspace clean.
Customize all colors to match your chart's theme.
How to Use
The Trend Direction (OTC) indicator is designed to be intuitive. Here’s a simple guide to interpreting its signals:
Identifying an Uptrend: Look for a consistent series of HH (Higher Highs) and HL (Higher Lows). The dashboard will likely show a "Bullish" status. A break of this pattern (e.g., the formation of an LH or LL) could signal a potential change in trend.
Identifying a Downtrend: Look for a consistent series of LH (Lower Highs) and LL (Lower Lows). The dashboard will likely show a "Bearish" status. A break of this pattern (e.g., the formation of an HL or HH) could signal that the downtrend is weakening.
Ranging or Choppy Markets: In sideways markets, you will see an alternating series of swings without clear direction. The dashboard will likely read "Neutral" or flip between "Unconfirmed" states. This can be useful for avoiding low-probability setups.
Settings
Swing Detection:
Pivot Lookback: The core setting for sensitivity. Higher values = less sensitive (major swings). Lower values = more sensitive (minor swings).
Display Options:
Show Swing Labels: Toggles the HH/LL/etc. labels.
Show Trend Lines: Toggles the zig-zag lines connecting the swings.
Show Last Swings: Set to 0 to see all historical swings, or enter a number to see only the most recent ones.
Color Settings: Customize the colors of all lines and labels to your preference.
Disclaimer: The Trend Direction (OTC) indicator is a tool for analysis and should not be considered financial advice. It is designed to assist in your trading decisions, not to make them for you. Always use proper risk management. Past performance is not indicative of future results.

Aqua MTF Trend Oscillator——————————————————————————————————————————————————————————
The Aqua Multi-Timeframe (MTF) Trend Oscillator is a comprehensive momentum and trend analysis tool designed to synthesize
complex market dynamics into a single, intuitive oscillator. It moves beyond single-timeframe analysis by aggregating
trend information from up to five distinct, user-configurable sources—spanning different timeframes, symbols, and
moving average types.
--- CORE CONCEPT ---
The strength and direction of a trend are rarely uniform across all market perspectives. This indicator's core
principle is to quantify and weigh the trend's character from multiple angles simultaneously. By blending these
perspectives, it generates a composite score that reflects the overall "consensus" of trend momentum, providing
a more robust view than any single moving average could offer alone.
--- METHODOLOGY ---
The indicator's power lies in its sophisticated, multi-step normalization process for each analysis slot:
1. **MA Calculation:** A standard moving average (e.g., EMA, SMA) is calculated for the specified source, symbol, and timeframe.
2. **Volatility-Normalized Distance:** It first measures the deviation of price from its moving average in terms
of Average True Range (ATR) units. This volatility-normalization step is crucial for comparing trend strength
across different timeframes or instruments, as it measures distance in a context-aware manner.
3. **Magnitude Squashing:** This ATR-based distance is then passed through a hyperbolic tangent (`tanh`) squashing
function. This elegantly transforms the potentially unbounded measurement into a standardized score oscillating
between -1 (maximum bearish magnitude) and +1 (maximum bullish magnitude). This prevents extreme outliers in one
timeframe from disproportionately skewing the final result.
4. **Weighted Aggregation:** Each of these normalized (-1 to +1) scores is then combined based on a user-defined
weight. The weighted average of all enabled slots produces the final composite score.
5. **Final Scaling & Smoothing:** The composite score is scaled to oscillate between -100 and +100. An optional
final smoothing pass can be applied to this master line to reduce noise and clarify the overall trend.
All higher-timeframe calculations are performed correctly within their native context to ensure the indicator is
non-repainting and provides a stable, reliable output on the chart.
--- KEY FEATURES ---
• **Five Independent Analysis Slots:** Fully customize up to five sources, each with its own symbol, timeframe, MA type, period, and weight.
• **Advanced Normalization:** Utilizes ATR and the hyperbolic tangent function for robust, comparable trend magnitude scores.
• **Correct MTF Calculation:** Employs best practices for non-repainting data requests, ensuring historical and real-time results are consistent.
• **Weighted Composite Score:** Assign importance to different timeframes to tailor the oscillator to your specific analytical needs.
• **Optional Master Smoothing:** Apply a final MA to the composite score line for enhanced clarity and signal filtering.
• **Clear Visualization:** A simple, color-coded oscillator line shows the final trend score, while individual component trends can also be plotted.
--- HOW TO INTERPRET ---
• **Zero Line Cross:** A cross above 0 indicates that the weighted balance of trend components has shifted to bullish. A cross below 0 signals a shift to bearish.
• **Oscillator Magnitude:** Values approaching +100 suggest a strong, broad-based uptrend consensus. Values nearing -100 indicate a strong downtrend consensus.
• **Slope:** The slope of the oscillator line indicates the accelerating or decelerating nature of the aggregate trend momentum.
• **Divergence:** As with any oscillator, watch for divergences between price action and the oscillator, which can signal a potential exhaustion of the prevailing trend.
Author: Aquaritek
——————————————————————————————————————————————————————————

Step Channel Momentum Trend [ChartPrime]OVERVIEW
Step Channel Momentum Trend is a momentum-based price filtering system that adapts to market structure using pivot levels and ATR volatility. It builds a dynamic channel around a stepwise midline derived from swing highs and lows. The system colors price candles based on whether price remains inside this channel (low momentum) or breaks out (strong directional flow). This allows traders to clearly distinguish ranging conditions from trending ones and take action accordingly.
⯁ STRUCTURAL MIDLNE (STEP CHANNEL CORE)
The midline acts as the backbone of the trend system and is based on structure rather than smoothing.
Calculated as the average of the most recent confirmed Pivot High and Pivot Low.
The result is a step-like horizontal line that only updates when new pivot points are confirmed.
This design avoids lag and makes the line "snap" to recent structural shifts.
It reflects the equilibrium level between recent bullish and bearish control.
This unique step logic creates clear regime shifts and prevents noise from distorting trend interpretation.
⯁ DYNAMIC VOLATILITY BANDS (ATR FILTERING)
To detect momentum strength, the script constructs upper and lower bands using the ATR (Average True Range):
The distance from the midline is determined by ATR × multiplier (default: 200-period ATR × 0.6).
These bands adjust dynamically to volatility, expanding in high-ATR environments and contracting in calm markets.
The area between upper and lower bands represents a neutral or ranging market state.
Breakouts outside the bands are treated as significant momentum shifts.
This filtering approach ensures that only meaningful breakouts are visually emphasized — not every candle fluctuation.
⯁ MOMENTUM-BASED CANDLE COLORING
The system visually transforms price candles into momentum indicators:
When price (hl2) is above the upper band, candles are green → bullish momentum.
When price is below the lower band, candles are red → bearish momentum.
When price is between the bands, candles are orange → low or no momentum (range).
The candle body, wick, and border are all colored uniformly for visual clarity.
This gives traders instant feedback on when momentum is expanding or fading — ideal for breakout, pullback, or trend-following strategies.
⯁ PIVOT-BASED SWING ANCHORS
Each confirmed pivot is plotted as a label ⬥ directly on the chart:
They also serve as potential manual entry zones, SL/TP anchors, or confirmation points.
⯁ MOMENTUM STATE LABEL
To reinforce the current market mode, a live label is displayed at the most recent candle:
Displays either:
“ Momentum Up ” when price breaks above the upper band.
“ Momentum Down ” when price breaks below the lower band.
“ Range ” when price remains between the bands.
Label color matches the candle color for quick identification.
Automatically updates on each bar close.
This helps discretionary traders filter trades based on market phase.
USAGE
Use the green/red zones to enter with momentum and ride trending moves.
Use the orange zone to stay out or fade ranges.
The step midline can act as a breakout base, pullback anchor, or bias reference.
Combine with other indicators (e.g., order blocks, divergences, or volume) to build high-confluence systems.
CONCLUSION
Step Channel Momentum Trend gives traders a clean, adaptive framework for identifying trend direction, volatility-based breakouts, and ranging environments — all from structural logic and ATR responsiveness. Its stepwise midline provides clarity, while its dynamic color-coded candles make momentum shifts impossible to miss. Whether you’re scalping intraday momentum or managing swing entries, this tool helps you trade with the market’s rhythm — not against it.

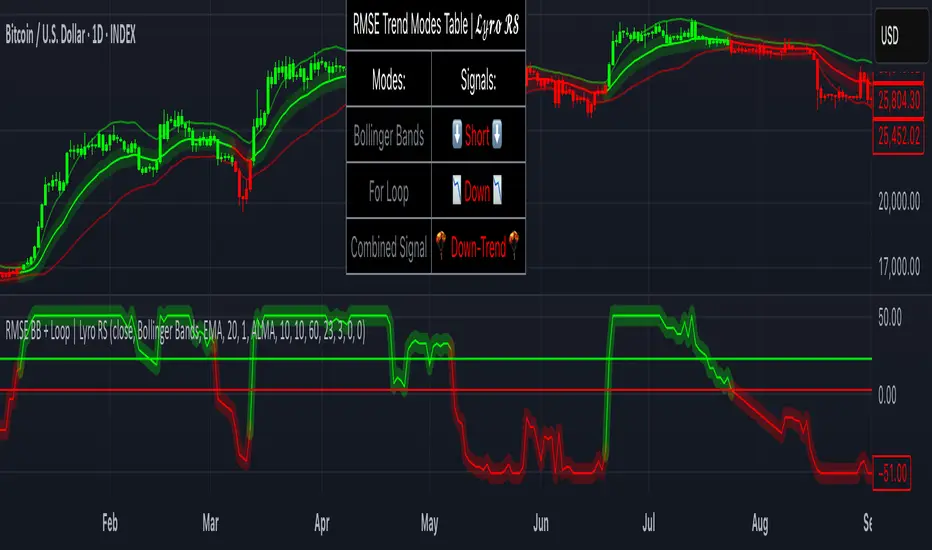
RMSE Bollinger Bands + Loop | Lyro RSRMSE Bollinger Bands + Loops
Overview
The RMSE Bollinger Bands + Loops is a sophisticated technical analysis tool designed to identify and quantify market trends by combining dynamic moving averages with statistical measures. This indicator employs a multi-model approach, integrating Bollinger-style RMSE bands, momentum scoring, and a hybrid signal system to provide traders with adaptive insights across varying market conditions.
Indicator Modes
Bollinger-style RMSE Bands: this mode calculates dynamic volatility bands around the price using the following formula:
Upper Band = Dynamic Moving Average + (RMSE × Multiplier)
Lower Band = Dynamic Moving Average - (RMSE × Multiplier)
These bands adjust to market volatility, helping identify potential breakout or breakdown points.
For-Loop Momentum Scoring, momentum is assessed by analyzing recent price behavior through a looping mechanism. A rising momentum score indicates increasing bullish strength, while a declining score suggests growing bearish momentum.
Hybrid Combined Signal: this mode assigns a directional score to the other two modes:
+1 for bullish (green)
–1 for bearish (red)
An average of these scores is computed to generate a combined signal, offering a consolidated market trend indication.
Practical Application
Signal Interpretation: A buy signal is generated when both the RMSE Bands and For-Loop Momentum Scoring align bullishly. Conversely, a sell signal is indicated when both are bearish.
Trend Confirmation: The Hybrid Combined Signal provides a consolidated view, assisting traders in confirming the prevailing market trend.
Note: Always consider additional technical analysis tools and risk management strategies when making trading decisions.
⚠️Disclaimer
This indicator is a tool for technical analysis and does not provide guaranteed results. It should be used in conjunction with other analysis methods and proper risk management practices. The creators of this indicator are not responsible for any financial decisions made based on its signals.
cd_cisd_market_CxHi Traders,
Overview:
Many traders follow market structure to identify the market direction and seek trade opportunities in line with the trend.
However, markings derived from user-defined inputs can create different structures, depending on personal choices. For instance, choosing a pivot distance of 3 instead of 2 alters the structure, even though the chart remains the same. Ideally, the structure should remain consistent.
"Change in State Delivery" ( CISD ) is a widely accepted concept among traders and is considered a significant indicator of market direction based on the gain/loss of CISD levels.
In this indicator, CISD is selected as the primary criterion for marking market structure, eliminating the influence of user-dependent variations.
Here is a summary of the key logic and rules applied:
• When the price forms a new high/low, that level is only considered a pivot if a CISD has occurred.
• A bullish CISD is always followed by a bearish CISD, and vice versa.
• Pivot points form the internal structure.
• The internal structure is used to interpret the swing structure.
• Probabilities are derived from internal structure patterns.
________________________________________
Details:
How is CISD determined?
As is commonly known:
• When price makes a new high, the opening level of the first candle in the consecutive bullish candle sequence is marked.
• When price makes a new low, the opening of the first candle in the consecutive bearish sequence is marked.
• If there’s only one candle in the sequence, its opening level is used.
In a bullish market, losing a bearish CISD level (i.e., a close below it) or in a bearish market, gaining a bullish CISD level (i.e., a close above it) is interpreted as a potential shift in buyer-seller dominance and a possible market reversal.
________________________________________
How are internal (pivot) levels determined?
• When price closes below a bearish CISD level, the highest candle's high becomes a pivot high (PH).
• When price closes above a bullish CISD level, the lowest candle's low becomes a pivot low (PL).
• If the new PH is above the previous PH, it’s labeled as HH (Higher High); otherwise, LH (Lower High).
• If the new PL is below the previous PL, it’s labeled as LL (Lower Low); otherwise, HL (Higher Low).
________________________________________
Internal Market Structure:
• A series of HHs indicates a bullish internal structure.
• A series of LLs indicates a bearish internal structure.
________________________________________
Swing (Main) Market Structure:
Using internal pivots and previous swing levels, the main market structure is derived.
• A new swing high (SH) requires the price to move above the previous SH.
• A new swing low (SL) requires the price to move below the previous SL.
________________________________________
Probability Calculation:
Pivot levels forming the internal structure are coded as five-element sequences.
There are 64 possible combinations of such sequences made from consecutive PH and PL values.
Each pattern’s frequency from its starting candle is tracked.
To make it more understandable:
For example, after the four-sequence “HH, LL, LH,HL”, either HH or LH might follow.
The table shows the statistical likelihood of both possible outcomes for the most recent four-element sequence on the chart.
________________________________________
How reliable is it?
To assess reliability, results are calculated from the beginning using:
Success Rate (Suc. Rt) = Number of Correct Predictions / Total Predictions
This value is added to the table for reference.
It’s important to note that no statistical outcome guarantees certainty—every result offers a different interpretation. What truly matters is to avoid getting stopped out 😊.
________________________________________
Menu Options:
Show/hide preferences and color selections can be customized via the indicator menu.
________________________________________
What’s Coming in Future Versions?
Features such as FVG (Fair Value Gaps) between swing levels, volume imbalances, order blocks / mitigation blocks, Fibonacci levels, and relevant trade suggestions will be added.
________________________________________
This is a BETA version that I believe will help simplify your market reading. I’d be happy to hear your feedback and suggestions.
Cheerful Trading!

Trend Blend
Trend blend is my new indicator. I use it to identify my bias when trading and filter out fake setups that are going in the wrong direction.
Trend blend utilises the 9 EMA (Red), 21 EMA (Black), and if you trade futures or Bitcoin, you can also use the VWAP (Blue).
There is also a table at the top right that displays the chart time frame bias
I prefer to use the 1-hour time frame for bias and execute the trades on 5-minute charts, mainly, and sometimes on the 1-minute for a smaller stoploss.
Here's an example of the trade I took during the London session on XAU/USD
1 hour bias was Bearish
Price broke out of the range
I waited for the London session to open, where I ended up taking a short on the 5-minute time frame as we broke out of the pre-London range
Entry was at the Fair Value Gap (5-minute bias was also Bearish as price traded into the FVG)
Stoploss was at the last high
Take Profit was the next major support level
Another set that I like to trade with the Trend blend is when price is trending bullish and price trades inside the 9 and 21 EMA, and there is a bullish candle closer above the 9 EMA with Stoploss below the low of the bullish candle and Take profit between 1-2 Risk to Reward
Same when there's a bearish trend, I wait for price to trade inside the 9 and 21 EMA, and I'll take sells when a bearish candle closes below the 9 EMA.
This setup works best in strong trends, or it can be used to enter a trade on a pullback or to scale into an existing trade.

Consolidation Zones[RanaAlgo]Overview
This indicator helps traders identify price consolidation zones (ranges) and potential breakouts in the market. It is useful for spotting periods of low volatility before significant price movements.
How It Works
Detects Consolidation Zones
Uses the ADX (Average Directional Index) to determine when the market is in a consolidation phase .
When ADX is below the threshold , the indicator marks the start of a consolidation zone.
Draws a semi-transparent box around the price range, adjusting its height as new highs/lows form.
Tracks Breakouts
When price breaks above/below the consolidation box, it signals a potential trend continuation.
Displays breakout arrows/labels (configurable shape & style) when price exits the range.
Visual Features
Boxes highlight consolidation areas (customizable color, border, and style).
Labels show real-time status ("CONSOLIDATING" or "TRENDING").
Breakout signals appear as arrows or shapes (up/down).
Usefulness in Trading
Range Trading: Helps traders identify sideways markets for buying low and selling high.
Breakout Trading: Signals potential trend entries when price exits consolidation.
Trend Confirmation: Low ADX + consolidation box = weak trend; breakout = possible trend start.
Example: If price stays in a blue box (consolidation) and then breaks above with an arrow, it suggests a bullish move.

RSI Buy Sell Signals+ with MFI Cloud [RanaAlgo]Indicator Overview
This indicator combines RSI (Relative Strength Index) with MFI (Money Flow Index) to generate trading signals with additional confirmation filters. The key features include:
RSI Analysis (14-period) with overbought/oversold levels
MFI Cloud (20-period default) showing trend direction via EMAs
Enhanced Signal Generation with volume and trend confirmation options
Visual Elements including colored zones, signal labels, and an information panel
How to Use This Indicator
Basic Interpretation:
Buy Signals (green labels) appear when:
RSI crosses above oversold level (30) OR
RSI shows a rising pattern from oversold zone with volume/trend confirmation (if enabled)
Sell Signals (red labels) appear when:
RSI crosses below overbought level (70) OR
RSI shows a falling pattern from overbought zone with volume/trend confirmation (if enabled)
MFI Cloud provides trend confirmation:
Green cloud = bullish trend (fast EMA > slow EMA)
Red cloud = bearish trend (fast EMA < slow EMA)
Recommended Usage:
For Conservative Trading:
Enable both volume and trend confirmation
Require MFI cloud to align with signal direction
Wait for RSI to clearly exit overbought/oversold zones
For Active Trading:
Combine with price action at key support/resistance levels
Watch for divergence between price and RSI
The Information Panel (top-right) shows:
Current RSI value and status
MFI trend direction
Last generated signal
Current momentum
Customization Options:
Adjust RSI/MFI lengths for sensitivity
Modify overbought/oversold levels
Toggle volume/trend confirmation requirements
Adjust visual elements like cloud opacity and zone visibility

MACD Support and Resistance [ChartPrime]⯁ OVERVIEW
MACD Support and Resistance is a dynamic support/resistance mapping tool powered by MACD crossover logic. Each time the MACD line crosses the signal line, the indicator scans for recent price extremes and locks them in as potential support or resistance zones. These levels are automatically cleaned up if price breaks them, keeping the chart focused on active market structure. The system includes a built-in MACD display with visual markers, along with contextual highs and lows to help define the current environment.
⯁ MACD-BASED SUPPORT/RESISTANCE GENERATION
The core logic uses the MACD oscillator crossover as a trigger event to generate structural levels:
When MACD crosses above its signal line:
→ The script scans the last 5 bars for the lowest low .
→ A support level is plotted at that price.
When MACD crosses below its signal line:
→ The script scans the last 5 bars for the highest high .
→ A resistance level is plotted at that price.
These dynamic levels reflect where price recently reversed or paused, making them prime zones for reaction, continuation, or invalidation.
⯁ LEVEL MANAGEMENT AND VALIDATION
To keep the chart clean and relevant:
A maximum of 20 active levels are allowed at once.
Older levels are automatically removed if the list exceeds the limit.
If price closes below a support level or above a resistance level , the corresponding line is deleted.
This ensures that only currently respected levels remain on the chart — a major advantage for active traders.
⯁ MACD VISUALIZATION + SIGNAL MARKERS
A full MACD system is rendered on the lower panel for visual confirmation:
The MACD line and Signal line are both plotted and color-coded dynamically.
A filled area] highlights the spread between them to emphasize momentum strength.
A diamond marker is drawn each time MACD crosses its signal line, alerting traders to potential trend shifts.
These visuals make it easy to understand the timing of the support/resistance updates.
⯁ LOCAL EXTREME REFERENCE LINES
To help contextualize current price position relative to recent market extremes:
A Local High line is plotted based on the highest MACD value over the past 100 bars].
A Local Low line is plotted based on the lowest MACD value over the past 100 bars].
These levels are rendered lightly and serve as dynamic range boundaries.
They assist traders in identifying overextended or compressed MACD behavior.
⯁ USAGE
Use the generated S/R levels as breakout or reversal zones.
Watch for MACD diamond markers to confirm the timing of new levels.
Combine these reactive zones with other ChartPrime confluence tools for higher-confidence entries.
Use the Local High/Low zones as a volatility envelope to guide risk and trend continuation potential.
⯁ CONCLUSION
MACD Support and Resistance takes a classic momentum indicator and adds real-time structural awareness. By linking MACD crossover events to recent price extremes, it identifies the zones where market sentiment shifted — and continues to monitor their strength. Whether you're a breakout trader or looking to fade key reaction points, this tool delivers clean, actionable levels based on momentum and structure — not guesswork.
