Highlight Time ZonesWe can set our specific time zones and highlight those zones, so we can analyze that particular session
Trend

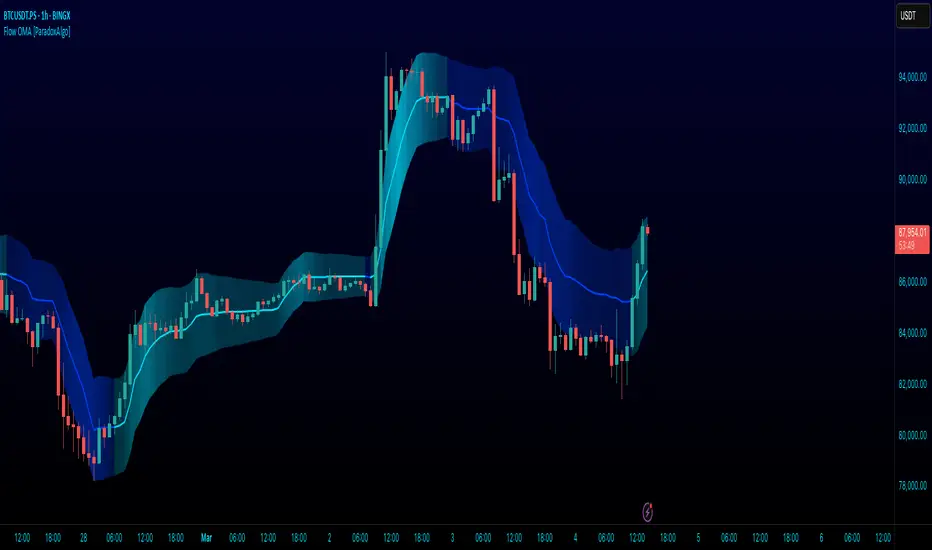
Flow Optimized Moving AverageOverview
The Flow Optimized Moving Average (Flow OMA) is an advanced adaptive moving average designed to dynamically adjust smoothing factors based on market efficiency and volatility. By integrating the Efficiency Ratio (ER) with an Adaptive Moving Average (AMA) and leveraging ATR-based bands, this indicator provides traders with a refined tool for identifying trend direction, strength, and potential reversal zones.
Key Features
Adaptive Moving Average (AMA)
Adjusts to price action based on the Efficiency Ratio (ER), reducing lag in trending markets while smoothing noise in ranging conditions.
Efficiency Ratio (ER)
Measures the effectiveness of price movement over a defined lookback period.
Helps in dynamically adjusting the smoothing constant of the AMA.
ATR-Based Volatility Bands
Creates upper and lower dynamic bands based on the Average True Range (ATR).
Expands in high volatility and contracts in low volatility, providing traders with a contextual understanding of price action.
Slope-Based Trend Strength
Normalizes the moving average slope relative to ATR.
Generates a trend strength score, which influences band opacity, making strong trends visually distinguishable.
Dynamic Color Coding
Bullish Trends: Cyan/Turquoise (#00e2ff)
Bearish Trends: Blue (#003ff5)
Neutral Trends: Gray
The transparency of the bands dynamically adjusts based on trend strength.
Fill Zone Effect
The area between the ATR bands is filled with a gradient-like effect, giving a clear visual representation of trend strength and transitions.
Indicator Components
Inputs (User Settings)
ER Lookback Period: Defines how many bars are used in the Efficiency Ratio calculation (default: 10).
Fast & Slow Periods: Control the sensitivity of the Adaptive Moving Average (default: 2 & 30).
ATR Period: Defines the lookback for Average True Range (default: 14).
Band Multiplier: Determines the width of ATR-based bands (default: 1.5).
Slope Average Period: Smooths trend slope for more stable trend assessment (default: 5).
Efficiency Ratio Calculation
Measures how effectively price moves in a straight line compared to its total movement.
A higher ER value suggests strong trend momentum, while a lower value implies consolidation.
Adaptive Moving Average (AMA)
Dynamically adjusts its smoothing factor based on ER.
Uses a smoothing constant that ranges between the fastest and slowest specified values.
Volatility-Based Bands
Constructed using the ATR multiplier.
Expand and contract dynamically in response to market volatility.
Trend Strength & Direction
Computed using the normalized slope of AMA against ATR.
Positive slope = Bullish trend, Negative slope = Bearish trend.
Visual Enhancements
Colored Adaptive MA Line: Changes based on trend direction.
ATR Bands with Gradient Fill: Visual representation of market conditions.
Dynamic Opacity: Highlights trend strength through transparency.
How to Use the Flow OMA Indicator
Trend Identification
When the Adaptive MA is rising and colored cyan, a bullish trend is in play.
When the Adaptive MA is falling and colored blue, a bearish trend is present.
Trend Strength Assessment
A stronger trend results in more opaque band fills, indicating a clear directional bias.
Weaker trends or consolidations result in fainter fills, signaling a loss of momentum.
Reversal Signals
If price touches the upper band in a bullish move and starts reversing, it can indicate potential profit-taking areas.
If price approaches the lower band in a bearish move and rebounds, a short-term reversal may be imminent.
Volatility Insights
Narrow bands indicate low volatility and possible breakout conditions.
Wider bands suggest increased volatility, warning traders of potential price swings.
Best Practices
✅ Combine with Other Indicators
Use RSI, MACD, or Volume Profile for confirmation before executing trades.
✅ Apply to Multiple Timeframes
Works effectively in higher timeframes (1H, 4H, Daily) for trend trading.
Can be utilized in lower timeframes (5m, 15m) for scalping setups.
✅ Adjust Parameters Based on Asset Volatility
Increase ATR Period for stocks with high volatility.
Reduce ATR Multiplier for forex pairs to avoid excessive band width.
The Flow Optimized Moving Average (Flow OMA) is a powerful trend-following tool designed for both swing and intraday traders. Its adaptive nature allows it to efficiently track trends while minimizing false signals. By incorporating dynamic volatility bands and trend-sensitive color coding, this indicator enhances traders' ability to read price action effectively. Whether used standalone or in combination with other indicators, Flow OMA provides a significant edge in trend analysis.
WAVE(구름)시그널WAVE(구름) 시그널 - Volumatic VIDYA by BigBeluga
🔹 개요
WAVE(구름) 시그널은 변동성 기반의 VIDYA(Variable Index Dynamic Average) 지표를 활용하여 시장의 트렌드를 시각적으로 표현하는 맞춤형 인디케이터입니다. 변동성과 모멘텀을 고려한 스마트한 필터링을 통해 트렌드 반전, 지지/저항 레벨, 유동성 영역 등을 효과적으로 탐지할 수 있습니다.
🔹 기능 및 특징
✅ VIDYA 기반 트렌드 분석: 시장의 모멘텀을 반영하여 지속적인 상승/하락 트렌드를 감지
✅ 유동성 영역 시각화: 주요 지지/저항 구간을 표시하여 고액 거래 구역을 쉽게 식별 가능
✅ ATR(평균 진폭) 기반 밴드: 변동성을 반영한 상단/하단 밴드를 활용해 트렌드 강도 분석
✅ 트렌드 변화 감지: 상승/하락 전환 지점에 ▲▼ 마커를 배치하여 매매 타이밍 포착
✅ 볼륨 기반 필터링: 거래량 변화를 감지하여 매매 신호의 신뢰도를 보완
🔹 활용 방법
📌 트렌드 매매: VIDYA 라인이 상승 전환 시 매수, 하락 전환 시 매도 시그널로 활용
📌 유동성 분석: 주요 저항/지지선에서 거래량 분포를 확인하여 진입 및 청산 전략 수립
📌 과매수/과매도 감지: ATR 기반 상/하단 밴드를 돌파하는 움직임을 통해 변동성 분석

Market Participation Index [PhenLabs]📊 Market Participation Index
Version: PineScript™ v6
📌 Description
Market Participation Index is a well-evolved statistical oscillator that constantly learns to develop by adapting to changing market behavior through the intricate mathematical modeling process. MPI combines different statistical approaches and Bayes’ probability theory of analysis to provide extensive insight into market participation and building momentum. MPI combines diverse statistical thinking principles of physics and information and marries them for subtle changes to occur in markets, levels to become influential as important price targets, and pattern divergences to unveil before it is visible by analytical methods in an old-fashioned methodology.
🚀 Points of Innovation:
Automatic market condition detection system with intelligent preset selection
Multi-statistical approach combining classical and advanced metrics
Fractal-based divergence system with quality scoring
Adaptive threshold calculation using statistical properties of current market
🚨 Important🚨
The ‘Auto’ mode intelligently selects the optimal preset based on real-time market conditions, if the visualization does not appear to the best of your liking then select the option in parenthesis next to the auto mode on the label in the oscillator in the settings panel.
🔧 Core Components
Statistical Foundation: Multiple statistical measures combined with weighted approach
Market Condition Analysis: Real-time detection of market states (trending, ranging, volatile)
Change Point Detection: Bayesian analysis for finding significant market structure shifts
Divergence System: Fractal-based pattern detection with quality assessment
Adaptive Visualization: Dynamic color schemes with context-appropriate settings
🔥 Key Features
The indicator provides comprehensive market analysis through:
Multi-statistical Oscillator: Combines Z-score, MAD, and fractal dimensions
Advanced Statistical Components: Includes skewness, kurtosis, and entropy analysis
Auto-preset System: Automatically selects optimal settings for current conditions
Fractal Divergence Analysis: Detects and grades quality of divergence patterns
Adaptive Thresholds: Dynamically adjusts overbought/oversold levels
🎨 Visualization
Color-coded Oscillator: Gradient-filled oscillator line showing intensity
Divergence Markings: Clear visualization of bullish and bearish divergences
Threshold Lines: Dynamic or fixed overbought/oversold levels
Preset Information: On-chart display of current market conditions
Multiple Color Schemes: Modern, Classic, Monochrome, and Neon themes
Classic
Modern
Monochrome
Neon
📖 Usage Guidelines
The indicator offers several customization options:
Market Condition Settings:
Preset Mode: Choose between Auto-detection or specific market condition presets
Color Theme: Select visual theme matching your chart style
Divergence Labels: Choose whether or not you’d like to see the divergence
✅ Best Use Cases:
Identify potential market reversals through statistical divergences
Detect changes in market structure before price confirmation
Filter trades based on current market condition (trending vs. ranging)
Find optimal entry and exit points using adaptive thresholds
Monitor shifts in market participation and momentum
⚠️ Limitations
Requires sufficient historical data for accurate statistical analysis
Auto-detection may lag during rapid market condition changes
Advanced statistical calculations have higher computational requirements
Manual preset selection may be required in certain transitional markets
💡 What Makes This Unique
Statistical Depth: Goes beyond traditional indicators with advanced statistical measures
Adaptive Intelligence: Automatically adjusts to current market conditions
Bayesian Analysis: Identifies statistically significant change points in market structure
Multi-factor Approach: Combines multiple statistical dimensions for confirmation
Fractal Divergence System: More robust than traditional divergence detection methods
🔬 How It Works
The indicator processes market data through four main components:
Market Condition Analysis:
Evaluates trend strength, volatility, and price patterns
Automatically selects optimal preset parameters
Adapts sensitivity based on current conditions
Statistical Oscillator:
Combines multiple statistical measures with weights
Normalizes values to consistent scale
Applies adaptive smoothing
Advanced Statistical Analysis:
Calculates higher-order statistical moments
Applies information-theoretic measures
Detects distribution anomalies
Divergence Detection:
Uses fractal theory to identify pivot points
Detects and scores divergence quality
Filters signals based on current market phase
💡 Note:
The Market Participation Index performs optimally when used across multiple timeframes for confirmation. Its statistical foundation makes it particularly valuable during market transitions and periods of changing volatility, where traditional indicators often fail to provide clear signals.

Trend SCANThe visually important moving averages EMA5, EMA20, EMA144 and EMA169 are seen on the indicator.
However, the main purpose of the indicator is to combine the changes in the rsi, ema, volume, momentum and cci data on the stock and to display them in a label on the chart with a formula aimed at determining the stocks that are in an uptrend.
The group that the stock group is desired to be scanned from the indicator settings is selected and the scanning process is instantly visible on the label in the chart period or in the time interval selected outside the chart period.
The stock groups are grouped as BIST50, BIST100, Yildiz Pazar and Main Pazar. But these can be selected as desired.

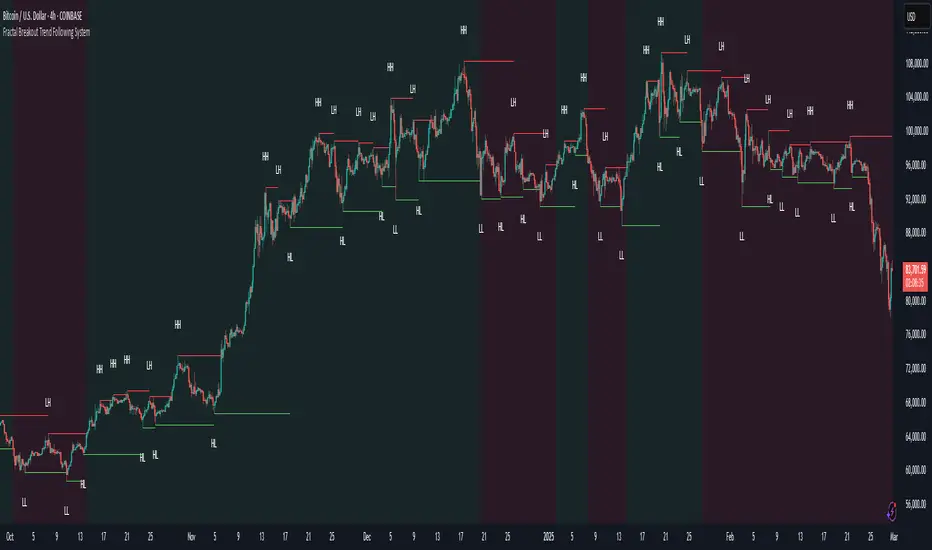
Fractal Breakout Trend Following System█ OVERVIEW
The Fractal Breakout Trend Following System is a custom technical analysis tool designed to pinpoint significant fractal pivot points and breakout levels. By analyzing price action through configurable pivot parameters, this indicator dynamically identifies key support and resistance zones. It not only marks crucial highs and lows on the chart but also signals potential trend reversals through real-time breakout detections, helping traders capture shifts in market momentum.
█ KEY FEATURES
Fractal Pivot Detection
Utilizes user-defined left and right pivot lengths to detect local highs (pivot highs) and lows (pivot lows). This fractal-based approach ensures that only meaningful price moves are considered, effectively filtering out minor market noise.
Dynamic Line Visualization
Upon confirmation of a pivot, the system draws a dynamic line representing resistance (from pivot highs) or support (from pivot lows). These lines extend across the chart until a breakout occurs, offering a continuous visual guide to key levels.
Trend Breakout Signals
Monitors for price crossovers relative to the drawn pivot lines. A crossover above a resistance line signals a bullish breakout, while a crossunder below a support line indicates a bearish move, thus updating the prevailing trend.
Pivot Labelling
Assigns labels such as "HH", "LH", "LL", or "HL" to detected pivots based on their relative values.
It uses the following designations:
HH (Higher High) : Indicates that the current pivot high is greater than the previous pivot high, suggesting continued upward momentum.
LH (Lower High) : Signals that the current pivot high is lower than the previous pivot high, which may hint at a potential reversal within an uptrend.
LL (Lower Low) : Shows that the current pivot low is lower than the previous pivot low, confirming sustained downward pressure.
HL (Higher Low) : Reveals that the current pivot low is higher than the previous pivot low, potentially indicating the beginning of an upward reversal in a downtrend.
These labels provide traders with immediate insight into the market structure and recent price behavior.
Customizable Visual Settings
Offers various customization options:
• Adjust pivot sensitivity via left/right pivot inputs.
• Toggle pivot labels on or off.
• Enable background color changes to reflect bullish or bearish trends.
• Choose preferred colors for bullish (e.g., green) and bearish (e.g., red) signals.
█ UNDERLYING METHODOLOGY & CALCULATIONS
Fractal Pivot Calculation
The script employs a sliding window technique using configurable left and right parameters to identify local highs and lows. Detected pivot values are sanitized to ensure consistency in subsequent calculations.
Dynamic Line Plotting
When a new pivot is detected, a corresponding line is drawn from the pivot point. This line extends until the price breaks the level, at which point it is reset. This method provides a continuous reference for support and resistance.
Trend Breakout Identification
By continuously monitoring price interactions with the pivot lines, the indicator identifies breakouts. A price crossover above a resistance line suggests a bullish breakout, while a crossunder below a support line indicates a bearish shift. The current trend is updated accordingly.
Pivot Label Assignment
The system compares the current pivot with the previous one to determine if the move represents a higher high, lower high, higher low, or lower low. This classification helps traders understand the underlying market momentum.
█ HOW TO USE THE INDICATOR
1 — Apply the Indicator
• Add the Fractal Breakout Trend Following System to your chart to begin visualizing dynamic pivot points and breakout signals.
2 — Adjust Settings for Your Market
• Pivot Detection – Configure the left and right pivot lengths for both highs and lows to suit your desired sensitivity:
- Use shorter lengths for more responsive signals in fast-moving markets.
- Use longer lengths to filter out minor fluctuations in volatile conditions.
• Visual Customization – Toggle the display of pivot labels and background color changes. Select your preferred colors for bullish and bearish trends.
3 — Interpret the Signals
• Support & Resistance Lines – Observe the dynamically drawn lines that represent key pivot levels.
• Pivot Labels – Look for labels like "HH", "LH", "LL", and "HL" to quickly assess market structure and trend behavior.
• Trend Signals – Watch for price crossovers and corresponding background color shifts to gauge bullish or bearish breakouts.
4 — Integrate with Your Trading Strategy
• Use the identified pivot points as potential support and resistance levels.
• Combine breakout signals with other technical indicators for comprehensive trade confirmation.
• Adjust the sensitivity settings to tailor the indicator to various instruments and market conditions.
█ CONCLUSION
The Fractal Breakout Trend Following System offers a robust framework for identifying critical fractal pivot points and potential breakout opportunities. With its dynamic line plotting, clear pivot labeling, and customizable visual settings, this indicator equips traders with actionable insights to enhance decision-making and optimize entry and exit strategies.
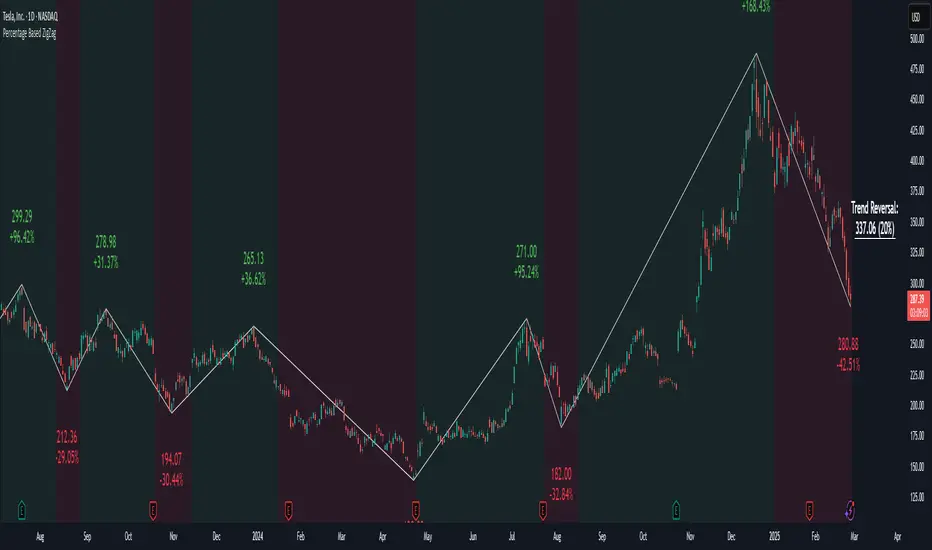
Percentage Based ZigZag█ OVERVIEW
The Percentage-Based ZigZag indicator is a custom technical analysis tool designed to highlight significant price reversals while filtering out market noise. Unlike many standard zigzag tools that rely solely on fixed price moves or generic trend-following methods, this indicator uses a configurable percentage threshold to dynamically determine meaningful pivot points. This approach not only adapts to different market conditions but also helps traders distinguish between minor fluctuations and truly significant trend shifts—whether scalping on shorter timeframes or analyzing longer-term trends.
█ KEY FEATURES & ORIGINALITY
Dynamic Pivot Detection
The indicator identifies pivot points by measuring the percentage change from the previous extreme (high or low). Only when this change exceeds a user-defined threshold is a new pivot recognized. This method ensures that only substantial moves are considered, making the indicator robust in volatile or noisy markets.
Enhanced ZigZag Visualization
By connecting significant highs and lows with a continuous line, the indicator creates a clear visual map of price swings. Each pivot point is labelled with the corresponding price and the percentage change from the previous pivot, providing immediate quantitative insight into the magnitude of the move.
Trend Reversal Projections
In addition to marking completed reversals, the script computes and displays potential future reversal points based on the current trend’s momentum. This forecasting element gives traders an advanced look at possible turning points, which can be particularly useful for short-term scalping strategies.
Customizable Visual Settings
Users can tailor the appearance by:
• Setting the percentage threshold to control sensitivity.
• Customizing colors for bullish (e.g., green) and bearish (e.g., red) reversals.
• Enabling optional background color changes that visually indicate the prevailing trend.
█ UNDERLYING METHODOLOGY & CALCULATIONS
Percentage-Based Filtering
The script continuously monitors price action and calculates the relative percentage change from the last identified pivot. A new pivot is confirmed only when the price moves a preset percentage away from this pivot, ensuring that minor fluctuations do not trigger false signals.
Pivot Point Logic
The indicator tracks the highest high and the lowest low since the last pivot. When the price reverses by the required percentage from these extremes, the algorithm:
1 — Labels the point as a significant high or low.
2 — Draws a connecting line from the previous pivot to the current one.
3 — Resets the extreme-tracking for detecting the next move.
Real-Time Reversal Estimation
Building on traditional zigzag methods, the script incorporates a projection calculation. By analyzing the current trend’s strength and recent percentage moves, it estimates where a future reversal might occur, offering traders actionable foresight.
█ HOW TO USE THE INDICATOR
1 — Apply the Indicator
• Add the Percentage-Based ZigZag indicator to your trading chart.
2 — Adjust Settings for Your Market
• Percentage Move – Set a threshold that matches your trading style:
- Lower values for sensitive, high-frequency analysis (ideal for scalping).
- Higher values for filtering out noise on longer timeframes.
• Visual Customization – Choose your preferred colors for bullish and bearish signals and enable background color changes for visual trend cues.
• Reversal Projection – Enable or disable the projection feature to display potential upcoming reversal points.
3 — Interpret the Signals
• ZigZag Lines – White lines trace significant high-to-low or low-to-high movements, visually connecting key swing points.
• Pivot Labels – Each pivot is annotated with the exact price level and percentage change, providing quantitative insight into market momentum.
• Trend Projections – When enabled, projected reversal levels offer insight into where the current trend might change.
4 — Integrate with Your Trading Strategy
• Use the indicator to identify support and resistance zones derived from significant pivots.
• Combine the quantitative data (percentage changes) with your risk management strategy to set optimal stop-loss and take-profit levels.
• Experiment with different threshold settings to adapt the indicator for various instruments or market conditions.
█ CONCLUSION
The Percentage-Based ZigZag indicator goes beyond traditional trend-following tools by filtering out market noise and providing clear, quantifiable insights into price action. With its percentage threshold for pivot detection and real-time reversal projections, this original methodology and customizable feature set offer traders a versatile edge for making informed trading decisions.
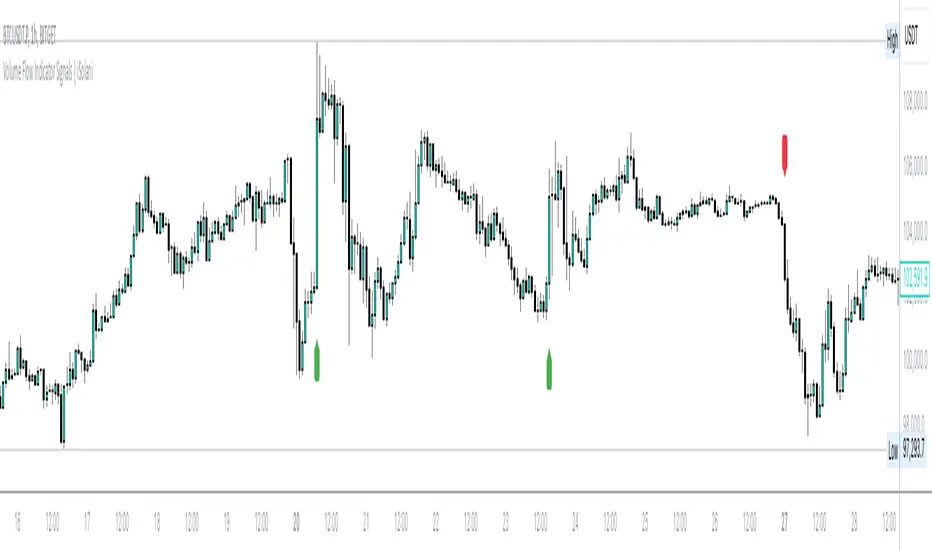
Volume Flow Indicator Signals | iSolani
Volume Flow Indicator Signals | iSolani: Decoding Trend Momentum with Volume Precision
In markets where trends are fueled by institutional participation, discerning genuine momentum from false moves is critical. The Volume Flow Indicator Signals | iSolani cuts through this noise by synthesizing price action with volume dynamics, generating high-confidence signals when capital flows align with directional bias. This tool reimagines traditional volume analysis by incorporating volatility-adjusted thresholds and dual-layer smoothing, offering traders a laser-focused approach to trend identification.
Core Methodology
The indicator employs a multi-stage calculation to quantify volume-driven momentum:
Volatility-Adjusted Filter: Measures price changes via log returns, scaling significance using a 30-bar standard deviation multiplied by user-defined sensitivity (default: 2x).
Volume Normalization: Caps extreme volume spikes at 3x the 50-bar moving average, preventing distortion from anomalous trades.
Directional Volume Flow: Assigns positive/negative values to volume based on whether price movement exceeds volatility-derived thresholds.
Dual Smoothing: Applies consecutive SMA (3-bar) and EMA (14-bar) to create the Volume Flow Indicator (VFI) and its signal line, filtering out transient fluctuations.
Breaking New Ground
This implementation introduces three key innovations:
Adaptive Noise Gates: Unlike static volume oscillators, the sensitivity coefficient dynamically adjusts to market volatility, reducing false signals during choppy conditions.
Institutional Volume Capping: The vcoef parameter limits the influence of outlier volume spikes, focusing on sustained institutional activity rather than one-off trades.
Non-Repainting Signals: Generates single-per-trend labels (buy below bars, sell above) to avoid chart clutter while maintaining visual clarity.
Engine Under the Hood
The script executes through five systematic stages:
Data Preparation: Computes HLC3 typical price and its logarithmic rate of change.
Threshold Calculation: Derives dynamic cutoff levels using 30-period volatility scaled by user sensitivity.
Volume Processing: Filters raw volume through a 50-bar SMA, capping extremes at 3x average.
VFI Construction: Sums directional volume flow over 50 bars, smoothed with a 3-bar SMA.
Signal Generation: Triggers alerts when VFI crosses zero, confirmed by a 14-bar EMA crossover.
Standard Configuration
Optimized defaults balance responsiveness and reliability:
Volume MA: 50-bar smoothing window
Sensitivity: 2.0 (doubles volatility threshold)
Signal Smoothing: 14-bar EMA
Volume Cap: 3x average (hidden parameter)
VFI Smoothing: Enabled (3-bar SMA)
By fusing adaptive volume filtering with price confirmation logic, the Volume Flow Indicator Signals | iSolani transforms raw market data into institutional-grade trend signals. Its ability to mute choppy price action while amplifying high-conviction volume moves makes it particularly effective for spotting early trend reversals in equities, forex, and futures markets.
Gradient Trend Filter [ChartPrime]The Gradient Trend Filter is a dynamic trend analysis tool that combines a noise-filtered trend detection system with a color-gradient cloud. It provides traders with a visual representation of trend strength, momentum shifts, and potential reversals.
⯁ KEY FEATURES
Trend Noise Filtering
Uses an advanced smoothing function to filter market noise and produce a more reliable trend representation.
// Noise filter function
noise_filter(src, length) =>
alpha = 2 / (length + 1)
nf_1 = 0.0
nf_2 = 0.0
nf_3 = 0.0
nf_1 := (alpha * src) + ((1 - alpha) * nz(nf_1 ))
nf_2 := (alpha * nf_1) + ((1 - alpha) * nz(nf_2 ))
nf_3 := (alpha * nf_2) + ((1 - alpha) * nz(nf_3 ))
nf_3 // Final output with three-stage smoothing
Color-Based Trend Visualization
The mid-line changes color based on trend direction—green for uptrends and red for downtrends—making it easy to identify trends at a glance.
Orange diamond markers appear when a trend shift is confirmed, providing actionable signals for traders.
Gradient Color Trend Cloud
A cloud around the base trend line that dynamically changes color, often signaling trend shifts ahead of the main trend line.
When in a downtrend, if the cloud starts turning green, it suggests weakening bearish momentum or an upcoming bullish reversal. Conversely, when in an uptrend, a red cloud indicates potential trend weakening or a bearish reversal.
Multi-Layered Trend Bands
The cloud consists of multiple bands, offering a range of support and resistance zones that traders can use for confluence in decision-making.
⯁ HOW TO USE
Identify Trend Strength & Reversals
Use the mid-line and cloud color changes to assess the strength of a trend and spot early signs of reversals.
Monitor Momentum Shifts
Watch for gradient cloud color shifts before the trend line changes color, as this can indicate early weakening or strengthening of momentum.
Act on Trend Shift Markers
Use the orange diamonds as confirmation of trend shifts and potential trade entry or exit points.
Utilize Cloud Bands as Support/Resistance
The outer bands of the cloud act as dynamic support and resistance, helping traders refine their stop-loss and take-profit placements.
⯁ CONCLUSION
The Gradient Trend Filter is an advanced trend detection tool designed for traders looking to anticipate trend shifts with greater precision. By integrating a noise-filtered trend line with a gradient-based trend cloud, this indicator enhances traders' ability to navigate market trends effectively.

Cumulative Price Change AlertCumulative Price Change Alert
Version: 1.0
Author: QCodeTrader 🚀
Overview 🔍
The Cumulative Price Change Alert indicator analyzes the percentage change between the current and previous open prices and sums these changes over a user-defined number of bars. It then generates visual buy and sell signals using arrows and labels on the chart, helping traders spot cumulative price momentum and potential trading opportunities.
Key Features ⚙️
Customizable Timeframe 🕒:
Use a custom timeframe or default to the chart's timeframe for price data.
User-Defined Summation 🔢:
Specify the number of bars to sum, allowing you to analyze cumulative price changes.
Custom Buy & Sell Conditions 🔔:
Set individual percentage change thresholds and cumulative sum thresholds to tailor signals for
your strategy.
Visual Alerts 🚀:
Displays green upward arrows for buy signals and red downward arrows for sell signals directly
on the chart.
Informative Labels 📝:
Provides labels with formatted percentage change and cumulative sum details for the analyzed
bars.
Versatile Application 📊:
Suitable for stocks, forex, crypto, commodities, and more.
How It Works ⚡
Price Change Calculation ➗:
The indicator calculates the percentage change between the current bar's open price and the
previous bar's open price.
Cumulative Sum ➕:
It then sums these percentage changes over the last N bars (as specified by the user).
Signal Generation 🚦:
Buy Signal 🟢: When both the individual percentage change and the cumulative sum exceed
their respective buy thresholds, a green arrow and label are displayed.
Sell Signal 🔴: Conversely, if the individual change and cumulative sum fall below the sell
thresholds, a red arrow and label are shown.
How to Use 💡
Add the Indicator ➕:
Apply the indicator to your chart.
Customize Settings ⚙️:
Set a custom timeframe if desired.
Define the number of bars to sum.
Adjust the buy/sell percentage change and cumulative sum thresholds to match your trading
strategy.
Interpret Visual Cues 👀:
Monitor the chart for green or red arrows and corresponding labels that signal potential buy or
sell opportunities based on cumulative price movements.
Settings Explained 🛠️
Custom Timeframe:
Select an alternative timeframe for analysis, or leave empty to use the current chart's timeframe.
Number of Last Bars to Sum:
Determines how many bars are used to compute the cumulative percentage change.
Buy Condition - Min % Change:
The minimum individual percentage change required to consider a buy signal.
Buy Condition - Min Sum of Bars:
The minimum cumulative percentage change over the defined bars needed for a buy signal.
Sell Condition - Max % Change:
The maximum individual percentage change threshold for a sell signal.
Sell Condition - Max Sum of Bars:
The maximum cumulative percentage change over the defined bars for triggering a sell signal.
Best Use Cases 🎯
Momentum Identification 📈:
Quickly spot strong cumulative price movements and momentum shifts.
Entry/Exit Signals 🚪:
Use the visual signals to determine potential entry and exit points in your trading.
Versatile Strategy Application 🔄:
Effective for scalping, swing trading, and longer-term analysis across various markets.
UPD: uncheck labels for better performance

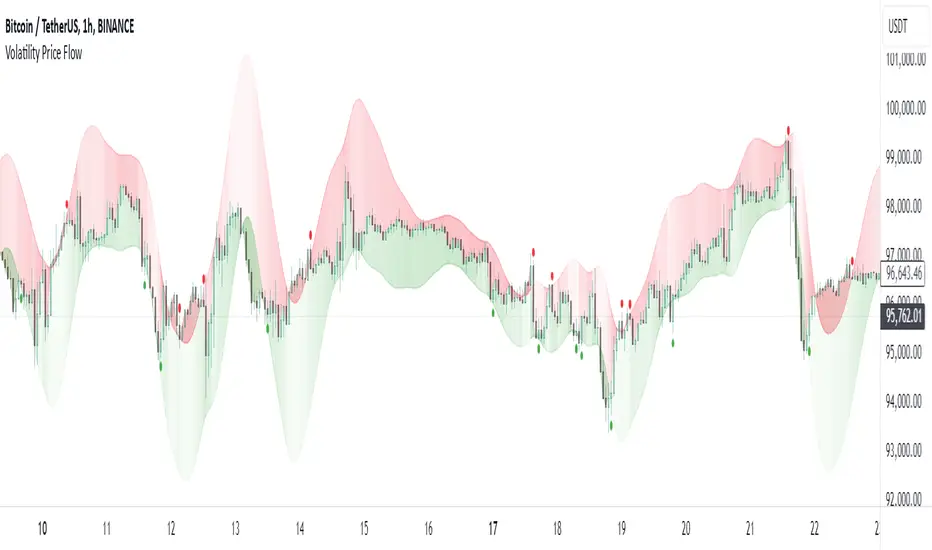
Volatility Price FlowCapitalize on market volatility with our new volatility price flow indicator. We have designed this indicator to process historical price movements and indicate when price may have reached exhaustion in the context of current volatility.
This is achieved by taking the price deviation from a user defined moving average, and applying a weighting to the deviations from the candle body and candle wick on both buy side and sell side, over a user defined period. The period of the base moving average, type of moving average and the period of the historical price deviations can all be modified. This creates a typical 'band' style indicator, though with a unique characteristic that the buy and sell side vary independently as well as the band expansion being based on weighted variables tied to the actual price changes, rather than just a standard deviation the moves uniformly.
Additionally, these bands can be merged with an anchored vwap - we do this so that the deviations of price from the moving average can include a more volume based approach to identifying potential pivots.
The end result is an indicator that reflects the current market price movements, identifies and capitalizes on impulsive or beginning moves to indicate potential tops / bottoms / reversals.
The signals are simple - anytime price closes within a band, having been outside the band, a signal is displayed. As a basic guide to setting the indicator up for the first time, we suggest reducing all of the multipliers to a value less than 1. Then gradually increase each one, until the signals reduce in quantity and improve in quality, starting with the price deviation multiplier, then the volatility multiplier and finally the expansion multiplier.
Last of all, alerts can be created based on the current chart timeframe and indicator settings, simply by adding an alert that uses the built in buy or sell signal.
Note: We cannot guarantee the accuracy of the signals provided, since the user creates the signals by modifying the settings, and as such we can take no responsibility for any trading losses incurred using the indicator and highly encourage all users to manage their risk and only risk what you can afford to lose.
Bitcoin Power Law: Complete with Oscillator + Future Projection
Firstly, we would like to give credit to @apsk32 and @x_X_77_X_x as part of the code originates from their work. Additionally, @apsk32 is widely credited with applying the Power Law concept to Bitcoin and popularizing this model within the crypto community. Additionally, the visual layout is fully inspired by @apsk32's designs, and we think it looks amazing. So much so that we had to turn it into a TradingView script. Thank you!
Understanding the Bitcoin Power Law Model
Also called the Long-Term Bitcoin Power Law Model. The Bitcoin Power Law model tries to capture and predict Bitcoin's price growth over time. It assumes that Bitcoin's price follows an exponential growth pattern, where the price increases over time according to a mathematical relationship.
By fitting a power law to historical data, the model creates a trend line that represents this growth. It then generates additional parallel lines (support and resistance lines) to show potential price boundaries, helping to visualize where Bitcoin’s price could move within certain ranges.
In simple terms, the model helps us understand Bitcoin's general growth trajectory and provides a framework to visualize how its price could behave over the long term.
The Bitcoin Power Law has the following function:
Power Law = 10^(a + b * log10(d))
Consisting of the following parameters:
a: Power Law Intercept (default: -17.668).
b: Power Law Slope (default: 5.926).
d: Number of days since a reference point(calculated by counting bars from the reference point with an offset).
Explanation of the a and b parameters:
Roughly explained, the optimal values for the a and b parameters are determined through a process of linear regression on a log-log scale (after applying a logarithmic transformation to both the x and y axes). On this log-log scale, the power law relationship becomes linear, making it possible to apply linear regression. The best fit for the regression is then evaluated using metrics like the R-squared value, residual error analysis, and visual inspection. This process can be quite complex and is beyond the scope of this post.
Applying vertical shifts to generate the other lines:
Once the initial power-law is created, additional lines are generated by applying a vertical shift . This shift is achieved by adding a specific number of days (or years in case of this script) to the d-parameter. This creates new lines perfectly parallel to the initial power law with an added vertical shift, maintaining the same slope and intercept.
In the case of this script, shifts are made by adding +365 days, +2 * 365 days, +3 * 365 days, +4 * 365 days, and +5 * 365 days, effectively introducing one to five years of shifts. This results in a total of six Power Law lines, as outlined below (From lowest to highest):
Base Power Law Line (no shift)
1-year shifted line
2-year shifted line
3-year shifted line
4-year shifted line
5-year shifted line
The six power law lines:
Bitcoin Power Law Oscillator
This publication also includes the oscillator version of the Bitcoin Power Law. This version applies a logarithmic transformation to the price, Base Power Law Line, and 5-year shifted line using the formula log10(x) .
The log-transformed price is then normalized using min-max normalization relative to the log-transformed Base Power Law Line and 5-year shifted line with the formula:
normalized price = log(close) - log(Base Power Law Line) / log(5-year shifted line) - log(Base Power Law Line)
Finally, the normalized price was multiplied by 5 to map its value between 0 and 5, aligning with the shifted lines. The Oscillator version can be found here .
Interpretation of the Bitcoin Power Law Model:
The shifted Power Law lines provide a framework for predicting Bitcoin's future price movements based on historical trends. These lines are created by applying a vertical shift to the initial Power Law line, with each shifted line representing a future time frame (e.g., 1 year, 2 years, 3 years, etc.).
By analyzing these shifted lines, users can make predictions about minimum price levels at specific future dates. For example, the 5-year shifted line will act as the main support level for Bitcoin’s price in 5 years, meaning that Bitcoin’s price should not fall below this line, ensuring that Bitcoin will be valued at least at this level by that time. Similarly, the 2-year shifted line will serve as the support line for Bitcoin's price in 2 years, establishing that the price should not drop below this line within that time frame.
On the other hand, the 5-year shifted line also functions as an absolute resistance , meaning Bitcoin's price will not exceed this line prior to the 5-year mark. This provides a prediction that Bitcoin cannot reach certain price levels before a specific date. For example, the price of Bitcoin is unlikely to reach $100,000 before 2021, and it will not exceed this price before the 5-year shifted line becomes relevant. After 2028, however, the price is predicted to never fall below $100,000, thanks to the support established by the shifted lines.
In essence, the shifted Power Law lines offer a way to predict both the minimum price levels that Bitcoin will hit by certain dates and the earliest dates by which certain price points will be reached. These lines help frame Bitcoin's potential future price range, offering insight into long-term price behavior and providing a guide for investors and analysts. Lets examine some examples:
Example 1:
In Example 1 it can be seen that point A on the 5-year shifted line acts as major resistance . Also it can be seen that 5 years later this price level now corresponds to the Base Power Law Line and acts as a major support (Note: Vertical yearly grid lines have been added for this purpose👍).
Example 2:
In Example 2, the price level at point C on the 3-year shifted line becomes a major support three years later at point C, now aligning with the Base Power Law Line.
Finally, let's explore some future price predictions, as this script provides projections on the weekly timeframe :
Example 3:
In Example 3, the Bitcoin Power Law indicates that Bitcoin's price cannot surpass approximately $808K before 2030 as can be seen at point E, while also ensuring it will be at least $224K by then (point F).

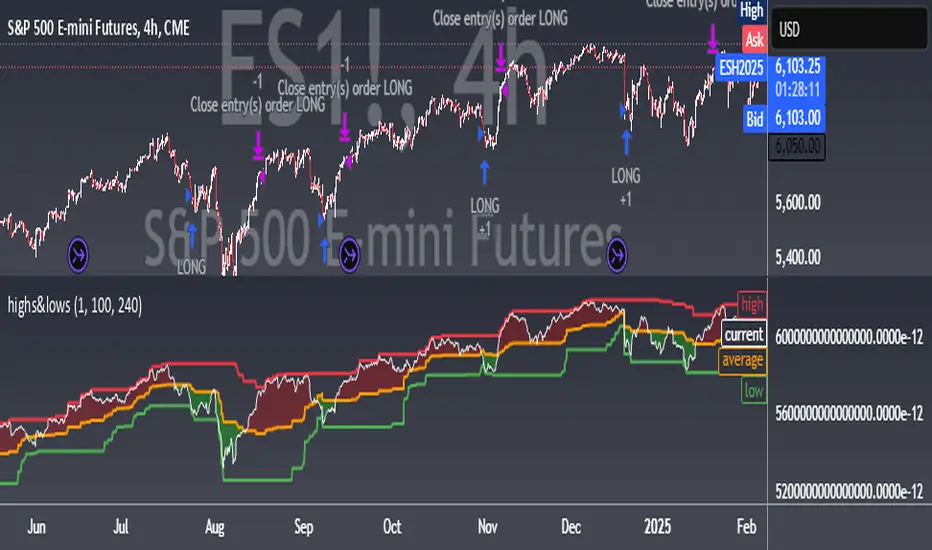
highs&lowsone of my first strategy: highs&lows
This strategy takes the highest high and the lowest low of a specified timeframe and specified bar count.
It will then takes the average between these two extremes to create a center line.
This creates a range of high middle and low.
Then the strategy takes the current market movement
which is the direct average(no specified timeframe and specified bar count) of the current high and low.
Using this "current market movement" within the range of high middle and low it determins when to buy and then sell the asset.
*********note***************
-this strategy is (bullish)
-works good with most futures assets that have volatility/ decent movement
(might add more details if I forget any)
(work in progress)
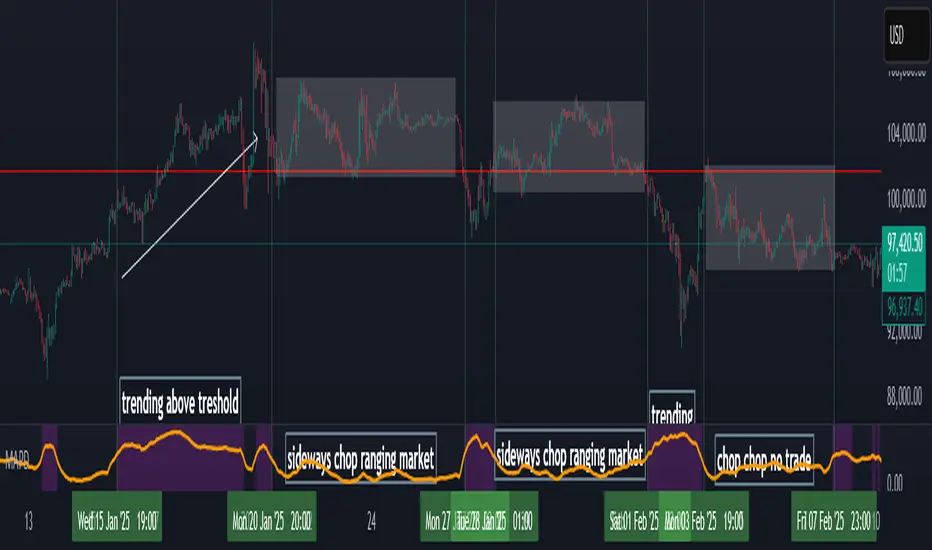
Zerg range filter credit to Kivanc turkish pinecoder for base indicator i reworked with chatgpt and some common sense
this indicator similar to the ADX but i think its better visually to keep you out of market conditions that are unfavorable.
i made original indicator to work in a 0-100 enviroment (before it was a zero middle line oscillator) and added background coloring that has a lower and higher threshold setting. i also added a smoothing moving average. this will trigger threshold levels (not the core oscillator)
above higher level would indicate trending market conditions and its purple. these are the areas where you might want to buy low period moving average bounces like 10 or 21 ema
lower band will paint indicator background blue and its cold, meaning range bound trade ideas are likely play out better. selling resistance and buying horizontal supports for example.
you are encourage to play with lookback period and change thresholds until you find something that works for your trading.
on the picture above it illustrates how i intended its usage.
it also shows divergences which was not intended but also a function.
you can also observe as the oscillator likes to coil up into a tight range (horizontal or a wedge formation) and when these break their trendlines explosive moves are incoming usually.
if you have a trading system and can generate a lot of signals but want to filter out some loser trades this could be the indicator you were looking for.
i hope this will be inline with community guidelines. my other publishing got removed unfortunately
Sma Indicator with Ratio (pr)SMA Indicator with Ratio (PR) is a technical analysis tool designed to provide insights into the relationship between multiple Simple Moving Averages (SMAs) across different time frames. This indicator combines three key SMAs: the 111-period SMA, 730-period SMA, and 1400-period SMA. Additionally, it introduces a ratio-based approach, where the 730-period SMA is multiplied by factors of 2, 3, 4, and 5, allowing users to analyze potential market trends and price movements in relation to different SMA levels.
What Does This Indicator Do?
The primary function of this indicator is to track the movement of prices in relation to several SMAs with varying periods. By visualizing these SMAs, users can quickly identify:
Short-term trends (111-period SMA)
Medium-term trends (730-period SMA)
Long-term trends (1400-period SMA)
Additionally, the multiplied versions of the 730-period SMA provide deeper insights into potential price reactions at different levels of market volatility.
How Does It Work?
The 111-period SMA tracks the shorter-term price trend and can be used for identifying quick market movements.
The 730-period SMA represents a longer-term trend, helping users gauge overall market sentiment and direction.
The 1400-period SMA acts as a very long-term trend line, giving users a broad perspective on the market’s movement.
The ratio-based SMAs (2x, 3x, 4x, 5x of the 730-period SMA) allow for an enhanced understanding of how the price reacts to higher or lower volatility levels. These ratios are useful for identifying key support and resistance zones in a dynamic market environment.
Why Use This Indicator?
This indicator is useful for traders and analysts who want to track the interaction of price with different moving averages, enabling them to make more informed decisions about potential trend reversals or continuations. The added ratio-based values enhance the ability to predict how the market might react at different levels.
How to Use It?
Trend Confirmation: Traders can use the indicator to confirm the direction of the market. If the price is above the 111, 730, or 1400-period SMA, it may indicate an uptrend, and if below, a downtrend.
Support/Resistance Levels: The multiplied versions of the 730-period SMA (2x, 3x, 4x, 5x) can be used as dynamic support or resistance levels. When the price approaches or crosses these levels, it might indicate a change in the trend.
Volatility Insights: By observing how the price behaves relative to these SMAs, traders can gauge market volatility. Higher multiples of the 730-period SMA can signal more volatile periods where price movements are more pronounced.

Moving Averages With Continuous Periods [macp]This script reimagines traditional moving averages by introducing floating-point period calculations, allowing for fractional lengths rather than being constrained to whole numbers. At its core, it provides SMA, WMA, and HMA variants that can work with any decimal length, which proves especially valuable when creating dynamic indicators or fine-tuning existing strategies.
The most significant improvement lies in the Hull Moving Average implementation. By properly handling floating-point mathematics throughout the calculation chain, this version reduces the overshoot tendencies that often plague integer-based HMAs. The result is a more responsive yet controlled indicator that better captures price action without excessive whipsaw.
The visual aspect incorporates a trend gradient system that can adapt to different trading styles. Rather than using fixed coloring, it offers several modes ranging from simple solid colors to more nuanced three-tone gradients that help identify trend transitions. These gradients are normalized against ATR to provide context-aware visual feedback about trend strength.
From a practical standpoint, the floating-point approach eliminates the subtle discontinuities that occur when integer-based moving averages switch periods. This makes the indicator particularly useful in systems where the MA period itself is calculated from market conditions, as it can smoothly transition between different lengths without artificial jumps.
At the heart of this implementation lies the concept of continuous weights rather than discrete summation. Traditional moving averages treat each period as a distinct unit with integer indexing. However, when we move to floating-point periods, we need to consider how fractional periods should behave. This leads us to some interesting mathematical considerations.
Consider the Weighted Moving Average kernel. The weight function is fundamentally a slope: -x + length where x represents the position in the averaging window. The normalization constant is calculated by integrating (in our discrete case, summing) this slope across the window. What makes this implementation special is how it handles the fractional component - when the length isn't a whole number, the final period gets weighted proportionally to its fractional part.
For the Hull Moving Average, the mathematics become particularly intriguing. The standard HMA formula HMA = WMA(2*WMA(price, n/2) - WMA(price, n), sqrt(n)) is preserved, but now each WMA calculation operates in continuous space. This creates a smoother cascade of weights that better preserves the original intent of the Hull design - to reduce lag while maintaining smoothness.
The Simple Moving Average's treatment of fractional periods is perhaps the most elegant. For a length like 9.7, it weights the first 9 periods fully and the 10th period at 0.7 of its value. This creates a natural transition between integer periods that traditional implementations miss entirely.
The Gradient Mathematics
The trend gradient system employs normalized angular calculations to determine color transitions. By taking the arctangent of price changes normalized by ATR, we create a bounded space between 0 and 1 that represents trend intensity. The formula (arctan(Δprice/ATR) + 90°)/180° maps trend angles to this normalized space, allowing for smooth color transitions that respect market volatility context.
This mathematical framework creates a more theoretically sound foundation for moving averages, one that better reflects the continuous nature of price movement in financial markets. The implementation recognizes that time in markets isn't truly discrete - our sampling might be, but the underlying process we're trying to measure is continuous. By allowing for fractional periods, we're creating a better approximation of this continuous reality.
This floating-point moving average implementation offers tangible benefits for traders and analysts who need precise control over their indicators. The ability to fine-tune periods and create smooth transitions makes it particularly valuable for automated systems where moving average lengths are dynamically calculated from market conditions. The Hull Moving Average calculation now accurately reflects its mathematical formula while maintaining responsiveness, making it a practical choice for both systematic and discretionary trading approaches. Whether you're building dynamic indicators, optimizing existing strategies, or simply want more precise control over your moving averages, this implementation provides the mathematical foundation to do so effectively.

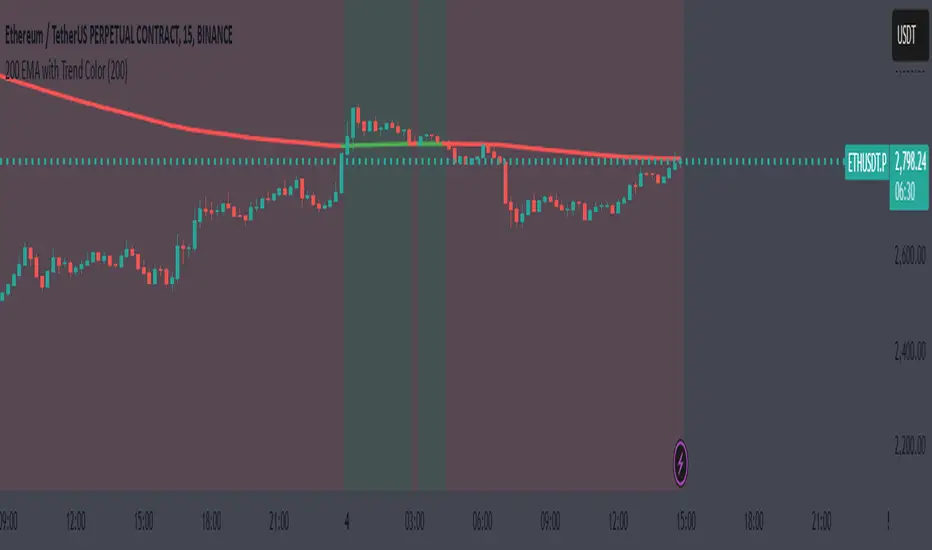
Dynamic 200 EMA with Trend-Based ColoringDescription:
This script plots the 200-period Exponential Moving Average (EMA) and dynamically changes its color based on the trend direction. The script helps traders quickly identify whether the price is above or below the 200 EMA, which is widely used as a long-term trend indicator.
How It Works:
The script calculates the 200 EMA based on the closing price.
If the price is above the EMA, it suggests a bullish trend, and the EMA line turns green.
If the price is below the EMA, it suggests a bearish trend, and the EMA line turns red.
An optional background color is added to enhance visual clarity, highlighting the current trend direction.
Use Cases:
Trend Confirmation: Helps traders determine if the overall trend is bullish or bearish.
Support and Resistance: The 200 EMA is often used as dynamic support/resistance.
Entry & Exit Signals: Traders can use crossovers with the 200 EMA as potential trade signals.
This script is designed for traders looking for a simple yet effective way to incorporate trend visualization into their charts. It is fully open-source and can be customized to fit individual trading strategies.
Swing Profile Analyzer [ChartPrime]Swing Profile Analyzer
The Swing Profile Analyzer is a comprehensive tool designed to provide traders with valuable insights into swing frequency profiles, enabling them to identify key price levels and areas of market interest.
⯁ KEY FEATURES
Swing Frequency Profiles
Automatically plots frequency profiles for each swing, highlighting price distribution and key levels of significance.
Point of Control (POC) Line
Marks the price level with the highest number of closes within a swing, acting as a key area for potential price reactions.
Customizable Trend Display
Allows users to toggle between displaying profiles for bullish swings, bearish swings, or both, offering tailored analysis.
Integrated ZigZag Lines
Visualizes swing highs and lows, providing a clear picture of market trends and reversals.
Dynamic Profile Visualization
Profiles are color-coded to indicate the frequency of closes, with the highest value bins distinctly marked for easy recognition.
Max Frequency Highlight
Displays numerical values for the most active price level within each profile, showing how many closes occurred at the peak bin.
Updates only after swing formed
Profiles and POC lines automatically appear after swing is done
⯁ HOW TO USE
Identify Critical Price Levels
Use the POC line and frequency distribution to locate levels where price is likely to react or consolidate.
Analyze Swing Characteristics
Observe swing profiles to understand the strength, duration, and behavior of market trends.
Plan Entries and Exits
Leverage significant price levels and high-frequency bins to make more informed trading decisions.
Focus on Specific Trends
Filter profiles to analyze bullish or bearish swings based on your trading strategy.
⯁ CONCLUSION
The Swing Profile Analyzer is an essential tool for traders seeking to understand price dynamics within market swings. By combining frequency profiles, POC levels, and trend visualization, it enhances your ability to interpret and act on market movements effectively.

High-Probability IndicatorExplanation of the Code
Trend Filter (EMA):
A 50-period Exponential Moving Average (EMA) is used to determine the overall trend.
trendUp is true when the price is above the EMA.
trendDown is true when the price is below the EMA.
Momentum Filter (RSI):
A 14-period RSI is used to identify overbought and oversold conditions.
oversold is true when RSI ≤ 30.
overbought is true when RSI ≥ 70.
Volatility Filter (ATR):
A 14-period Average True Range (ATR) is used to measure volatility.
ATR is multiplied by a user-defined multiplier (default: 2.0) to set a volatility threshold.
Ensures trades are only taken during periods of sufficient volatility.
Entry Conditions:
Long Entry: Price is above the EMA (uptrend), RSI is oversold, and the candle range exceeds the ATR threshold.
Short Entry: Price is below the EMA (downtrend), RSI is overbought, and the candle range exceeds the ATR threshold.
Exit Conditions:
Take Profit: A fixed percentage above/below the entry price.
Stop Loss: A fixed percentage below/above the entry price.
Visualization:
The EMA is plotted on the chart.
Background colors highlight uptrends and downtrends.
Buy and sell signals are displayed as labels on the chart.
Alerts:
Alerts are triggered for buy and sell signals.
How to Use the Indicator
Trend Filter:
Only take trades in the direction of the trend (e.g., long in an uptrend, short in a downtrend).
Momentum Filter:
Look for oversold conditions in an uptrend for long entries.
Look for overbought conditions in a downtrend for short entries.
Volatility Filter:
Ensure the candle range exceeds the ATR threshold to avoid low-volatility trades.
Risk Management:
Use the built-in take profit and stop loss levels to manage risk.
Optimization Tips
Backtesting:
Test the indicator on multiple timeframes and assets to evaluate its performance.
Adjust the input parameters (e.g., EMA length, RSI length, ATR multiplier) to optimize for specific markets.
Combination with Other Strategies:
Add additional filters, such as volume analysis or support/resistance levels, to improve accuracy.
Risk Management:
Use proper position sizing and risk-reward ratios to maximize profitability.
Disclaimer
No indicator can guarantee an 85% win ratio due to the inherent unpredictability of financial markets. This script is provided for educational purposes only. Always conduct thorough backtesting and paper trading before using any strategy in live trading.
Let me know if you need further assistance or enhancements!

High-Low Breakout Strategy with ATR traling Stop LossThis script is a TradingView Pine Script strategy that implements a High-Low Breakout Strategy with ATR Trailing Stop.created by SK WEALTH GURU, Here’s a breakdown of its key components:
Features and Functionality
Custom Timeframe and High-Low Detection
Allows users to select a custom timeframe (default: 30 minutes) to detect high and low levels.
Tracks the high and low within a user-specified period (e.g., first 30 minutes of the session).
Draws horizontal lines for high and low, persisting for a specified number of days.
Trade Entry Conditions
Long Entry: If the closing price crosses above the recorded high.
Short Entry: If the closing price crosses below the recorded low.
The user can choose to trade Long, Short, or Both.
ATR-Based Trailing Stop & Risk Management
Uses Average True Range (ATR) with a multiplier (default: 3.5) to determine a dynamic trailing stop-loss.
Trades reset daily, ensuring a fresh start each day.
Trade Execution and Partial Profit Taking
Stop-loss: Default at 1% of entry price.
Partial profit: Books 50% of the position at 3% profit.
Max 2 trades per day: If the first trade hits stop-loss, the strategy allows one re-entry.
Intraday Exit Condition
All positions close at 3:15 PM to ensure no overnight risk.

Quantitative Breakout Bands (AIBitcoinTrend)Quantitative Breakout Bands (AIBitcoinTrend) is an advanced indicator designed to adapt to dynamic market conditions by utilizing a Kalman filter for real-time data analysis and trend detection. This innovative tool empowers traders to identify price breakouts, evaluate trends, and refine their trading strategies with precision.
👽 What Are Quantitative Breakout Bands, and Why Are They Unique?
Quantitative Breakout Bands combine advanced filtering techniques (Kalman Filters) with statistical measures such as mean absolute error (MAE) to create adaptive price bands. These bands adjust to market conditions dynamically, providing insights into volatility, trend strength, and breakout opportunities.
What sets this indicator apart is its ability to incorporate both position (price) and velocity (rate of price change) into its calculations, making it highly responsive yet smooth. This dual consideration ensures traders get reliable signals without excessive lag or noise.
👽 The Math Behind the Indicator
👾 Kalman Filter Estimation:
At the core of the indicator is the Kalman Filter, a recursive algorithm used to predict the next state of a system based on past observations. It incorporates two primary elements:
State Prediction: The indicator predicts future price (position) and velocity based on previous values.
Error Covariance Adjustment: The process and measurement noise parameters refine the prediction's accuracy by balancing smoothness and responsiveness.
👾 Breakout Bands Calculation:
The breakout bands are derived from the mean absolute error (MAE) of price deviations relative to the filtered trendline:
float upperBand = kalmanPrice + bandMultiplier * mae
float lowerBand = kalmanPrice - bandMultiplier * mae
The multiplier allows traders to adjust the sensitivity of the bands to market volatility.
👾 Slope-Based Trend Detection:
A weighted slope calculation measures the gradient of the filtered price over a configurable window. This slope determines whether the market is trending bullish, bearish, or neutral.
👾 Trailing Stop Mechanism:
The trailing stop employs the Average True Range (ATR) to calculate dynamic stop levels. This ensures positions are protected during volatile moves while minimizing premature exits.
👽 How It Adapts to Price Movements
Dynamic Noise Calibration: By adjusting process and measurement noise inputs, the indicator balances smoothness (to reduce noise) with responsiveness (to adapt to sharp price changes).
Trend Responsiveness: The Kalman Filter ensures that trend changes are quickly identified, while the slope calculation adds confirmation.
Volatility Sensitivity: The MAE-based bands expand and contract in response to changes in market volatility, making them ideal for breakout detection.
👽 How Traders Can Use the Indicator
👾 Breakout Detection:
Bullish Breakouts: When the price moves above the upper band, it signals a potential upward breakout.
Bearish Breakouts: When the price moves below the lower band, it signals a potential downward breakout.
The trailing stop feature offers a dynamic way to lock in profits or minimize losses during trending moves.
👾 Trend Confirmation:
The color-coded Kalman line and slope provide visual cues:
Bullish Trend: Positive slope, green line.
Bearish Trend: Negative slope, red line.
👽 Why It’s Useful for Traders
Dynamic and Adaptive: The indicator adjusts to changing market conditions, ensuring relevance across timeframes and asset classes.
Noise Reduction: The Kalman Filter smooths price data, eliminating false signals caused by short-term noise.
Comprehensive Insights: By combining breakout detection, trend analysis, and risk management, it offers a holistic trading tool.
👽 Indicator Settings
Process Noise (Position & Velocity): Adjusts filter responsiveness to price changes.
Measurement Noise: Defines expected price noise for smoother trend detection.
Slope Window: Configures the lookback for slope calculation.
Lookback Period for MAE: Defines the sensitivity of the bands to volatility.
Band Multiplier: Controls the band width.
ATR Multiplier: Adjusts the sensitivity of the trailing stop.
Line Width: Customizes the appearance of the trailing stop line.
Disclaimer: This indicator is designed for educational purposes and does not constitute financial advice. Please consult a qualified financial advisor before making investment decisions.

Choppiness IndexThis Pine Script v6 indicator calculates the Choppiness Index over a user-defined length and segments it based on user-defined thresholds for choppy and trending market conditions. The indicator allows users to toggle the visibility of choppy, trending, and neutral segments using checkboxes.
Here's how it works:
Inputs: Users can set the length for the Choppiness Index calculation and thresholds for choppy and trending conditions. They can also choose which segments to display.
Choppiness Index Calculation: The script calculates the Choppiness Index using the ATR and the highest-high and lowest-low over the specified length.
Segment Determination: The script determines which segment the current Choppiness Index value falls into based on the thresholds. The color changes exactly at the threshold values.
Dynamic Plotting: The Choppiness Index is plotted with a color that changes based on the segment. The plot is only visible if the segment is "turned on" by the user.
Threshold Lines: Dashed horizontal lines are plotted at the choppy and trending thresholds for reference.
This indicator helps traders visualize market conditions and identify potential transitions between choppy and trending phases, with precise color changes at the threshold values.

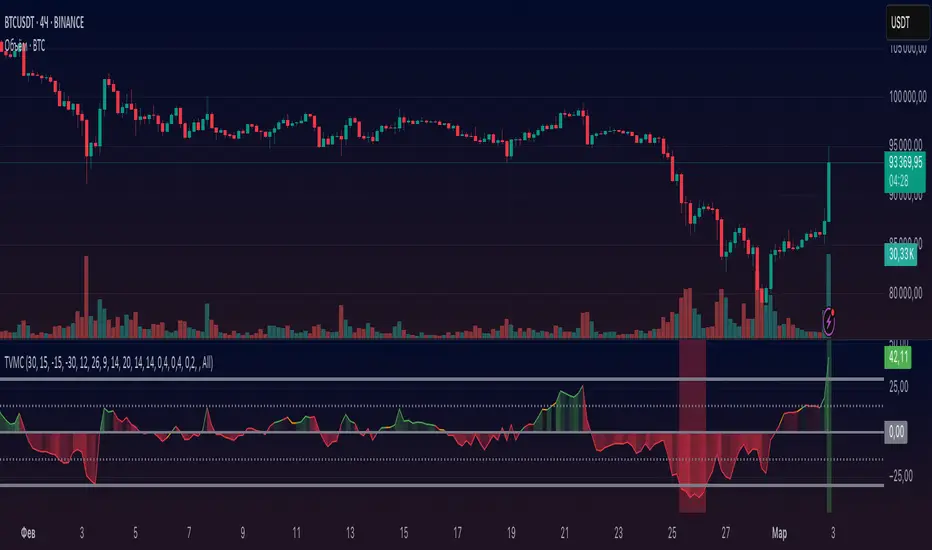
TVMC - Composite Indicator with Technical RatingsDescription:
The TVMC (Trend, Volume, Momentum, Composite) indicator is a powerful multi-component tool designed to provide traders with a comprehensive understanding of market conditions. By combining four essential technical analysis components—trend, momentum, volume, and volatility—this indicator offers clear and actionable insights to assist in decision-making.
Key Features:
1. Trend Component (TC):
* Based on MACD (Moving Average Convergence Divergence), this component analyzes the relationship between two exponential moving averages (fast and slow) to determine the prevailing market trend.
* The MACD signal is normalized to a range of -1 to +1 for consistency and clarity.
2. Momentum Component (MC):
* Utilizes RSI (Relative Strength Index) to measure the strength and speed of price movements.
* This component highlights overbought or oversold conditions, which may indicate potential market reversals.
3. Volume Confirmation (VC):
* Compares the current trading volume to its moving average over a specified period.
* High volume relative to the average confirms the validity of the current trend.
4. Volatility Filter (VF):
* Uses ATR (Average True Range) to gauge market volatility.
* Adjusts and smooths signals to reduce noise during periods of high volatility.
5. Technical Ratings Integration:
* Incorporates TradingView’s Technical Ratings, allowing users to validate signals using moving averages, oscillators, or a combination of both.
* Users can choose their preferred source of ratings for enhanced signal confirmation.
How It Works:
The TVMC indicator combines the weighted contributions of the Trend, Momentum, and Volume components, further refined by the Volatility Filter. Each component plays a specific role:
* Trend: Identifies whether the market is bullish, bearish, or neutral.
* Momentum: Highlights the strength of price action.
* Volume: Confirms whether the current price action is supported by sufficient trading activity.
* Volatility: Filters out excessive noise in volatile market conditions, providing a smoother and more reliable output.
Visualization:
1. Bullish Signals:
* The indicator line turns green and remains above the zero line, indicating upward momentum.
2. Bearish Signals:
* The indicator line turns red and falls below the zero line, signaling downward momentum.
3. Neutral Signals:
* The line is orange and stays near zero, indicating a lack of strong trend or momentum.
4. Zones:
* Horizontal lines at +30 and -30 mark strong bullish and bearish zones, respectively.
* A zero line is included for clear separation between bullish and bearish signals.
Recommended Usage:
* Best Timeframes: The indicator is optimized for higher timeframes such as 4-hour (H4) and daily (D1) charts.
* Trading Style: Suitable for swing and positional trading.
* Customization: The indicator allows users to adjust all major parameters (e.g., MACD, RSI, volume, and ATR settings) to fit their trading preferences.
Customization Options:
* Adjustable weights for Trend, Momentum, and Volume components.
* Fully configurable settings for MACD, RSI, Volume SMA, and ATR periods.
* Timeframe selection for multi-timeframe analysis.
Important Notes:
1. Originality: The TVMC indicator combines multiple analysis methods into a unique framework. It does not replicate or minimally modify existing indicators.
2. Transparency: The description is detailed enough for users to understand the methodology without requiring access to the code.
3. Clarity: The indicator is explained in a way that is accessible even to users unfamiliar with complex technical analysis tools.
Compliance with TradingView Rules:
* The indicator is written in Pine Script version 5, adhering to TradingView’s language standards.
* The description is written in English to ensure accessibility to the global community, with a clear explanation of all components and functionality.
* No promotional content, links, or unrelated references are included.
* The chart accompanying the indicator is clean and demonstrates its intended use clearly, with no additional indicators unless explicitly explained.