Trading Sessions v.2 - Max WarrenUpdated to work with Pine updates:
London DST timezone still broken. Will fix later.
As always full customization visually, with London fix I'll add more options.
Keep in mind the render resolution option
Timeframe

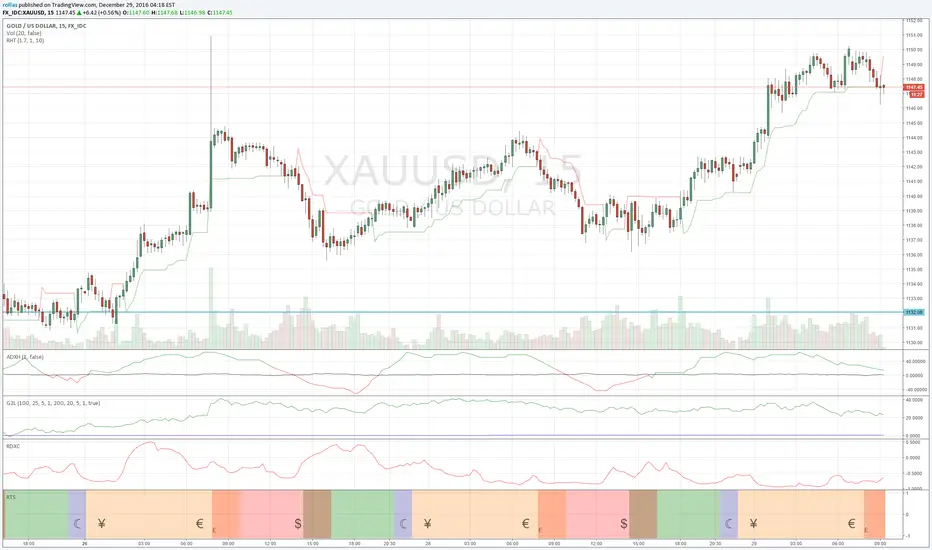
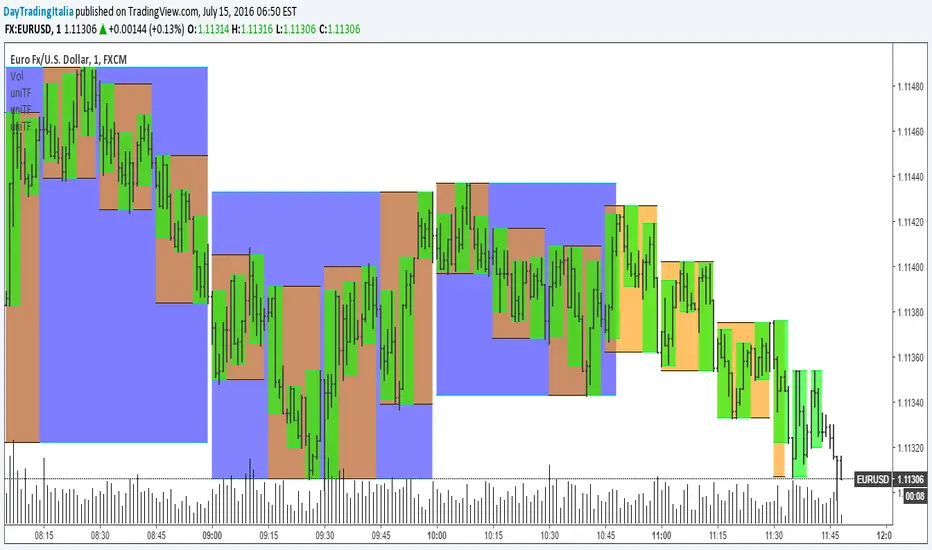
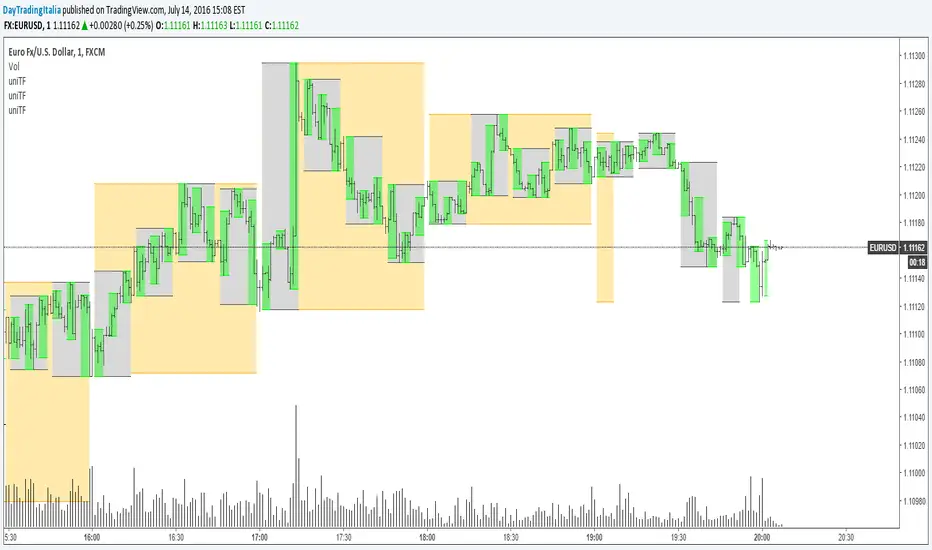
Dynamic Support/Resistance Zones Multi-ResSimple support and resistance areas. The threshold parameter determines the sensibility. It works better if volume data is good.
Remember to refresh the script once in awhile when applied to lower resolutions.
//std1243cf0

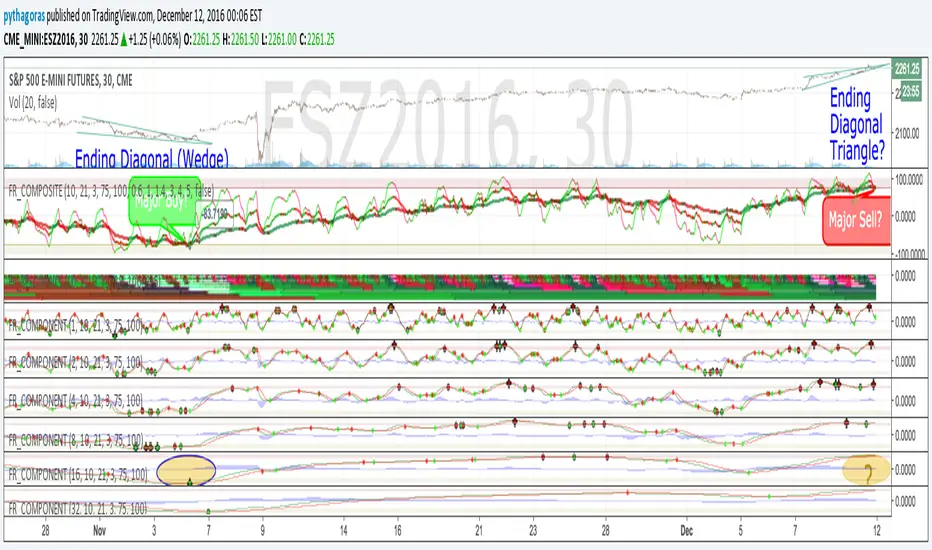
Fractal Quad Components8 Fractal Resonance Component indicators on a chart eats up LOTS of vertical space, so we're providing this Fractal Quad Components script to group 4 components a bit more compactly (eliminating the margin whitespace between indicator rows).
To view 8 components you'll need to add a second instance of this script to your chart and set its Base Timescale Multiplier to 16. Then grab the dividers to stretch both instances to a good viewing height.
One disadvantage of this grouping method is that to read off the x2, x4, and x8 lead and lag line values, you'll need to mentally add 200, 400 or 600 respectively.
We also replaced the "Extreme" > +-100% black crosses (+) with more subtle purple circle outlines. These extreme crosses are often (but not always) too early to be a major reversal so it's best not to overemphasize them.
Significant crosses (> +-75%) are still highlighted with black circle outlines, and are the most likely to be major reversals for buy/sell.
Note how the 30-minute oscillator (2nd row) showed the cleanest (black-outlined) reversals on the S&P for the last week of 2016, with just a bit more profit-eating lag than the 15-minute oscillator above.


cooltoyz: ghost candleThis is a tool. Do with it what you like :)
The ghost candle works by drawing a bigger time frame candles in ghost mode over a chart. The time frame is default of 4h, can be changed in the "format" pop-up.
What we see in a time frame as the "wick", is really a set of candles when looked at lower resolutions/timeframes, that info is crunched into the OHLC format. But, when we look at a represntation of the "internals" of a candle, the wicks are not just a single candle that "walked out of the reservation".
So, in this ghost mode, a wick makes no sense visually. In this case, the OHLC is represented as a darker area for the main candle body, and lighter zones for the wicks. Just another way to sing the same song...
Note 1: the ghost candles are skewed, due to the way that TV plots a line. It's most visible when a chart is very zoomed.
Note 2:As result of the TV real time engine, the last candle presents sometimes mixed colors. There's no easy way to fix it, so until the candle closes, if you see weird colors, well, that's life :)

EMA Time-FrameThis EMA allows you to specify a time-frame for the price used to calculate the moving average. For example, you can create 1 hour EMAs on your 5 minute chart.
NOTE: This indicator only works on intraday charts. The time-frame specified for the indicator must be greater than or equal to the time-frame of the chart.

Fractal Resonance CompositeFractal Resonance Composite compresses 8 timescales of stochastic oscillators into just 3 color-coded composite lines: fast, medium and slow. Fast emphasizes the shorter timescale oscillators, medium considers all 8 timescales evenly, and slow emphasizes the longer timeframe oscillators. The composite lines indicate how overbought/sold the market is relative to the size of its recent movements. Major buys occur when all three composites enter the Oversold (green shaded) range and turn up, and major sells when all three reach the Overbought (red shaded) range and turn down. The fast line's quicker reversals and exaggerated alternations on smaller price moves makes it more fit for scalping. Notice the fast and medium lines tend to snap back toward the slow line like stretched rubber bands.
As is particularly apparent in the slow line, the nifty mathematics of the compositing process reconstruct the topology (peaks and valleys) of the underlying price curve in a smoothly distorted "cartoon" form that has a very useful property: the composite lines are confined to +-100% Extreme Overbought/sold oscillatory ranges. (By definition, only extremely rare "parabolic" moves can push all 3 composites beyond +-100%). If we knew that price would always stay confined to a certain range, trading would be much easier, no? Always buy the bottom of the range and sell the top!
How it works
To understand what's behind this nifty property, consider the mathematics of LazyBear's WaveTrend port .
The formula is fairly simple as indicators go yet statistically fundamental in a way that suggests it should have been the grandfather of all market stochastic oscillators. It's just a running average of the ratio:
(price's current deviation from it's mean)
-----------------------------------------------------------
(running average of absolute |price deviation from the mean| )
In formal statistics notation this is written:
E{ (X - E{X}) / E{|X-E{X}|} }
Where X is the price random variable and E{} the averaging or Expectation operator, implemented in this oscillator as exponential moving averages.
Conceptually, the denominator measures and normalizes by the typical size of recent price moves. This normalization process is what stretches or compresses the local price movements such that the whole composite curve can stay within the oscillatory range.
Attributes
The default fast=.6, medium=1, slow=1.4 compositing factors give each line visually distinct behavior, but can be tweaked to emphasize different oscillator "speeds".
Particular lines can be disabled by setting their line width to 0.


Inside Bars Multiple Time Frames ColorHello, this is just a script that helps to identify "inside bars" on the current time frame or a higher one, by coloring them with the selected color.

VWAP MTF Custom Dates (Multi Timeframe VWAP with Custom Dates)This is extremely useful tool for analyzing the market. Brian Shannon from alphatrends.net uses this very frequently and I've programmed it for tradingview.
you can calculate the VWAP from any dates on the chart and it works with any intraday timeframe. Simply select on the settings icon and select your day month and year parameters!
Please follow for more future updates
Happy trading!
Daniel
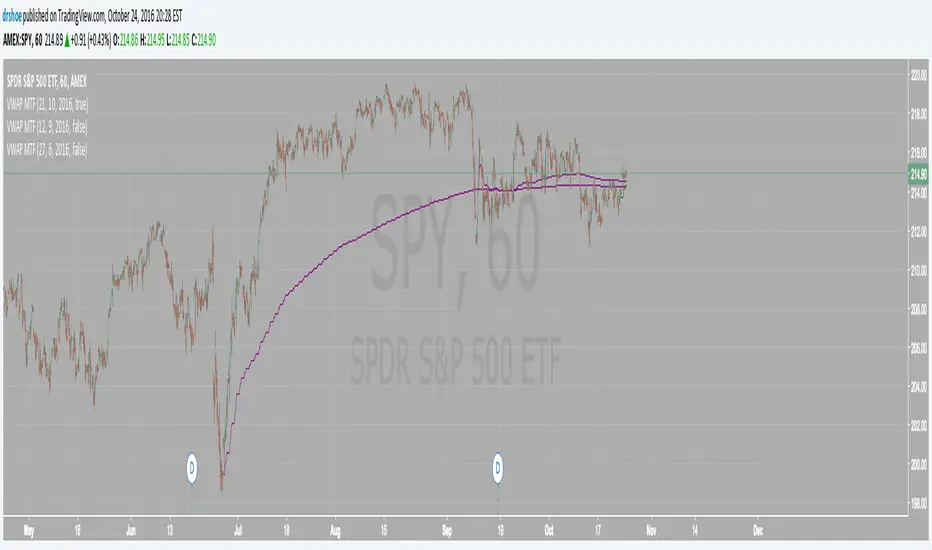
Multi Time Frame Compatible Simple Moving AverageDisplays 5, 20, 50, and 200 days moving averages on any chart regardless of the chart's resolution.It makes sure you see the same moving average regardless the resolution of your chart or your timeframe

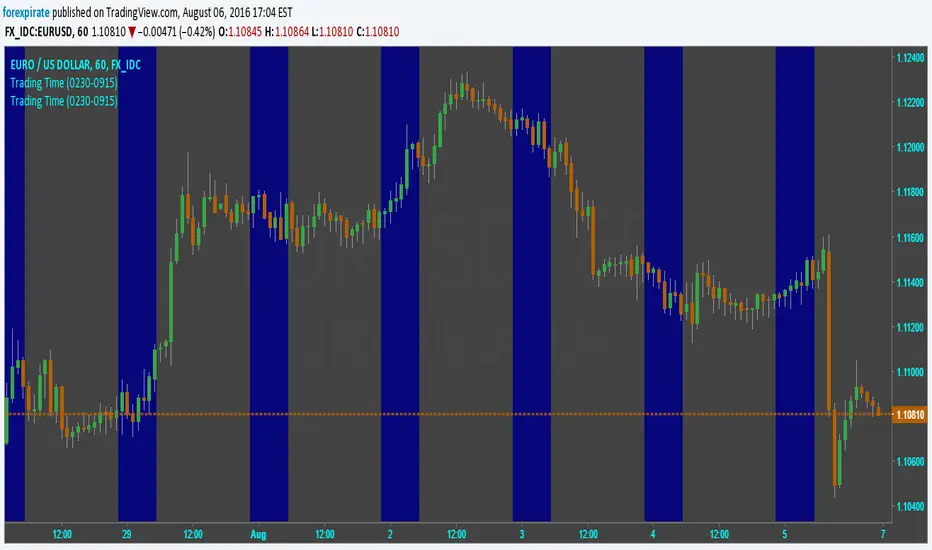
Trading TimeCode put blue bars during times you input. I put it to show times I am asleep and not alert to trade. I also put code into strategy to control when trades can open or close. FXCM and IDC exchanges have different time zones, as well as AMEX, etc. You will have to change it for each zone.
Universal Time Frame v1.1Now it should work better but is only for intraday charts. There are some other glitches though; I'll try to fix them as soon as possible.
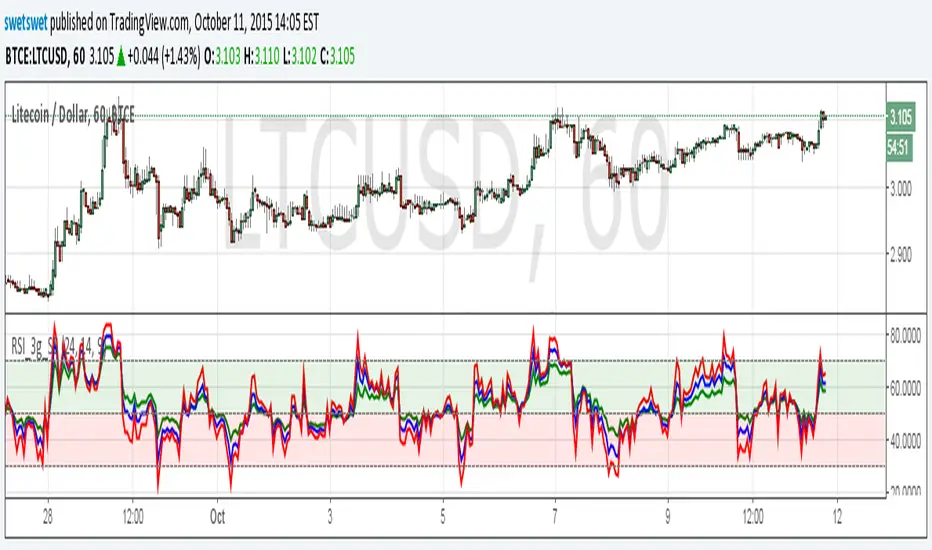
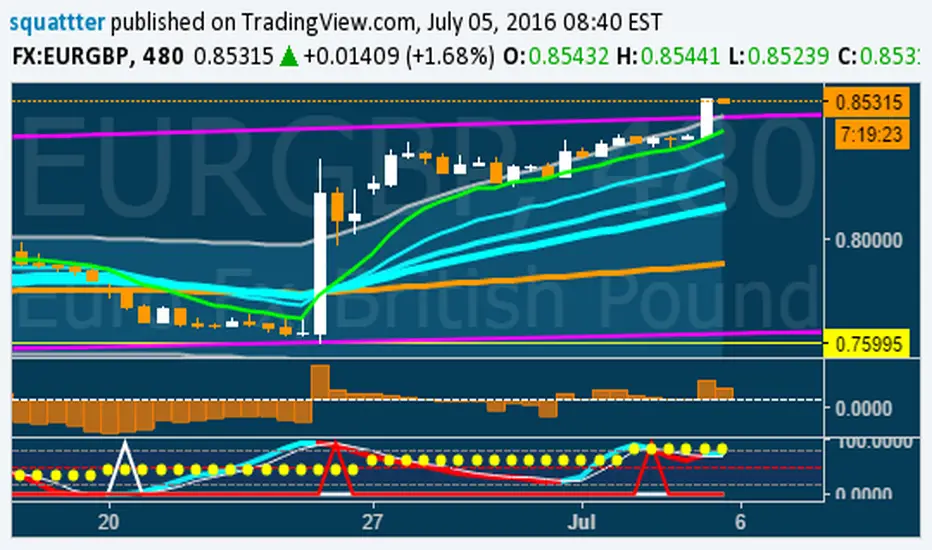
Stochastic CCI MTF w/ UP/DOWN colours - squattterStoch CCI has a nicer divergence than Stoch RSI.
Enjoy!
Stochastic CCI MTF w/ UP/DOWN colours - squattterStoch CCI has nicer divergences than Stoch RSI.
Enjoy.

Super StochThis is a multi-time frame Stoch RSI based on Chris Moody's "CM_Stochastic_MTF". Changes are primarily cosmetic and the "stock" signal and Stoch RSI calculations are retained.

EMA bullish/bearish dashboard - MTFThis is a good reminder for which way you should be placing orders.
It's best to not ignore these signals!!!
lime = full bull - 100ema above 200ema and price is above 200ema
green = hallf bull - price now below 200ema but 100ema is still above the 200
maroon = full bear - opposite of full bull
red = half bear - opposite of half bull
Also with multi timeframe option - so I guess you could stack several of these on a single framed chart if you wanted.

Forex Trading Sessions with Daylight Savings TimeV1 - Max WarrenDifferent version of the CM one but everything is configurable and easy to manage.
Daylight savings may also be toggled, I cannot automatically toggle it yet but hopefully with a pine update I will be able to.
It had the four main sessions but version two could possibly have all of them as optional toggles
Hope it is useful