Multi-Timeframe SMA Plot**Introducing the Multi-Timeframe SMA Plot**
This script is designed to help traders easily visualize multiple Simple Moving Averages (SMAs) across different timeframes, all on a single chart. The Multi-Timeframe SMA Plot allows you to configure up to three different SMAs with customizable lengths, timeframes, colors, line styles, and line thicknesses, providing a versatile tool to analyze market trends in various granularities.
**Key Features**:
1. **Multiple SMA Timeframes**: You can plot SMAs from different timeframes like 15 minutes, 1 hour, daily, weekly, and more, enabling a comprehensive perspective of market movements.
2. **Fully Customizable**: Each SMA comes with options to adjust the length, timeframe, color, line style (solid, dashed, or dotted), and thickness, giving you control over how you visualize trend data.
3. **User-Friendly Inputs**: The script provides intuitive input fields that make it easy to adjust the settings without diving into the code, making it suitable for both beginner and advanced traders.
**How to Use**:
- Select the desired length and timeframe for each SMA (e.g., 50-period SMA on a 1-hour chart).
- Customize the line style and color to match your chart's theme or make distinctions between each SMA.
- Analyze how different SMAs align or cross over time to identify potential support, resistance, or trend changes.
The Multi-Timeframe SMA Plot is ideal for traders who rely on moving averages to gauge trend strength, direction, and potential entry or exit points. By having multiple SMAs from different timeframes on one chart, you can better understand the overall market sentiment and make more informed decisions.
Give this script a try and streamline your technical analysis with clear, customizable SMA lines!
**Code**: Check out the full script and start customizing it to fit your trading style. Your feedback is always welcome!
แนวรับและแนวต้าน

Ping Pong Bot StrategyOverview:
The Ping Pong Bot Strategy is designed for traders who focus on scalping and short-term opportunities using support and resistance levels. This strategy identifies potential buy entries when the price reaches a key support area and shows bullish momentum (a green bar). It aims to capitalize on small price movements with predefined risk management and take profit levels, making it suitable for active traders looking to maximize quick trades in trending or ranging markets.
How It Works:
Support & Resistance Calculation:
The strategy dynamically identifies support and resistance levels using the lowest and highest price points over a user-defined period. These levels help pinpoint potential price reversal areas, guiding traders on where to enter or exit trades.
Buy Entry Criteria:
A buy signal is triggered when the closing price is at or below the support level, and the bar is green (i.e., the closing price is higher than the opening price). This ensures that entries are made when prices show signs of upward momentum after hitting support.
Risk Management:
For each trade, a stop loss is calculated based on a user-defined risk percentage, helping to protect against significant drawdowns. Additionally, a take profit level is set at a ratio relative to the risk, ensuring a disciplined approach to exit points.
0.5% Take Profit Target:
The strategy also includes a 0.5% quick take profit target, indicated by an orange arrow when reached. This feature helps traders lock in small gains rapidly, making it ideal for volatile market conditions.
Customizable Inputs:
Length: Adjusts the period for calculating support and resistance levels.
Risk-Reward Ratio: Allows traders to set the desired risk-to-reward ratio for each trade.
Risk Percentage: Defines the risk tolerance for stop loss calculations.
Take Profit Target: Enables the customization of the quick take profit target.
Ideal For:
Traders who prefer an active trading style and want to leverage support and resistance levels for precise entries and exits. This strategy is particularly useful in markets that experience frequent price bounces between support and resistance, allowing traders to "ping pong" between these levels for profitable trades.
Note:
This strategy is developed mainly for the 5-minute chart and has not been tested on longer time frames. Users should perform their own testing and adjustments if using it on different time frames.

Chandelier Exit Pro w/ExtensionsChandelier Exit Pro w/Extensions
The Chandelier Exit Pro w/Extensions indicator is designed to assist traders in managing risk and identifying trend reversals. The strategy is based on the Chandelier Exit concept, originally created by Charles Le Beau. It uses the Average True Range (ATR) to calculate dynamic stop levels that adjust based on market volatility. This script not only implements the standard Chandelier Exit, but also introduces extension levels and alerts to enhance decision-making.
Key Features:
➡️Dynamic Stop Levels: The indicator calculates stop levels for both long and short positions based on an ATR multiple. This allows traders to determine exit points by monitoring when the price crosses above or below these levels. These levels adapt in real-time based on price volatility, making them a versatile tool for trend-following strategies.
➡️Extension Levels: In addition to the primary stop levels, the script includes extension levels for more advanced stop-loss management. Traders can view active and extension levels separately, providing more flexibility in their exit strategies.
➡️Labels and Visual Cues: The indicator provides dynamic labels that automatically update and follow the plotted stop levels. Labels include the ATR multiplier value (e.g., "2.5" or "2.5ext"), clearly showing the significance of each level. When price crosses below or above a level, the corresponding label is highlighted, aiding traders in quickly identifying the most relevant stop level.
➡️Bar Confirmation and Alerts: The script includes an "await bar confirmation" option to ensure that the stop levels and alerts only trigger after the bar has closed. Alerts are customizable and will notify traders when price crosses critical levels, helping to make timely decisions without the need to constantly monitor charts.
➡️Multiple ATR Levels for Enhanced Precision: The indicator supports up to four different ATR levels, each with customizable multipliers. This allows traders to set different thresholds for exits based on varying degrees of volatility. For example, Level 1 (2.5x ATR) might represent a tighter stop, while Level 4 (10x ATR) could serve as a wider stop for long-term positions.
➡️Calc_bars_count: Improves efficiency of the indicator by reducing the on-chart calculations in to the past. This input can be found at the bottom of the INPUTS tab.
How it Helps Traders:
💥Trend Identification: By using the Chandelier Exit levels, traders can identify when the trend is likely to reverse. When the price crosses below the stop level in a long trade or above the stop level in a short trade, it signals a potential exit point.
💥Volatility-based Adjustments: Unlike static stop-loss methods, the ATR-based stop levels dynamically adjust based on the market’s volatility. This means tighter stops during low volatility periods and wider stops during high volatility periods, reducing the chance of being stopped out prematurely.
💥Risk Management: The dynamic stop levels and extension levels provide a structured way to manage risk. Traders can set tighter stops for short-term trades and wider stops for longer-term trades. The script's visual labels make it easy to track these levels in real-time.
💥Automation with Alerts: The built-in alert system ensures that traders are notified when key levels are crossed. This helps to avoid emotional decision-making and allows for better execution of trading strategies.
Confluence and Price Fluidity:
One of the powerful ways to enhance the effectiveness of the Chandelier Exit indicator is by using it in conjunction with other technical analysis tools to create confluence. Confluence occurs when multiple indicators or price action signals align, providing stronger confirmation for a trade decision. For example:
🎯Support and Resistance Levels: Traders can use the Chandelier Exit levels in combination with key support and resistance zones. If the price is nearing a support level and the Chandelier Exit signals a bullish reversal, this alignment strengthens the case for entering a long position.
🎯Moving Averages: When the Chandelier Exit signals a trend reversal and this is confirmed by a crossover in moving averages (such as a 50-day and 200-day moving average), traders gain additional confidence in the trade direction.
🎯Momentum Indicators: Traders can also look for momentum indicators like RSI or MACD to confirm the strength of a trend or potential reversal. For instance, if the Chandelier Exit triggers a short signal and the RSI also shows overbought conditions, this could provide stronger confirmation to exit a long trade or enter a short position.
🎯Candlestick Patterns: Price fluidity can be monitored using candlestick formations. For example, a bearish engulfing pattern near a Chandelier Exit resistance level offers confluence, adding confidence to the signal to close or short the trade.
By combining the Chandelier Exit with other tools, traders ensure that they are not relying on a single indicator. This layered approach can reduce the likelihood of false signals and improve overall trading accuracy.
Practical Use Case:
Imagine a trader enters a long position, and the price moves favorably. Using the Chandelier Exit, the trader sets the initial stop level at 2.5x ATR below the highest close. As the price continues to rise, the stop level follows the price, locking in profits. If the market suddenly turns, the price crossing below the stop level signals an exit, helping the trader preserve gains. With extension levels, the trader can further refine exits, adjusting based on their risk tolerance and market conditions.
Good luck and I hope that you can find a place in your tool bag to use this dynamic indicator 🙏

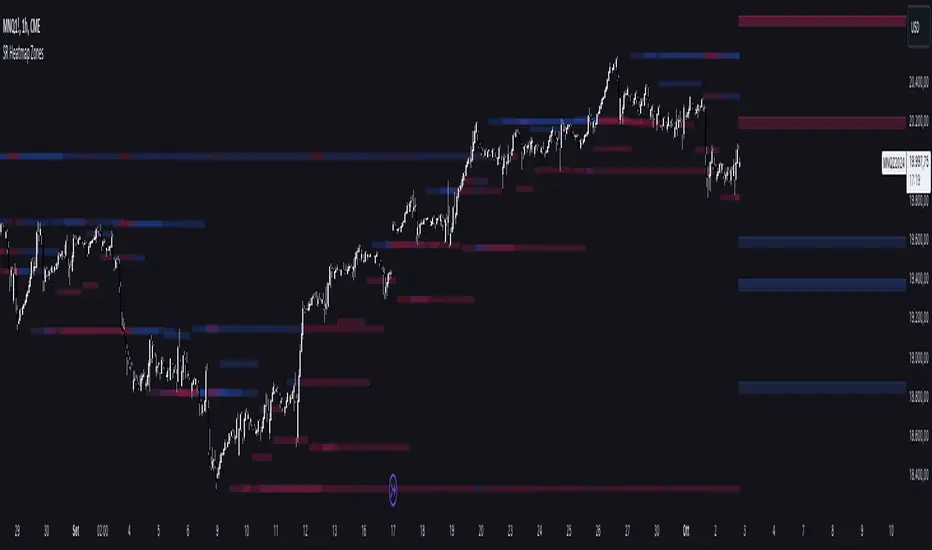
Liquidity Pools [LuxAlgo]The Liquidity Pools indicator identifies and displays estimated liquidity pools on the chart by analyzing high and low wicked price areas, along with the amount, and frequency of visits to each zone.
🔶 USAGE
Liquidity Pools are areas where smaller participants are likely to place stop-limit orders to manage risks at reasonable swing points. These zones attract institutional traders who use the pending orders as liquidity to enter larger positions, aiming to influence price movements. By monitoring these zones, traders can anticipate market movements and potentially benefit from these dynamics.
Beyond general liquidity theory, identifying zones consistently visited by price aids in using them as support and resistance zones. By analyzing these areas, we can assess how effectively participants enter or exit these zones, helping to gauge their importance.
In the screenshots below, we will explore both sides of the same chart in more detail to display how each zone could be viewed from a bullish and bearish perspective.
Bullish Zones Example:
Bearish Zones Example:
🔶 DETAILS
The method behind this indicator focuses on identifying a swing point and tracking future interactions with it. It adaptively identifies high and low "potential zones". These zones are monitored over time; if a zone meets the user-defined criteria, the script marks and displays these zones on the chart.
🔹 Identification
The method to identify Liquidity Pools in this indicator revolves around 3 main parameters. By utilizing these settings, the indicator can be tailored to produce zones that fit the specific strategic needs of each trader.
Zone Identification Parameters
Zone Contact Amount: This setting determines the number of times each zone must be in contact with the price (and bought or sold out of) before being identified by the indicator as a Liquidity Pool.
For example: When a zone is first displayed, it is considered as having been reached 1 time. When the zone is re-tested for the first time, this is considered the 2nd contact, since the price has seen the zone a total of 2 times.
Bars Required Between Each Contact: This is used to rule out (or in) consecutive candles reaching each zone from the calculation, adding a separation length between zone contact points to refine the zones produced.
For example: When set to "2", the first contact point (first re-test) will be ignored by the script if it is not at least 2 bars away from the initial zone proposal point.
Confirmation Bars: After a zone has reached the desired Contact Amount, this setting will cause the script to wait a specified number of bars before identifying a zone. While this might initially seem counterintuitive, by waiting, we are able to watch the market's reaction to the proposed zone and respond accordingly. If the price were to continue through the potential liquidity zone Immediately, it would not be logical to consider this area as a valid Liquidity Pool.
Displayed in this screenshot, you will see the specific points we are looking for in order to identify these zones.
🔹 Display
After a Liquidity Pool is identified, its boundary line is extended to the current price to keep it in view for reference. This extension will continue until the zone is mitigated (price has closed above or below the zone), after which it will stop extending.
Candles can optionally be colored when returning to the most recent Liquidity Pool if it is still unmitigated, and will only color after the zone is displayed on the chart. Because of this, if a candle is colored within a zone, then its color comes from being inside a previously unmitigated zone.
🔹 Volume
Each time a candle overlaps an Unmitigated Zone, a percentage of its volume will be accumulated to the total for each specific zone. The volume total is displayed on the right end of the extended boundary lines.
This volume data could help to determine the importance of specific zones based on the amount of volume traded within.
Note: This volume is fractional to the percentage of candles that are contained within the zone. If a candle is 50% within a zone, The zone will receive 50% of the candle's volume added to its current total.
🔶 SETTINGS
See above for a more detailed explanation of the "Zone Identification" parameters.
Zone Contact Amount: The number of times the price must bounce from this zone before considering it as a liquidity pool.
Bars Required Between Each Contact: The number of bars to wait before checking for another zone contact.
Confirmation Bars: The number of bars to wait before identifying a zone to confirm validity.
Display Volume Labels: Toggles the display for the volume readout for each Liquidity Pool.
Fill Candles Inside Zones: Toggles the display of colored candles within Liquidity Pools.
Delayed Opening Price Line with GuardrailsThis Delayed Opening Price Line with Guardrails indicator will draw 5 price level lines on the chart each day, beginning at the open of the first candle after a delay period specified by the user in the indicator settings. The default delay is 30 minutes from market open.
The lines are drawn at the open price of the first candle after the delay period, and then a specified increment above and below that price level. These increments default to 80 and 100, and can be adjusted in the indicator settings.
Most markets, indices, and equities have a finite and consistent range of price movement within a trading day. Eg. a particular stock may usually move no more that $50 up or down in a given day, which can be proven by looking at a historical chart. This indicator allows the user to quickly display that range on the chart once it's been defined.
Important note: This indicator is designed to be used on an intra-day chart - eg. minutes, or hourly. It will give an error if used on a longer time-frame chart.

Options Series - Dynamic Support & Resistance
🌟 Key Features & How It Works:
⭐ Dynamic Support and Resistance Management:
The script dynamically calculates and draws support and resistance lines based on pivot highs and pivot lows. Unlike static levels that remain unchanged, these lines are updated in real-time. When a support or resistance level is breached, the corresponding line is automatically deleted, keeping the chart clean and relevant. This feature ensures that the trader is always looking at valid support and resistance levels based on the current price action.
⭐ Use of Arrays for Line Management:
The script utilizes arrays to store and manage support and resistance lines (array.new_line(0)). This is a more advanced feature of Pine Script v5, allowing for efficient handling of multiple lines on the chart. By using arrays, the script can easily track and manipulate multiple lines (adding, removing, updating), ensuring that the chart remains optimized for real-time analysis.
⭐ Customizable Inputs for Flexibility:
The script includes user inputs for the pivot length and the line width, making it adaptable to different trading styles and preferences. The pivot length determines how sensitive the indicator is to price changes, while the line width allows traders to customize the visual representation of support and resistance levels. These inputs add flexibility and make the script accessible to a broad range of traders.
⭐ Efficient Breach Detection Mechanism:
The isBreached function is a key part of the script. It checks whether the current price has breached any of the existing support or resistance levels. If a breach is detected (i.e., the price crosses below a support or above a resistance), the respective line is deleted, ensuring that only active and valid lines remain on the chart. This automatic update feature reduces the need for manual intervention, helping traders stay focused on key price levels.
⭐ Visual Clarity and Chart Cleanliness:
By deleting breached lines, the script ensures that the chart does not become cluttered with outdated or irrelevant lines. This visual clarity is crucial for traders who rely on clean, simple charts for decision-making. Removing unnecessary information helps traders make faster, more confident decisions based on the current market structure.
⭐ Scalability for Multiple Timeframes:
The use of pivot points makes the script adaptable to different timeframes, from intraday scalping to longer-term swing trading. By changing the pivot length, traders can optimize the indicator for different market environments, ensuring that it can be applied across various asset classes and timeframes.
⭐ Practical for Range-bound and Breakout Trading:
This script is particularly effective for traders who focus on range-bound markets or breakout strategies. It allows them to quickly identify areas where price is likely to reverse (support/resistance) or break out (when support/resistance is breached), providing real-time insight into market dynamics.
⭐ Simplification of Price Action Analysis:
By automating the calculation of pivots and management of support/resistance levels, the script simplifies price action analysis. Traders no longer need to manually draw or monitor these levels, which is a common task in technical analysis. This provides an edge, as it reduces the time spent on chart preparation and helps focus on executing trades.
⭐ Originality:
The script "Options Series - Pivot Based Support & Resistance" is an original approach to generating support and resistance levels using pivot points. Pivot-based techniques are popular, but the script introduces an automated dynamic way of drawing support and resistance lines, tracking breaches, and deleting lines when they are no longer valid. This aspect adds a refreshing layer of interactivity and functionality that sets it apart from basic pivot point scripts. The use of arrays to store and manage multiple support and resistance lines is also a good application of Pine Script’s newer array functionalities.
⭐ Uniqueness of the Script:
The script stands out due to its dynamic management of support and resistance lines. Unlike traditional scripts that simply plot static pivot points, this one evolves with the market by removing broken levels, ensuring only valid support and resistance lines are visible on the chart. This is particularly useful for traders who focus on clean charting. The use of arrays to store and manage the lines, alongside the efficient deletion of lines when breached, demonstrates a solid understanding of Pine Script v5's advanced features, such as array manipulation.
🚀 Conclusion:
This script stands out for its real-time adaptability, dynamic support/resistance management, and efficient use of Pine Script’s advanced features. It a powerful tool for both novice and advanced traders.
The script is an indicator designed to draw support and resistance levels based on pivot highs and lows, dynamically removing lines when they are breached. If a price crosses a support or resistance level, the respective line is deleted, ensuring the chart reflects the current state of support and resistance accurately.

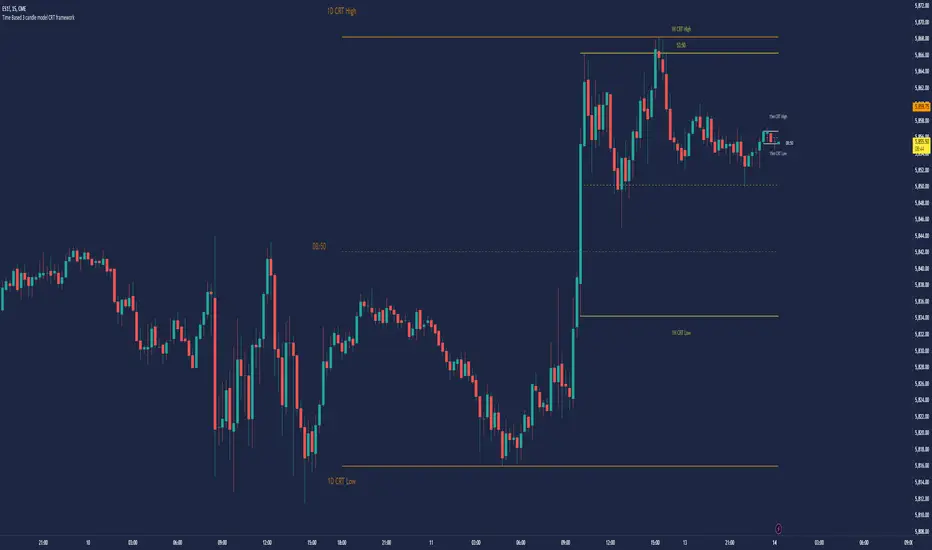
Time Based 3 Candle Model CRT FrameworkThe 3 Candle Model Overview:
The 3 Candle Model serves as a sophisticated framework for traders to navigate the complexities of financial markets, particularly within futures and forex trading. This guide not only elaborates on the model's key features but also emphasizes its originality and practical usefulness in the TradingView community. The core principle of the 3 Candle Model revolves around understanding how candle patterns can represent significant price ranges, offering valuable insights into potential market movements. By integrating the model with other critical trading concepts such as the Power of Three (PO3), Open-High-Low-Close (OHLC), and Turtle Soup setups, traders can enhance their ability to identify high-probability trades and achieve better trading outcomes.
Indicator includes:
3 Customizable Timeframe choices to fractally frame 3 candle models for precision
Live Timers for each timeframe to always be aware of the models timing
Parent Candle tracking on every preffered timeframe until new models parent candle is printed
Key Features of the 3 Candle Model
The 3 Candle Model primarily utilizes a three-candle structure, where the first candle establishes a price range, the second candle may act as a confirmation (often termed a "turtle soup"), and the third candle provides the breakout or continuation. This structure is pivotal in determining entry and exit points for trades, ensuring that each trading decision is backed by solid price action analysis.
OHLC Principle:
The Open-High-Low-Close (OHLC) concept is integral to the 3 Candle Model, allowing traders to analyze price action more effectively. Understanding the relationship between these four price points helps traders gauge market sentiment and potential reversals. By incorporating OHLC into the model, traders can develop a deeper understanding of market structure and its implications for future price movements.
Delivery States:
The 3 Candle Model emphasizes the importance of delivery states, which refer to the market's phase during specific time frames. Recognizing these states aids traders in determining the appropriate conditions for entering trades, particularly when combined with the power of three and candle range patterns. This understanding is crucial for positioning trades in alignment with market momentum.
High Probability Setups:
By aligning the 3 Candle Model with inside bar setups, traders can optimize their strategies for high-probability outcomes. This approach capitalizes on the inherent fractal nature of price movements, where previous patterns repeat at different scales. The combination of the model and inside bar setups enhances the trader's toolkit, allowing for more strategic trade placements.
Turtle Soup Formation:
The 3 Candle Model intricately connects with the Turtle Soup concept, which focuses on false breakouts. Identifying these formations at critical levels enhances the trader's ability to anticipate reversals or continuation patterns. The timing of these setups, particularly during specified times like 3:00 AM, 6:00 AM, 9:00 AM, and 1:00 PM, is crucial for maximizing trade success.
Using the 3 Candle Model in Trading
Integration with PO3:
The Power of Three (PO3) is a fundamental aspect of the 3 Candle Model that emphasizes the significance of three distinct stages of price delivery. Traders can leverage this principle by observing the initial range, confirming patterns, and executing trades during the third phase, leading to higher risk-to-reward ratios. This three-stage approach enhances a trader's ability to make informed decisions based on market behavior.
Targeting Midpoints:
Successful application of the 3 Candle Model involves targeting the midpoints of identified ranges. This practice not only provides strategic entry points but also enhances the probability of reaching desired profit levels. By targeting these midpoints, traders can refine their exit strategies and manage risk more effectively.
Aligning with Market Timing:
Timing is everything in trading. By synchronizing the 3 Candle Model setups with the aforementioned key timeframes, traders can better position themselves to exploit market dynamics. This alignment also facilitates the identification of high-quality trades that exhibit strong potential for profitability.
Prioritizing A+ Setups:
By focusing on the 3 Candle Model and its associated concepts, traders can prioritize A+ setups that exhibit a strong alignment of factors. This methodical approach enhances the quality of trades taken, leading to improved overall performance. By cultivating a strategy centered on high-probability setups, traders can maximize their return on investment.
Ensuring Originality and Usefulness
To meet the TradingView community guidelines, it is essential that this script is both original and useful. The 3 Candle Model, in its essence, is designed to provide traders with a unique perspective on market movements, free from generic or rehashed strategies. This tool integrates unique interpretations of the three-candle model and the associated strategies that are distinctly articulated and innovative.
Practical Applications: there are many practical applications of the 3 Candle Model in various trading contexts. This model in conjunction with other strategies to cultivate high-probability trade setups that can enhance performance across diverse market conditions.
Educational Value: This script is crafted with educational value in mind, providing insights that extend beyond mere trading signals. It encourages users to develop a deeper understanding of market mechanics and the interplay between price action, time, and trader psychology.
Conclusion
The 3 Candle Model provides a comprehensive framework for traders to enhance their trading strategies in the futures and forex markets. By understanding and applying the principles of this model alongside the Power of Three, OHLC concepts, and Turtle Soup formations, traders can significantly improve their ability to identify high-probability trades. The emphasis on timing, delivery states, and alignment of ranges ensures that traders are well-equipped to navigate the complexities of market movements, ultimately leading to more consistent and rewarding trading outcomes.
As trading involves risk, it is essential for traders to utilize these principles judiciously and maintain a disciplined approach to their trading strategies. By adhering to the TradingView community guidelines and emphasizing originality, usefulness, and detailed descriptions, this 3 Candle Model script stands as a valuable resource for traders seeking to refine their skills and achieve greater success in the financial markets.
Through this detailed exploration of the 3 Candle Model, traders will not only learn to recognize and exploit key patterns in price action but also appreciate the interconnectedness of various trading strategies that can significantly enhance their performance and profitability.
Decision Point Support and ResistanceIntroduction:
The Decision Point Support and Resistance Indicator plots unique time and price based support and resistance lines. Depending on the current time frame (1 minute, 1 hour, 1 day etc.), this indicator references preset higher time frames which I will refer to as parent time frames henceforth.
On each time frame, based on price action within its corresponding parent time frame, support and resistance lines are plotted on the chart at the start of the next parent time frame and extended for 360 candlesticks into the future.
This allows a manageable number of support and resistance lines to be live on the chart at any given time so that it does not become visually overwhelming. It also provides a time window in which each support and resistance line is active to be considered for use in analysis.
Description:
With all of the basic information about what this indicator does, lets delve deeper into the logic behind the lines.
This picture is a screenshot of the 1 minute chart of the S&P 500 emini futures. The default parent time frame for the 1 minute chart on all asset classes is 1 hour. This means that as long as the price action criteria that I will describe in a moment is met, then there will be a support and resistance line plotted at the beginning of each hour while on the 1 minute chart.
The rest of the parent time frame defaults for each current time frames is as follows:
Current Time Frame ------------- Default Parent Time Frame
5 Second --------------------------- 5 Minutes
15 Second ------------------------- 15 Minutes
30 Second ------------------------- 30 Minutes
1 Minute --------------------------- 1 Hour
5 Minute --------------------------- 4 Hours
15 Minute -------------------------- 12 Hours
30 Minute -------------------------- 1 Day
1 Hour ------------------------------ 3 Days
4 Hour ------------------------------ 2 Weeks
1 Day ------------------------------- 3 Months
1 Week ----------------------------- 12 Months
1 Month ---------------------------- 12 Months
Lets continue using the 1 Minute Chart as an example.
The price that each of the support and resistance lines are plotted at (with certain proprietary selection criteria withheld) is determined as follows:
- For Bullish Parent Time Frame Closes (e.g. while on 1 Minute Chart, 1 Hour closes Bullish), the script picks a price point within the parent time frame that is identified by my proprietary selection criteria as being the price point in which the market first "decided" to be bullish for the duration of the parent time frame. At the start of the next parent time frame, a line is plotted at the identified price point and extended for 360 candles into the future. If no price point meets the criteria, no line is plotted.
- For Bearish Parent Time Frame Closes (e.g. while on 1 Minute Chart, 1 Hour closes Bearish), the script picks a price point within the parent time frame that is identified by my proprietary selection criteria as being the price point in which the market first "decided" to be bearish for the duration of the parent time frame. At the start of the next parent time frame, a line is plotted at the identified price point and extended for 360 candles into the future. If no price point meets the criteria, no line is plotted.
This is the reason that this indicator is called the Decision Point Support and Resistance Indicator. It marks the point in which each parent time frame "decided" to be bullish or bearish and plots that point out into the future.
As the market has historically revisited these levels, they have served as highly effective support and resistance levels.
Features:
1. Adjust how far right the support and resistance lines extend
2. Change the color of support and resistance lines
- The lines that are generated from bullish or bearish parent time frames can be individually changed to different colors. This does not mean one should act as support and the other should act as resistance. I have yet to find a meaningful pattern between the bullish and bearish lines so I tend to keep them the same color, but feel free to try!
3. Change line style
4. Manually change default parent time frame to parent time frame of your choosing
- Toggle on "Use Manual Timeframe" to pick a new parent timeframe. This will increase or decrease the frequency of the lines. I felt that the defaults struck a good balance of useful information without becoming overwhelming. That said, please feel free to make that decision yourself by choosing the parent time frame that best suits you!
5. Change Lookback Period
- The default Lookback Period is 3000 candles. You can increase or decrease this for back testing or analysis purposes.
- At the start of a new parent timeframe, the indicator can get stuck while trying to load in new lines. When this happens it is helpful to change the lookback period by 1 (e.g. from 3000 to 3001) to prompt the indicator to load in the most recent support and resistance lines.
How to effectively use the Decision Point Support and Resistance Indicator:
This indicator can be used as stand alone support and resistance for analyzing entry and exit points. Its useful for narrowing down higher time frame zones such as order blocks, fair value gaps, or supply and demand zones from wide price ranges to single price points.
- The lines on the 5 second, 15 second, 30 second, and 1 minute charts are useful for scalping and day trading. Lines that appear on higher time frames are often effective exit points.
- The lines on the 5 minute, 15 minute, 30 minute, and 1 hour charts are useful for intermediate term trading or swing trading. Lines that appear on higher time frames are often effective exit points.
- The lines on the 4 hour, 1 Day, and 1 Week charts are useful for long term trading and investing or dollar cost averaging.
Limitations:
As this indicator plots price points from previous price ranges, it is most effective at catching retracements for continuation trades on your current time frame. It works best for internal range conditions and is less effective in external range conditions such as all time highs and lows.
In these external range conditions it can be helpful to change to a higher time frame for further analysis.
The Decision Point Support and Resistance Indicator is meant to be used to augment your current trading strategy. It is best used as confirmation of your analysis and to help narrow down entry and exit targets within your current strategy.
Conclusion:
The Decision Point Support and Resistance Indicator is the culmination of the close to 10 years of my trading career. I have spent years studying price action and thousands of hours creating, iterating, and refining the concepts underpinning this indicator. Every aspect of this indicator is based on my own entirely original concepts that I created to aid in my own trading. It is an honor to be able to share fruits of my labor with the trading community at large.
Disclaimer:
This indicator is intended for educational and demonstration purposes only and should not be construed as financial or investment advice. Past performance is not indicative of future results. Trading involves risk, and you should seek the advice of a qualified financial professional before making any trading decisions. We do not guarantee the accuracy, completeness, or reliability of this indicator, and we are not liable for any losses or damages incurred as a result of its use.

Price Action UltimateThe Price Action Ultimate indicator is an innovative tool designed to provide traders with a comprehensive view of price action based on either volume or touches. By default, the indicator displays touches, offering a unique perspective on price levels that have been frequently interacted with by the market.
At its core, the indicator divides the price range of a specified lookback period into a number of rows (default 25). For each row, it calculates either the volume traded or the number of times the price touched that level. This data is then visualized in two ways: as a histogram and as horizontal lines on the chart.
The histogram, displayed on the right side of the chart, represents the distribution of touches (or volume) across different price levels. Each bar in the histogram shows the number of touches and the percentage of total touches for that price level. The color of the bars ranges from a user-defined low activity color to a high activity color, providing a quick visual reference for the most active price levels.
The horizontal lines drawn across the chart represent the most significant levels based on touches (or volume). By default, the indicator displays the top 3 levels, but this can be adjusted. The thickness of these lines corresponds to the relative importance of each level - thicker lines indicate more touches or higher volume. This feature allows traders to quickly identify key support and resistance levels based on historical price action.
One of the most innovative aspects of this indicator is the option to fade older levels over time. When enabled, this feature gradually increases the transparency of lines as they age, with newer levels appearing more prominently. This helps traders focus on the most recent and relevant price action while still maintaining awareness of older, potentially significant levels.
The indicator offers flexibility in its display options. Users can choose to show levels based on volume, touches, or both. This allows traders to compare and contrast different perspectives on price action. Additionally, the indicator includes options to display a volume profile and a background fill for the analysis range, further enhancing its visual appeal and informational content.
What makes this indicator particularly valuable is its ability to provide a clear, uncluttered view of key price levels without relying on complex calculations or multiple indicators. It distills price action down to its essence - where price has spent the most time or where the most trading activity has occurred. This can be incredibly useful for identifying potential support and resistance levels, areas of consolidation, or possible breakout points.
For traders focused on price action strategies, this indicator offers a powerful tool to enhance their analysis. It provides a data-driven approach to identifying significant price levels, which can be used to inform entry and exit decisions, set stop losses, or anticipate potential market reactions.
This indicator is a tool to aid in market analysis and should not be used as the sole basis for trading decisions. Always combine multiple forms of analysis and practice proper risk management when trading. Past performance does not guarantee future results.

Liquidity VisualizerThe "Liquidity Visualizer" indicator is designed to help traders visualize potential areas of liquidity on a price chart. In trading, liquidity often accumulates around key levels where market participants have placed their stop orders or pending orders. These levels are commonly found at significant highs and lows, where traders tend to set their stop-losses or take-profit orders. The indicator aims to highlight these areas by drawing unbroken lines that extend indefinitely until breached by the price action.
Specifically, this indicator identifies and marks pivot highs and pivot lows, which are price levels where a trend changes direction. When a pivot high or pivot low is formed, it is represented on the chart with a horizontal line that continues to extend until the price touches or surpasses that level. The line remains in place as long as the level remains unbroken, which means there is potential liquidity still resting at that level.
The concept behind this indicator is that liquidity is likely to be resting at unbroken pivot points. These levels are areas where stop-loss orders or pending buy/sell orders may have accumulated, making them attractive zones for large market participants, such as institutions, to target. By visualizing these unbroken levels, traders can gain insight into where liquidity might be concentrated and where potential price reversals or significant movements could occur as liquidity is taken out.
The indicator helps traders make more informed decisions by showing them key price levels that may attract significant market activity. For instance, if a trader sees multiple unbroken pivot high lines above the current price, they might infer that there is a cluster of liquidity in that area, which could lead to a price spike as those levels are breached. Similarly, unbroken pivot lows may indicate areas where downside liquidity is concentrated.
In summary, this indicator acts as a "liquidity visualizer," providing traders with a clear, visual representation of potential liquidity resting at significant pivot points. This information can be valuable for understanding where price might be drawn to, and where large movements might occur as liquidity is targeted and removed by market participants.

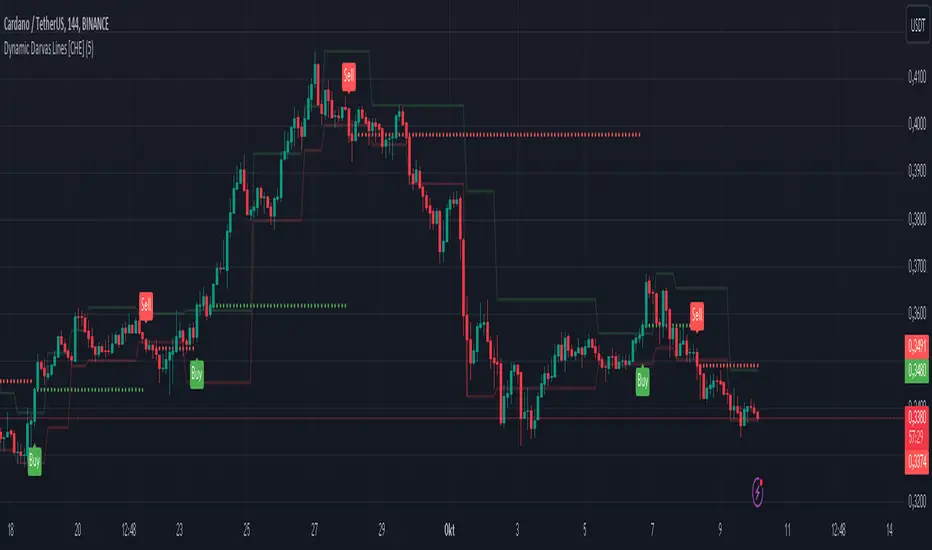
Dynamic Darvas Lines [CHE] Dynamic Darvas Lines
Unlock Precision Trading with Dynamic Darvas Lines
Overview:
Dynamic Darvas Lines is an advanced trading indicator designed for traders seeking to enhance their market analysis and decision-making process. Building upon the classic Darvas Box theory, this indicator introduces dynamic zone detection and comprehensive customization features, making it an indispensable tool for both novice and experienced traders.
Key Features & Advantages:
1. Dynamic Zone Detection:
- Adaptive Boxes: Automatically identifies and adjusts support and resistance levels based on market volatility and price movements, ensuring that the indicator remains relevant in varying market conditions.
- Real-Time Updates: Continuously recalculates box boundaries, providing up-to-the-minute insights into potential breakout or reversal points.
2. Enhanced Signal Accuracy:
- Buy & Sell Signals: Generates clear and actionable buy and sell signals based on the crossover and crossunder of price with dynamic Darvas lines, helping traders capitalize on optimal entry and exit points.
- Signal Confirmation: Reduces false signals by requiring confirmation through multiple conditions, enhancing overall trade reliability.
3. Comprehensive Customization:
- Adjustable Parameters: Tailor the indicator to your specific trading style with customizable box length, signal colors, and plot shapes.
- Color Management: Differentiate between various market signals with intuitive color coding for buy/sell signals, box boundaries, and debug lines, enhancing visual clarity on your charts.
4. Advanced Visualization:
- Signal Circles: Visual markers highlight significant price levels where buy and sell signals are triggered, making it easier to spot opportunities at a glance.
- Debug Mode: Activate debug lines to display the lowest lows and highest highs within the defined box length, aiding in in-depth market analysis and strategy refinement.
5. Robust Alert System:
- Custom Alerts: Set up real-time alerts for buy and sell signals, ensuring you never miss critical trading opportunities even when you're away from your screen.
- Automated Notifications: Receive instant notifications directly through your trading platform, keeping you informed and ready to act.
6. Seamless Integration:
- Overlay Capability: Easily integrates with your existing charts, allowing you to combine Dynamic Darvas Lines with other technical indicators for a more comprehensive market view.
- Optimized Performance: Efficiently coded in Pine Script V5, ensuring smooth performance without lag, even on lower-end devices.
Use Cases:
- Trend Identification: Detect and follow market trends by observing the formation and breakout of dynamic Darvas boxes, helping you stay aligned with the market’s momentum.
- Breakout Trading: Capitalize on significant price movements when the price breaks out of established Darvas zones, indicating potential strong directional moves.
- Reversal Detection: Identify potential market reversals by monitoring when the price crosses under the lower Darvas line or above the upper Darvas line, signaling a change in market sentiment.
- Risk Management: Utilize the indicator’s clear support and resistance levels to set strategic stop-loss and take-profit points, enhancing your risk-reward ratio.
- Market Analysis: Combine with other technical tools and indicators to perform comprehensive market analysis, improving the accuracy of your trading strategies.
Why Choose Dynamic Darvas Lines ?
Dynamic Darvas Lines stands out with its blend of traditional Darvas Box principles and modern enhancements. Its dynamic nature ensures adaptability across different market conditions, while the extensive customization options provide traders with the flexibility to tailor the indicator to their unique trading strategies. Whether you’re aiming to identify trends, execute breakout trades, or manage risks more effectively, Dynamic Darvas Lines offers the precision and reliability you need to elevate your trading game.
Get Started Today:
Enhance your trading toolkit with Dynamic Darvas Lines and experience the difference in your market analysis and trading performance. Download now and take the first step towards more informed and strategic trading decisions!
Note: Always backtest any trading indicator and use it in conjunction with other analysis tools to develop a robust trading strategy. Trading involves risk, and it's essential to practice sound risk management.
Disclaimer:
The content provided, including all code and materials, is strictly for educational and informational purposes only. It is not intended as, and should not be interpreted as, financial advice, a recommendation to buy or sell any financial instrument, or an offer of any financial product or service. All strategies, tools, and examples discussed are provided for illustrative purposes to demonstrate coding techniques and the functionality of Pine Script within a trading context.
Any results from strategies or tools provided are hypothetical, and past performance is not indicative of future results. Trading and investing involve high risk, including the potential loss of principal, and may not be suitable for all individuals. Before making any trading decisions, please consult with a qualified financial professional to understand the risks involved.
By using this script, you acknowledge and agree that any trading decisions are made solely at your discretion and risk.
Weekly Initial BalanceWeekly Initial Balance Indicator
The Weekly Initial Balance (IB) indicator is a powerful tool designed for traders to identify key support and resistance levels based on the market's initial activity at the start of each week. By analyzing the first 30 hours of trading.
Key Features:
Customizable IB Period: Define the start hour and duration of the initial balance period to suit your trading schedule and the specific market you are analyzing, I have it set at 30 hours by default.
IB High, Low, and Midpoint Levels: Automatically plots the high, low, and midpoint of the IB period, providing immediate visual reference to critical price levels.
Extension Levels: Calculate and display extension levels based on customizable percentages (e.g., 50%, 100%, 150%), allowing you to project potential breakout targets and identify areas of interest beyond the initial balance range.
Dynamic Lines and Labels: The indicator updates in real-time, extending lines and repositioning labels as new bars form, ensuring you always have the most current information.
Customizable Appearance: Adjust line styles, widths, colors, and label positions to match your charting preferences and improve visual clarity.
How to Use:
Set the IB Parameters:
Week Start Hour (UTC): Specify the hour when the weekly IB period begins. I use 1800EST as that is when the futures market opens.
IB Duration in Hours: Define how many hours constitute the IB period.
Configure Extension Levels:
Input the desired extension percentages to calculate levels beyond the IB range.
Customize Visual Settings:
Adjust line colors, styles, widths, and label offsets to tailor the indicator's appearance.
Interpret the Levels:
Use the IB high and low as immediate support and resistance levels.
Monitor the midpoint for potential pivot areas.
Watch for price interactions with extension levels to anticipate breakouts or reversals.
Benefits:
Identify Key Weekly Levels: Understand the market's initial sentiment each week to gauge potential trends.
Enhance Trading Strategies: Incorporate the IB levels into your trading plan for better entry and exit points.
Adaptable to Various Markets: Suitable for Forex, commodities, indices, and other markets where weekly analysis is beneficial.

Price Action Analyst [OmegaTools]Price Action Analyst (PAA) is an advanced trading tool designed to assist traders in identifying key price action structures such as order blocks, market structure shifts, liquidity grabs, and imbalances. With its fully customizable settings, the script offers both novice and experienced traders insights into potential market movements by visually highlighting premium/discount zones, breakout signals, and significant price levels.
This script utilizes complex logic to determine significant price action patterns and provides dynamic tools to spot strong market trends, liquidity pools, and imbalances across different timeframes. It also integrates an internal backtesting function to evaluate win rates based on price interactions with supply and demand zones.
The script combines multiple analysis techniques, including market structure shifts, order block detection, fair value gaps (FVG), and ICT bias detection, to provide a comprehensive and holistic market view.
Key Features:
Order Block Detection: Automatically detects order blocks based on price action and strength analysis, highlighting potential support/resistance zones.
Market Structure Analysis: Tracks internal and external market structure changes with gradient color-coded visuals.
Liquidity Grabs & Breakouts: Detects potential liquidity grab and breakout areas with volume confirmation.
Fair Value Gaps (FVG): Identifies bullish and bearish FVGs based on historical price action and threshold calculations.
ICT Bias: Integrates ICT bias analysis, dynamically adjusting based on higher-timeframe analysis.
Supply and Demand Zones: Highlights supply and demand zones using customizable colors and thresholds, adjusting dynamically based on market conditions.
Trend Lines: Automatically draws trend lines based on significant price pivots, extending them dynamically over time.
Backtesting: Internal backtesting engine to calculate the win rate of signals generated within supply and demand zones.
Percentile-Based Pricing: Plots key percentile price levels to visualize premium, fair, and discount pricing zones.
High Customizability: Offers extensive user input options for adjusting zone detection, color schemes, and structure analysis.
User Guide:
Order Blocks: Order blocks are significant support or resistance zones where strong buyers or sellers previously entered the market. These zones are detected based on pivot points and engulfing price action. The strength of each block is determined by momentum, volume, and liquidity confirmations.
Demand Zones: Displayed in shades of blue based on their strength. The darker the color, the stronger the zone.
Supply Zones: Displayed in shades of red based on their strength. These zones highlight potential resistance areas.
The zones will dynamically extend as long as they remain valid. Users can set a maximum number of order blocks to be displayed.
Market Structure: Market structure is classified into internal and external shifts. A bullish or bearish market structure break (MSB) occurs when the price moves past a previous high or low. This script tracks these breaks and plots them using a gradient color scheme:
Internal Structure: Short-term market structure, highlighting smaller movements.
External Structure: Long-term market shifts, typically more significant.
Users can choose how they want the structure to be visualized through the "Market Structure" setting, choosing from different visual methods.
Liquidity Grabs: The script identifies liquidity grabs (false breakouts designed to trap traders) by monitoring price action around highs and lows of previous bars. These are represented by diamond shapes:
Liquidity Buy: Displayed below bars when a liquidity grab occurs near a low.
Liquidity Sell: Displayed above bars when a liquidity grab occurs near a high.
Breakouts: Breakouts are detected based on strong price momentum beyond key levels:
Breakout Buy: Triggered when the price closes above the highest point of the past 20 bars with confirmation from volume and range expansion.
Breakout Sell: Triggered when the price closes below the lowest point of the past 20 bars, again with volume and range confirmation.
Fair Value Gaps (FVG): Fair value gaps (FVGs) are periods where the price moves too quickly, leaving an unbalanced market condition. The script identifies these gaps:
Bullish FVG: When there is a gap between the low of two previous bars and the high of a recent bar.
Bearish FVG: When a gap occurs between the high of two previous bars and the low of the recent bar.
FVGs are color-coded and can be filtered by their size to focus on more significant gaps.
ICT Bias: The script integrates the ICT methodology by offering an auto-calculated higher-timeframe bias:
Long Bias: Suggests the market is in an uptrend based on higher timeframe analysis.
Short Bias: Indicates a downtrend.
Neutral Bias: Suggests no clear directional bias.
Trend Lines: Automatic trend lines are drawn based on significant pivot highs and lows. These lines will dynamically adjust based on price movement. Users can control the number of trend lines displayed and extend them over time to track developing trends.
Percentile Pricing: The script also plots the 25th percentile (discount zone), 75th percentile (premium zone), and a fair value price. This helps identify whether the current price is overbought (premium) or oversold (discount).
Customization:
Zone Strength Filter: Users can set a minimum strength threshold for order blocks to be displayed.
Color Customization: Users can choose colors for demand and supply zones, market structure, breakouts, and FVGs.
Dynamic Zone Management: The script allows zones to be deleted after a certain number of bars or dynamically adjusts zones based on recent price action.
Max Zone Count: Limits the number of supply and demand zones shown on the chart to maintain clarity.
Backtesting & Win Rate: The script includes a backtesting engine to calculate the percentage of respect on the interaction between price and demand/supply zones. Results are displayed in a table at the bottom of the chart, showing the percentage rating for both long and short zones. Please note that this is not a win rate of a simulated strategy, it simply is a measure to understand if the current assets tends to respect more supply or demand zones.
How to Use:
Load the script onto your chart. The default settings are optimized for identifying key price action zones and structure on intraday charts of liquid assets.
Customize the settings according to your strategy. For example, adjust the "Max Orderblocks" and "Strength Filter" to focus on more significant price action areas.
Monitor the liquidity grabs, breakouts, and FVGs for potential trade opportunities.
Use the bias and market structure analysis to align your trades with the prevailing market trend.
Refer to the backtesting win rates to evaluate the effectiveness of the zones in your trading.
Terms & Conditions:
By using this script, you agree to the following terms:
Educational Purposes Only: This script is provided for informational and educational purposes and does not constitute financial advice. Use at your own risk.
No Warranty: The script is provided "as-is" without any guarantees or warranties regarding its accuracy or completeness. The creator is not responsible for any losses incurred from the use of this tool.
Open-Source License: This script is open-source and may be modified or redistributed in accordance with the TradingView open-source license. Proper credit to the original creator, OmegaTools, must be maintained in any derivative works.

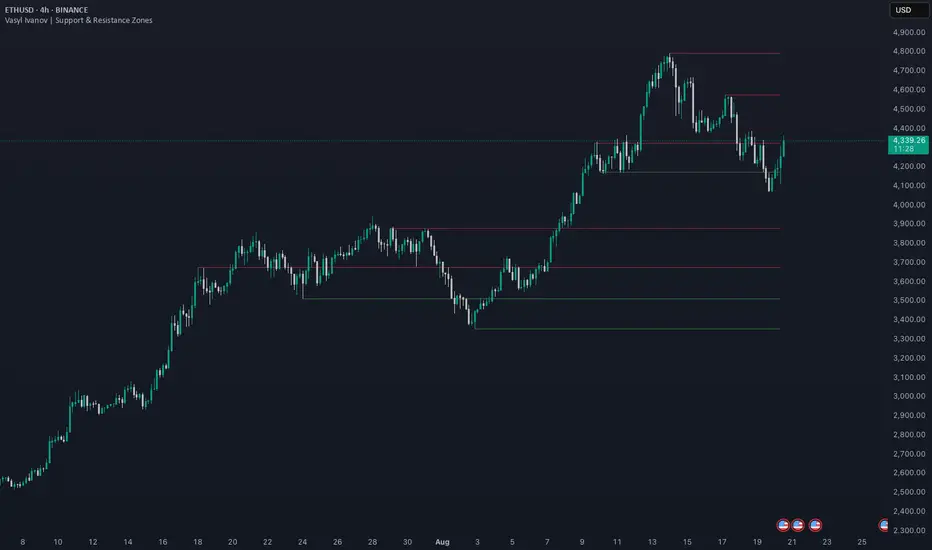
Vasyl Ivanov | Support & Resistance ZonesSupport and Resistance Zones Indicator: Multi-Timeframe Detection
This indicator helps traders identify key Support and Resistance zones across multiple timeframes. With customizable settings for zone visibility, color coding, and granularity, it allows for flexible market analysis and adapts to different trading styles.
Key Features:
Support and Resistance Zones for Up to 4 Timeframes:
Detect and display support and resistance zones from up to 4 different timeframes, giving you a comprehensive view of potential reversal points across multiple market levels.
Customizable Colors for Each Timeframe:
Assign a unique color to each timeframe's zones to easily distinguish them on the chart. You can also switch off unnecessary timeframes to keep your chart focused and clutter-free.
Adjustable ATR Coefficient for Granularity:
Modify the ATR coefficient to control the precision of support and resistance zones. A higher coefficient will capture broader zones, while a lower coefficient will reveal more specific levels of support and resistance.
Control Zones' Vertical Distance Visibility:
Adjust the vertical distance visibility of the zones to fine-tune how far each zone extends on the chart, allowing you to better visualize their importance and proximity to current price action.
How It Works:
The Support and Resistance Zones Indicator analyzes price data to highlight important zones where price has historically reacted:
Select up to 4 timeframes to display support and resistance zones, which will be automatically drawn on your chart.
Adjust the ATR coefficient to fine-tune the size and granularity of the detected zones.
Customize zone colors to visually differentiate between timeframes, making it easier to analyze zones from various market levels.
Control zone visibility by adjusting the vertical distance each zone covers, helping you focus on the most relevant zones for your trading strategy.
Use Cases:
Multi-Timeframe Support and Resistance: Identify key zones from multiple timeframes to gain insight into potential price reactions and trend reversals.
Refined Analysis: Adjust the ATR coefficient and visibility settings to adapt the zones to current market volatility, ensuring precise trading decisions.
Custom Charting: Use different colors for each timeframe to keep your chart organized and visually clear, or turn off timeframes you don’t need for a cleaner view.
Why It’s Unique:
This indicator offers a comprehensive, customizable approach to identifying support and resistance zones across multiple timeframes, with the added flexibility of ATR-based granularity and zone visibility control. It’s ideal for traders who want deeper insight into potential reversal points while keeping their charts visually manageable.
Gann Square of 9Understanding the Gann Square of 9
Delve into the fascinating realm of W.D. Gann’s Square of 9, a tool that has intrigued traders for generations. As we explore the insights behind this unique structure, we’ll show you how our Gann Square of 9 Indicator can become a valuable asset in your trading toolkit.
The History of the Gann Square of 9
The story behind the Gann Square of 9 is as fascinating as the man who created it. W.D. Gann, a pioneering trader from the early 20th century, introduced a method that highlighted the connection between time and price. Rooted in ancient mathematics and geometry, Gann’s theory suggests that financial markets follow cyclical patterns, which are captured in the design of the Square of 9.
Core Principles of the Gann Square of 9
At its heart, the Gann Square of 9 is based on a numerical system that spirals outward from a central point. This unique arrangement allows traders to identify potential support and resistance levels in the market. Each number represents a possible pivot point, indicating shifts in market direction, aligned with Gann’s time-price equilibrium theory.
Applying the Gann Square in Market Analysis
The strength of the Gann Square of 9 lies in its ability to predict key moments in the market where significant price movements may occur. By utilizing our Gann Square of 9 Indicator, traders can easily pinpoint these crucial points, applying Gann’s principles to anticipate both market highs and lows. This section will guide you through practical applications of the Gann Square for making both short-term and long-term trading decisions.
Market Timing with the Gann Square of 9 Indicator
Unlock the potential of market timing and price prediction using our Gann Square of 9 Indicator. This versatile tool brings Gann’s trading insights into the modern world of finance. Here, you’ll find a detailed walkthrough on how to use the indicator to enhance your trading strategies.
Step-by-Step Guide
Input the Source Price: Open, High, Low, Close on specific Timeframe.
Set the Pip Value: Adjust the pip value according to the scale of your trades. The pip value helps define the precision of the price levels the calculator will generate.
Analyze Results: The generated grid displays a central value (your input price) surrounded by numbers representing possible support and resistance levels.
Use the Support and Resistance Levels: Below the grid, you’ll find specific support and resistance points. These are key price levels that can help you plan your trading strategy, such as entry or exit points.
Apply Gann's Trading Entries: At the bottom, suggested long and short trade entries, with targets and stop-loss levels, giving you essential tools for managing risk effectively.
By following these steps, you can effectively incorporate Gann’s time-tested techniques into modern market analysis. Our Gann Square of 9 Indicator simplifies complex calculations while offering powerful insights, helping you make informed trading decisions rooted in one of market analysis’s most influential theories.
Whether you’re new to Gann’s approach or a seasoned trader, this indicator is designed to provide valuable insights aligned with Gann’s original concepts while delivering a seamless user experience for today’s traders. With just a few clicks, you can transform market data into a geometric pattern of time and price, setting the stage for strategic trading based on the cyclical nature of financial markets.

Premium & Discount Delta Volume [BigBeluga]Premium & Discount Delta Volume is an advanced volume-based tool that helps traders identify zones of market imbalances by using the concepts of premium and discount pricing, commonly taught by ICT trader. It calculates and highlights periods where the market is trading at a premium (selling pressure is stronger) or a discount (buying pressure is stronger) and dynamically plots these zones over time. The indicator also calculates delta volume between buying and selling within these zones, showing shifts in market sentiment and potential areas for reversals or continuations.
🔵 IDEA
The Premium & Discount Delta Volume indicator is rooted in the ICT (Inner Circle Trader) concept of premium and discount zones. This concept divides the price action into two key zones:
Premium Zone : This area is where the market is trading at a level where sellers dominate, leading to more selling pressure. The idea is that the price is overvalued, and a potential drop could occur as the market reverts to a balanced state.
Discount Zone : This area is where the market is undervalued, with buyers dominating and applying upward pressure. Prices in this area often indicate opportunities to buy into strength as the market moves back to equilibrium.
At the core of the indicator is the delta volume, which measures the difference between buying and selling pressure within the premium and discount zones. When the delta volume is negative, it signals a downtrend with more selling pressure, while a positive delta volume signals an uptrend with more buying pressure. These zones and their associated delta values update dynamically, providing traders with real-time insights into market strength and potential price reversals.
The equilibrium in the middle of the premium and discount zones represents the balance point between buyers and sellers. When price moves away from equilibrium, it either enters the premium zone (potentially overbought) or the discount zone (potentially oversold), helping traders make more informed decisions based on volume and price structure.
🔵 KEY FEATURES & USAGE
Premium & Discount Zones:
The indicator automatically identifies and plots premium and discount zones on the chart. Premium zones count only negative (selling) volume, while discount zones count only positive (buying) volume. These zones are key areas of interest for identifying potential price reversals or continuations based on volume pressure.
Dynamic Delta Volume Calculation:
The indicator calculates delta volume between the premium and discount zones, showing the imbalance between buyers and sellers. A positive delta volume inside the discount zone suggests strong buying pressure, while a negative delta inside the premium zone suggests strong selling pressure. This helps traders quickly identify trends or market exhaustion.
Up Trend:
Down Trend:
Real-time Updates & Equilibrium Line:
The zones update dynamically every 100 bars or after price crosses them, ensuring that traders always have the most relevant market data. The equilibrium line in the middle of the zones helps traders gauge whether the market is balanced or moving into overbought (premium) or oversold (discount) territory.
Macro and Local Period Calculations:
The indicator allows traders to customize two different periods for analysis: a smaller lookback period (e.g., 50 bars) for short-term price action and a macro period (e.g., 200 bars) for larger trends. Each period has its own premium and discount zones, allowing for a multi-timeframe view of market strength.
Macro:
Both:
Color-coded background for Volume Pressure:
The background color of the smaller period premium and discount box changes based on delta volume. A positive delta turns the background blue, indicating higher buy pressure, while a negative delta turns the background red, signaling higher sell pressure.
🔵 CUSTOMIZATION
Toggle Premium & Discount: Traders can choose to display support and resistance levels based on the high and low points of the premium and discount zones.
Premium & Discount Lookback Period: Traders can adjust the lookback period to define the length of price action to be analyzed for premium and discount zones. A shorter period focuses on more recent market activity, while a longer period provides a broader view of trends.
Macro Highs/Lows Period: The indicator also offers a macro lookback period for identifying larger market trends and key levels of buying or selling volume.
Toggle Macro Levels: Macro levels help identify long-term price extremes, and traders can toggle this feature on or off as needed.

Tail ProbabilitiesThe Tail Probabilities indicator offers a sophisticated analysis of potential price distributions, providing traders with a probabilistic framework for forecasting future price behavior based on historical data. By estimating the likelihood of the price closing above or below specified thresholds, the indicator assists in evaluating market sentiment, volatility, and associated risks. The probability calculations are derived from a user-defined analysis window, which operates independently of the transform length window. The transform length parameter dictates the volume of historical data utilized in the calculations, and it must correspond to the window length applied in the mean and standard deviation lines indicator to ensure consistency in visual representation.
Overview of Plotted Probabilities
This indicator plots three core probabilities and their moving averages, involving four primary user inputs:
User Inputs
Tail Type: Allows the user to choose between analyzing the left tail (representing downside risk) or the right tail (representing upside potential).
Transform Window Length (Bars): Specifies the amount of historical data used to calculate the mean and standard deviation. This value must align with the window length applied in the mean and standard deviation lines indicator .
Analysis Period (Bars): Defines the number of historical bars used for probability analysis, setting the window over which probabilities are computed.
SMA Length (Bars): Specifies the length of the simple moving average (SMA) used to plot the historical average of the calculated probabilities. The SMA Length input allows users to plot a simple moving average of the calculated probabilities, providing a smoother historical average and helping to identify trends in the probability values over time.
Key Probabilities Plotted
Probability to Close Above or Below Upper Bound: Represents the likelihood that the price will close above or below an upper threshold derived from the mean and standard deviation lines indicator . This measure helps identify potential for significant upward or downward price movement, depending on the current price relative to the threshold.
Probability to Close Above or Below Mean: Indicates the probability of the closing price being either above or below the mean level, reflecting historical price tendencies and suggesting the presence of skewness in the price distribution.
Probability to Close Above or Below Lower Bound: Reflects the likelihood of the price closing above or below a lower threshold, offering insights into potential risk and directional movement.
The indicator adjusts based on the chosen tail type ("Left" or "Right"), thereby enabling users to assess both potential upward and downward price movements, making it adaptable to varying market conditions.
How Probabilities Are Calculated
The probabilities are calculated through a detailed analysis of historical price data over a user-specified analysis window. Below is an outline of the key steps involved in these calculations:
Calculate Mean and Standard Deviation: The mean and standard deviation are computed using the transform length window, which defines the historical data range employed.
Define Bounds: Upper, mean, and lower bounds are established based on the calculated mean and standard deviation, allowing identification of significant levels within the price distribution.
Count Events: The frequency with which the closing price crosses above or below these bounds is counted over the user-specified probability analysis window.
Calculate Probabilities: Probabilities are then computed as the percentage of observed events relative to the total number of observations in the analysis window.
For example, the probability of closing above the upper bound is calculated as:
Probability = (Number of times price closes above the upper bound) / (Total number of observations in the analysis window) * 100
Practical Usage
Risk Management: The indicator provides a quantitative measure of the probability of extreme price movements, aiding traders in setting stop-loss and take-profit levels based on statistical expectations.
Trend Analysis: The probability of closing above the mean can also serve as an indicator of potential skewness in the price distribution. Values above 50 indicate a right-skewed distribution, while values below 50 indicate a left-skewed distribution for the right tail probability. For the left tail probability, values over 50 indicate a left skew and values below 50 indicate a right skew in the distribution.
Scenario Analysis: By focusing on either the left or right tail, traders can quickly determine whether to prioritize downside protection or capitalize on upside potential. Depending on market conditions and whether the trader is long or short, both upward and downward movements can be analyzed, enabling a comprehensive risk assessment.
Limitations
While the Tail Probabilities indicator provides valuable probabilistic insights based on historical data, it is crucial to understand that historical performance does not guarantee future outcomes. Market dynamics are subject to rapid changes, and relying exclusively on historical probabilities may result in inaccurate assessments. Traders should use this indicator in conjunction with other technical analysis tools, fundamental analysis, and an understanding of broader market conditions to ensure robust decision-making.
Summary
The Tail Probabilities indicator is an advanced tool designed for traders seeking a probabilistic perspective on market behavior. By providing critical insights into the potential distribution of prices beyond significant thresholds, the indicator supports informed decision-making, whether in trending or uncertain market environments.

Multi Timeframe Breakout/Retest (Gap, FVG, B&R)📊 Breakout & Retest Multi-Timeframe Indicator - Support and Resistance Indicator 📊
In short, this indicator scans 4 timeframes of your choice to check if a proper breakout of your support and resistance lines you input has happened. It color-coats your support and resistance levels based on the type of breakout, labels the levels, and shows which timeframes have had a proper breakout in an interactive table. This tool is primarily used to determine when a breakout—whether Fair Value Gap (FVG), gap, or regular—has occurred, allowing you to confidently play the retest.
🔍 Types of Breakouts:
This indicator highlights three types of breakouts:
Regular Breakouts: Defined when a candle breaks above or below your level, then closes, and the next candle’s wick does not touch that level.
Gap Breakouts: A gap breakout occurs when we gap above or below the level—often happening on daily candle opens and closes.
FVG Breakouts: An FVG breakout happens when a breakout above or below your level forms a Fair Value Gap, with your level inside the gap. These breakouts tend to have stronger retests
📋 Interactive Table
The table helps you visualize which levels are experiencing a breakout and on which timeframes. It color-codes each level based on breakout activity:
🔴 Red: No active breakouts
🟢 Green: Active regular breakout
🔵 Blue: Active FVG breakout
🟡 Yellow: Active gap breakout
🎨 Color Coating & Minimum Timeframe Breakouts
To make sure you're playing a true breakout, you want confirmation on at least 3 of your chosen timeframes. This indicator has an adjustable "active minimum breakout" setting, which can be customized between 1 and 4 timeframes. I personally find that when a breakout occurs on at least 3 timeframes, the retest tends to have a higher success rate. But you can adjust this setting based on your strategy.
🔧 Future Updates (Follow for Updates):
🚨 Alerts: Set alerts for breakouts and retests.
⚙️ Improved Error Handling: For a smoother experience.

Trading Ranges + ZScoreOverview
The "Trading Ranges + ZScore" script is a versatile technical indicator developed for TradingView. This tool combines two powerful concepts—price ranges and Z-Score analysis—to help traders identify potential trend reversals, overbought/oversold conditions, and trend strength. The script dynamically calculates price ranges based on recent price action and utilizes Z-Score to detect deviations from a statistical norm, providing valuable insights for decision-making in both ranging and trending markets.
Features
Price Ranges: Calculates dynamic upper and lower price boundaries based on volatility and market structure.
Z-Score Oscillator: A statistical measure that highlights overbought/oversold conditions based on the deviation from a moving average.
Trend Detection: Identifies trend continuation or reversal points by comparing current price action against historical levels.
Customizable Alerts: Generates visual signals (diamonds and X crosses) for potential long/short entries and exits.
Visual Representation: Colors the bars based on Z-Score and trend direction, enhancing the chart’s readability and signal clarity.
Customizable Parameters: The script allows users to fine-tune perception length, analysis period, factor multiplier, and oscillator thresholds to fit different market conditions.
Key Input Parameters
Perception: The length used for calculating highest/lowest price points (default: 20).
Analysis: The length used for calculating the moving average and volatility (default: 100).
Factor: A multiplier to adjust the width of the price ranges (default: 2.0).
Oscillator Threshold: The overbought/oversold threshold for the Z-Score oscillator (default: 70).
Trend Filter: A boolean switch that filters signals based on trend direction.
Fill Zones: Option to color-fill between price levels when certain conditions are met.
Bullish/Bearish/Neutral Colors: Customizable colors for bullish, bearish, and neutral signals.
How It Works
Price Ranges Calculation:
The script calculates five levels: two upper boundaries, the average price level, and two lower boundaries. These levels are based on the highest/lowest prices over a user-defined period and adjusted by volatility (Average True Range).
When the price crosses either of these levels, it suggests a significant change in market direction, potentially indicating a trend reversal.
Z-Score Oscillator:
The Z-Score is a statistical measurement of a price's position relative to its moving average. The indicator calculates two variations:
Z-Score based on the absolute difference between the price and the moving average.
Z-Score based on standard deviation.
These oscillators help detect extreme conditions where the price is likely to revert (overbought/oversold zones).
Trend Detection and Signals:
The indicator generates potential buy/sell signals when the price crosses the predefined levels or based on the fast Z-Score crossing the overbought/oversold thresholds.
Weak long/short signals are shown when the faster Z-Score oscillator reaches extreme levels but trend filters are applied to avoid noise.
Bar Colors and Signal Shapes:
Bar colors change dynamically to reflect the trend direction and Z-Score conditions. Signals for potential trades are displayed using diamonds and X crosses, making it easy to spot opportunities visually.
Visuals and Plots
Bar Colors: Changes the bar color based on Z-Score and trend direction.
Z-Score Plot: Displays two Z-Score oscillators, the standard and a faster one for detecting quicker price deviations.
Overbought/Oversold Zones: Highlighted by upper and lower thresholds of the Z-Score.
Long/Short Signals: Uses diamond-shaped markers for strong long/short signals and X-shaped markers for weaker signals.
Dynamic Range Lines: Plots lines for key price levels (upper/lower boundaries, mid-range) based on the dynamic range calculations.
Usage Guide
Identify Overbought/Oversold Conditions: Look for the Z-Score reaching extreme positive or negative values. When combined with trend signals, these conditions often point to a potential reversal.
Follow the Trend: Use the trend filter option to focus only on trades in the direction of the prevailing trend, reducing false signals in ranging markets.
Watch for Range Breakouts: Pay attention to the upper and lower boundaries. Price crossing these levels often signals the start of a new trend or a major price movement.
Adjust Parameters: Tailor the perception length, analysis length, and multiplier to suit different asset classes or timeframes.
Customization
You can adjust the key parameters to adapt the indicator to different markets or personal trading preferences:
- Perception & Analysis Lengths: Control the sensitivity of the price range calculations.
- Factor Multiplier: Adjusts the width of the ranges, with higher values indicating larger zones.
- Oscillator Threshold: Modify the overbought/oversold levels to suit different market volatility.
- Trend Filter: Toggle on/off to focus on trend-following strategies or range-bound conditions.
- Visual Options: Customize colors for bullish, bearish, and neutral signals, as well as enable/disable the zone fills.

Volumetric Volatility Breaker Blocks [UAlgo]The "Volumetric Volatility Breaker Blocks " indicator is designed for traders who want a comprehensive understanding of market volatility combined with volume analysis. This indicator provides a clear visualization of significant volatility areas (or blocks), characterized by price movements that exceed a specific volatility threshold, as calculated using the ATR (Average True Range). The concept is enhanced by integrating volume-based insights, offering a view of market activity that helps users to recognize when significant price changes are being supported by an appropriate level of market participation.
The indicator calculates breaker blocks for both bullish and bearish market conditions, providing distinct visual elements that identify periods of high volatility and substantial volume divergence. The focus on both volume and volatility makes this tool versatile, allowing traders to assess the strength of price movements as well as areas where price might break above or below previously established levels.
It supports adjustable parameters, such as volatility length, smoothness factor, and volume display, allowing traders to fine-tune the indicator according to their trading strategy and market environment. The highlighted breaker blocks assist in identifying zones of potential price reversal or continuation, which can be critical for making informed trading decisions.
🔶 Key Features
Volatility-Based Block Identification: The indicator uses the Average True Range (ATR) to determine the volatility of the market. When the ATR exceeds a specified threshold (smooth ATR multiplied by a user-defined multiplier), it highlights these areas as volatility blocks. The idea is to mark periods where price activity is significantly divergent from normal conditions, which often signals market opportunities.
Volume Integrated Analysis: In addition to tracking volatility, the indicator incorporates volume data, allowing traders to see the amount of activity that occurs during these high-volatility periods. This helps in identifying whether a price movement is likely sustainable or whether it lacks market support.
User Adjustable Parameters: The indicator offers customization options for the volatility length (using ATR), smooth length, and multiplier for sensitivity adjustment. These settings enable users to modify the indicator’s responsiveness to market conditions.
The option to display the last few volatility blocks allows traders to manage clutter on their charts and focus only on the most recent significant data.
Mitigation Method: Users can select between different mitigation methods ("Close" or "Wick") to determine how blocks are broken. This adds an extra layer of adaptability, allowing traders to modify the indicator's response based on different price action strategies.
Dynamic Visual Representation: The indicator dynamically draws boxes for volatility blocks and shades them according to market direction, with split areas showing the bullish and bearish strength contributions. It also provides percentage volume for each block, helping traders understand the relative market participation during these moves.
🔶 Interpreting the Indicator
Identifying High Volatility Areas: When a new volatility block appears, it signifies that the market is experiencing higher-than-usual volatility, driven by increased ATR values. Traders should pay attention to these blocks, as they often indicate that a significant price move is occurring. Bullish blocks suggest upward pressure, whereas bearish blocks indicate downward pressure.
Volume Insights: The volume associated with each volatility block provides an insight into how much market participation accompanies these moves. Higher volume within a block implies that the market is actively supporting the price change, which may be a sign of continuation. Low volume suggests that the movement may lack the strength to persist.
Bullish vs. Bearish Strength Analysis: Each block is split into bullish and bearish strength, giving a clearer picture of what’s happening within the volatility period. If the bullish portion dominates, it indicates strong upward sentiment during that period. Conversely, if the bearish side is more prominent, there is more selling pressure. This breakdown helps in understanding intra-block market dynamics.
Volume Percentage Display: The indicator also displays the volume percentage in each block, which provides context for the strength of the move relative to recent market activity. Higher percentages mean more market engagement, which could confirm the legitimacy of a trend or a significant breakout.
🔶 Disclaimer
Use with Caution: This indicator is provided for educational and informational purposes only and should not be considered as financial advice. Users should exercise caution and perform their own analysis before making trading decisions based on the indicator's signals.
Not Financial Advice: The information provided by this indicator does not constitute financial advice, and the creator (UAlgo) shall not be held responsible for any trading losses incurred as a result of using this indicator.
Backtesting Recommended: Traders are encouraged to backtest the indicator thoroughly on historical data before using it in live trading to assess its performance and suitability for their trading strategies.
Risk Management: Trading involves inherent risks, and users should implement proper risk management strategies, including but not limited to stop-loss orders and position sizing, to mitigate potential losses.
No Guarantees: The accuracy and reliability of the indicator's signals cannot be guaranteed, as they are based on historical price data and past performance may not be indicative of future results.

Support Resistance ImportanceThe Support Resistance Importance indicator is designed to highlight key price levels based on the relationship between fractal occurrences and volume distribution within a given price range. By dividing the range into bins, the indicator calculates the total volume traded at each fractal level and normalizes the values for easy visualization. The normalized values represent an "importance score" for each price range, helping traders identify critical support and resistance levels where price action might react.
Key Features:
Fractal Detection:
The indicator detects Williams Fractals, which are specific price patterns representing potential market reversals. It identifies both upward fractals (potential resistance) and downward fractals (potential support).
Price Range Binning:
The price range is divided into a user-defined number of bins (default is 20). Each bin represents a segment of the total price range, allowing the indicator to bucket price action and track fractal volumes in each bin.
Volume-Based Importance Calculation:
For each bin, the indicator sums up the volume traded at the time a fractal occurred. The volumes are then normalized to reflect their relative importance.
The importance score is calculated as the relative volume in each bin, representing the potential influence of that price range. Higher scores indicate stronger support or resistance levels.
Normalization:
The volume data is normalized to allow for better comparison across bins. This normalization ensures that the highest and lowest volumes are scaled between 0 and 1 for visualization purposes. The smallest volume value is used to scale the rest, ensuring meaningful comparisons.
Visualization:
The indicator provides a table-based visualization showing the price range and the corresponding importance score for each bin.
Each bin is color-coded based on the normalized importance score, with blue or greenish shades indicating higher importance levels. The current price range is highlighted to help traders quickly identify relevant areas of interest.
Trading Utility:
Traders can use the importance scores to identify price levels where significant volume has accumulated at fractals. A higher importance score suggests a stronger likelihood of the price reacting to that level.
If a price moves towards a bin with a high score and the bins above it have much smaller values, it suggests that the price may "pump" up to the next high-scored range, similar to how price drops can occur.
Example Use Case:
Suppose the price approaches a bin with an importance score of 25, and the bins above have much smaller values. This suggests that price may break higher towards the next significant level of resistance, offering traders an opportunity to capitalize on the move by entering long positions or adjusting their stop losses.
This indicator is particularly useful for support and resistance trading, where understanding key levels of price action and volume can improve decision-making in anticipating market reactions.

Implied Volatility WallsThe Implied Volatility Walls (IVW) indicator is a powerful and advanced trading tool designed to help traders identify key market zones where price may encounter significant resistance or support based on volatility. Using implied volatility, historical volatility, and machine learning models, IVW provides traders with a comprehensive understanding of market dynamics. This indicator is especially useful for those who wish to forecast volatility-driven price movements and adjust their trading strategies accordingly.
How the Implied Volatility Walls (IVW) Works:
The Implied Volatility Walls (IVW) indicator uses a combination of historical price data and advanced machine learning algorithms to calculate key volatility levels and forecast future market conditions. It tracks cumulative volatility, identifies support and resistance zones, and detects liquidation bubbles to highlight critical price areas.
The main concept behind this tool is that price tends to move most of the time by the same amount, making it possible to average the past maximum excursion in order to obtain a validated area where traders can be able to see clearly that the price is moving more than normal.
This indicator primarily focuses on:
1. Volatility Zones: Potential support and resistance levels based on implied and historical volatility.
2. Machine Learning Volatility Forecast: A machine learning model that predicts high, medium, or low volatility for future market conditions.
3. Liquidation Detection: Highlights key areas of potential forced liquidations, where market participants may be forced out of their positions, often leading to significant price movements.
4. Backtesting and Win Rate: The indicator continuously monitors how effective its volatility-based predictions are, offering insights into the performance of its predictions.
Key Features:
1. Volatility Tracking:
- The IVW indicator calculates cumulative volatility by analyzing the range between the high and low prices over time. It also tracks volatility percentiles and separates the market conditions into high, medium, or low volatility zones, enabling traders to gauge how volatile the market is.
2. Volatility Walls (Upper and Lower Zones):
- Upper Volatility Wall (Red Zones): Represent resistance levels where the price might encounter difficulty moving higher due to excess in volatility. This zone is calculated based on the chosen percentile in the settings.
- Lower Volatility Wall (Blue Zones): Represent support levels where price may find buying support.
- These walls help traders visualize potential zones where reversals or breakouts could occur based on volatility conditions.
3. Machine Learning Forecast:
- One of the standout features of the IVW indicator is its machine learning algorithm that estimates future volatility levels. It categorizes volatility into high, medium, and low based on recent data and provides forecasts on what the next market condition is likely to be.
- This forecast helps traders anticipate market conditions and adapt their strategies accordingly. It is displayed on the chart as "Exp. Vol", providing insight into the future expected volatility.
4. VIX Adjustments:
- The indicator can be adjusted using the well-known **VIX (Volatility Index)** to further refine its volatility predictions. This enables traders to incorporate market sentiment into their analysis, improving the accuracy of the predictions for different market conditions.
5. Liquidation Bubbles:
- The Liquidation Bubbles feature highlights areas where large forced selling or buying events may occur, which are usually accompanied by spikes in volatility and volume. These bubbles appear when price deviates significantly from moving averages with substantial volume increases, alerting traders to potential volatile moves.
- Red dots indicate likely forced liquidations on the upside, and blue dots indicate forced liquidations on the downside. These bubbles can help traders spot moments of market stress and potential price swings due to liquidations.
6. Dynamic Volatility Zones:
- IVW dynamically adjusts support and resistance levels as market conditions evolve. This allows traders to always have up-to-date and relevant information based on the latest volatility patterns.
7. Cumulative Volatility Histogram:
- At the bottom of the chart, the purple histogram represents cumulative volatility over time, giving traders a visual cue of whether volatility is building up or subsiding. This can provide early signals of market transitions from low to high volatility, aiding traders in timing their entries and exits more accurately.
8. Backtesting and Win Rate:
- The IVW indicator includes a backtesting function that monitors the success of its volatility predictions over a selected period. It shows a Win Rate (WR) percentage (with 33% meaning that the machine learning algorithm does not bring any edge), representing how often the indicator's predictions were correct. This metric is crucial for assessing the reliability of the model’s forecasts.
9. Opening Range:
- At the beginning of a new session, the indicator will plot two lines indicating the high and the low of the first candle of the new time frame chosen.
Chart Breakdown:
Below is a description of what users see when using the Implied Volatility Walls (IVW) indicator on the chart:
Volatility Walls:
- Red shaded zones at the top represent upper volatility walls (resistance zones), while blue shaded zones at the bottom represent lower volatility walls (support zones). These areas show where price is likely to react due to high or low volatility conditions.
Liquidation Bubbles:
- Red and blue dots plotted above and below the price represent **liquidation bubbles**, indicating moments of market stress where volatility and volume spikes may force market participants to exit positions.
Cumulative Volatility Histogram:
- The purple histogram at the bottom of the chart reflects the buildup of cumulative volatility over time. Higher bars suggest increased volatility, signaling the potential for large price movements, while smaller bars represent calmer market conditions.
Real-Time Support and Resistance Levels:
- Solid and dashed lines represent current and historical support and resistance levels, helping traders identify price zones that have historically acted as volatility-driven turning points.
Gradient Bar Colors:
- The price bars change color based on their proximity to the volatility walls, with different colors representing how close the price is to these key levels. This color gradient provides a quick visual cue of potential market turning points.
Data Tables Explained:
Table 1: **Volatility Information Table (Top Right Corner):
- EV: Expected Volatility (based on the VIX FIX calculation from Larry Williams).
- +V and -V: Represents the adjusted volatility for upward (+V) and downward (-V) movements.
- Exp. Vol: Shows the expected volatility condition for the next period (High, Medium, or Low) based on the machine learning algorithm.
- WR: The Win Rate based on the backtesting of previous volatility predictions (three outcomes, so base Win rate is 33%, and not 50%).
Table 2: Expected Cumulative Range (Top Right Corner of the separated pane):
- Exp. CR: Expected Cumulative Range based on a machine learning algorithm that calculate the most likely outcome (cumulative range) based on the past days and metrics.
How to Use the Indicator:
1. Identify Key Support and Resistance Levels:
- Use the upper (red) and lower (blue) volatility walls to identify zones where the price is likely to face resistance or support due to volatility dynamics.
2. Forecast Future Volatility:
- Pay attention to the Expected Vol field in the table to understand whether the machine learning model predicts high, medium, or low volatility for the next trading session.
3. Monitor Liquidation Bubbles:
- Watch for red and blue bubbles as they can signal significant market events where volatility and volume spikes may lead to sudden price reversals or continuations.
4. Use the Histogram to Gauge Market Conditions:
- The cumulative volatility histogram shows whether the market is entering a high or low volatility phase, helping you adjust your risk accordingly and making you able to identify the potential of the rest of the chosen session.
5. Backtesting Confidence:
- The Win Rate (WR) provides insight into how reliable the indicator’s predictions have been over the backtested period, giving you additional confidence in its future forecasts, remember that considering the 3 scenarios possible (high volatility, medium and low volatility), the standard win rate is 33%, and not 50%!.
Final Notes:
The Implied Volatility Walls (IVW) indicator is a powerful tool for volatility-based analysis, providing traders with real-time data on potential support and resistance levels, liquidation bubbles, and future market conditions. By leveraging a machine learning model for volatility forecasting, this tool helps traders stay ahead of the market’s volatility patterns and make informed decisions.
Disclaimer: This tool is for educational purposes only and should not be solely relied upon for trading decisions. Always perform your own research and risk management when trading.

Support and Resistance HeatmapThe "Support and Resistance Heatmap" indicator is designed to identify key support and resistance levels in the price action by using pivots and ATR (Average True Range) to define the sensitivity of zone detection. The zones are plotted as horizontal lines on the chart, representing areas where the price has shown significant interaction. The indicator features a customizable heatmap to visualize the intensity of these zones, making it a powerful tool for technical analysis.
Features:
Dynamic Support and Resistance Zones:
Identifies potential support and resistance areas based on price pivots.
Zones are defined by ATR-based thresholds, making them adaptive to market volatility.
Customization Options:
Heatmap Visualization: Toggle the heatmap on/off to view the strength of each zone.
Sensitivity Control: Modify the zone sensitivity with the ATR Multiplier to increase or decrease zone detection precision.
Confirmations: Set how many touches a level needs before it is confirmed as a zone.
Extended Zone Visualization:
Option to extend the zones for better long-term visibility.
Ability to limit the number of zones displayed to avoid clutter on the chart.
Color-Coded Zones:
Color-coded zones help differentiate between bullish (support) and bearish (resistance) levels, providing visual clarity for traders.
Heatmap Integration:
Gradient-based color changes on levels show the intensity of touches, helping traders understand which zones are more reliable.
Inputs and Settings:
1. Settings Group:
Length:
Determines the number of bars used for the pivot lookback. This directly affects how frequently new zones are formed.
Sensitivity:
Controls the sensitivity of the zone calculation using ATR (Average True Range). A higher value will result in fewer, larger zones, while a lower value increases the number of detected zones.
Confirmations:
Sets the number of price touches needed before a level is confirmed as a support/resistance zone. Lower values will result in more zones.
2. Visual Group:
Extend Zones:
Option to extend the support and resistance lines across the chart for better visibility over time.
Max Zones to Display (maxZonesToShow):
Limits the maximum number of zones shown on the chart to avoid clutter.
3. Heatmap Group:
Show Heatmap:
Toggle the heatmap display on/off. When enabled, the script visualizes the strength of the zones using color intensity.
Core Logic:
Pivot Calculation:
The script identifies support and resistance zones by using the pivotHigh and pivotLow functions. These pivots are calculated using a lookback period, which defines the number of candles to the left and right of the pivot point.
ATR-Based Threshold:
ATR (Average True Range) is used to create dynamic zones based on volatility. The ATR acts as a buffer around the identified pivot points, creating zones that are more flexible and adaptable to market conditions.
Merging Zones:
If two zones are close to each other (within a certain threshold), they are merged into a single zone. This reduces overlapping zones and gives a cleaner visual representation of significant price levels.
Confirmation Mechanism:
Each time the price touches a zone, the confirmation counter for that zone increases. The more confirmations a zone has, the more reliable it is. Zones are only displayed if they meet the required number of confirmations as specified by the user.
Color Gradient:
Zones are color-coded based on the number of confirmations. A gradient is used to visually represent the strength of each zone, with stronger zones being more vividly colored.
Heatmap Visualization:
When the heatmap is enabled, the color intensity of the zones is adjusted based on the proximity of the price to the zone and the number of touches the zone has received. This helps traders quickly identify which zones are more critical.
How to Use:
Identifying Support and Resistance Zones:
After adding the indicator to your chart, you will see horizontal lines representing key support (bullish) and resistance (bearish) levels. These zones are dynamically updated based on price action and pivots.
Adjusting Zone Sensitivity:
Use the "ATR Multiplier" to fine-tune how sensitive the indicator is to price fluctuations. A higher multiplier will reduce the number of zones, focusing on more significant levels.
Using Confirmations:
The more times a price interacts with a zone, the stronger that zone becomes. Use the "Confirmations" input to filter out weaker zones. This ensures that only zones with enough interaction (touches) are plotted.
Activating the Heatmap:
Enabling the heatmap will provide a color-coded visual representation of the strength of the zones. Zones with more price interactions will appear more vividly, helping you focus on the most significant areas.
Best Practices:
Combine with Other Indicators:
This support and resistance indicator works well when combined with other technical analysis tools, such as oscillators (e.g., RSI, MACD) or moving averages, for better trade confirmations.
Adjust Sensitivity Based on Market Conditions:
In volatile markets, you may want to increase the ATR multiplier to focus on more significant support and resistance zones. In calmer markets, decreasing the multiplier can help you spot smaller, but relevant, levels.
Use in Different Time Frames:
This indicator can be used effectively across different time frames, from intraday charts (e.g., 1-minute or 5-minute charts) to longer-term analysis on daily or weekly charts.
Look for Confluences:
Zones that overlap with other indicators, such as Fibonacci retracements or key moving averages, tend to be more reliable. Use the zones in conjunction with other forms of analysis to increase your confidence in trade setups.
Limitations and Considerations:
False Breakouts:
In highly volatile markets, there may be false breakouts where the price briefly moves through a zone without a sustained trend. Consider combining this indicator with momentum-based tools to avoid false signals.
Sensitivity to ATR Settings:
The ATR multiplier is a key component of this indicator. Adjusting it too high or too low may result in too few or too many zones, respectively. It is important to fine-tune this setting based on your specific trading style and market conditions.