Wilder's Volatility Trailing Stop Strategy with various MA'sFor Educational Purposes. Results can differ on different markets and can fail at any time. Profit is not guaranteed.
This only works in a few markets and in certain situations. Changing the settings can give better or worse results for other markets. This strategy is based on Wilder's Volatility System. It is an ATR trailing stop that is used for long term trends. This strategy focuses on the trailing stop alone and goes long and short only when it goes above or below the trailing line. It is similar to Donchian channels except it does not include the certain period channel breakout, only the trailing signal. This is only the trailing stop and an attempt to show how well it works standalone as Wilder described.
In his book, Wilder recommends a multiplier of 2.8-3.1 and an ATR lookback of 7 periods along with a running moving average or otherwise known as Wilder's moving average. The calculation and programming part for the trailing stop varies everywhere. I opted to keep it as simple and accurate as I could think of and interpret from the book. The variations to these types of indicators are numerous unfortunately, but Wilder seems to be the original author of ATR and this ATR-based trailing stop. In his book he says to use the significant closing price or highest/lowest closing price for the calculation part but I also included the option of choosing the highest high and lowest low, and the option to choose various moving averages in case anyone wants to experiment.
Comparing this and Donchian channels, it seems that a 2.5 multiplier is somewhat similar to the middle band of DCs and a 3.0 multiplier is somewhat similar to a double length middle band of DCs. It's hard to say which is the better trailing stop for a long term strategy. It's hard to beat the simplicity of DCs but maybe some might find a need for more inputs in a trailing stop or maybe an ATR based one like Wilder's can work better depending on what setting or strategy it's used in.
Stop

Adjacent HMA StopRelease Note:
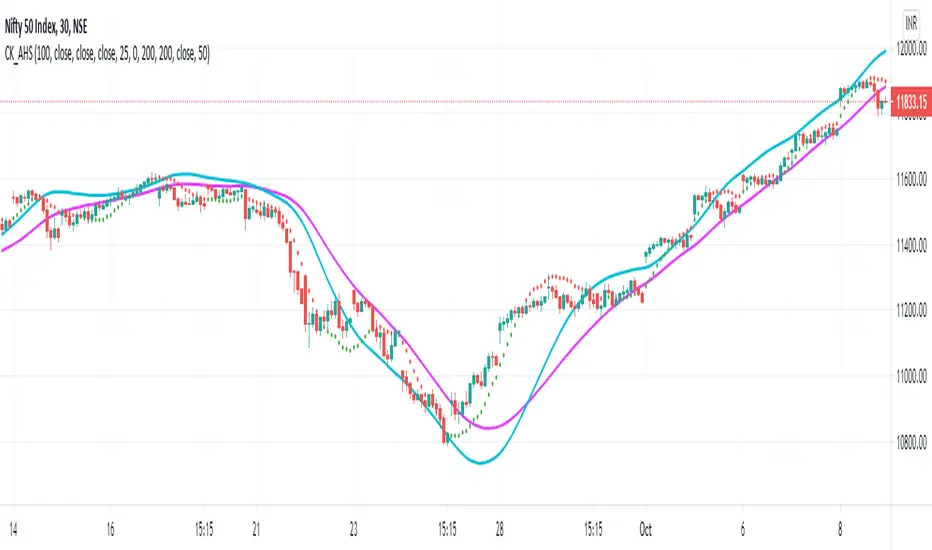
This indicator script setup is published to identify the strength and ride the trends.
HMA:
HMA 100 period is used as default. However this can be changed as per wish. Major turning points or decisions can be made using this HMA line. Purple color is used to identify this. This can be used as the final extreme stop for any trend before it turns.
Adjacent Line:
Blue colored Adjacent line can be used to determine the trend strength or ride the trend till it slows down. When trending move happens it can be ride till the candles comes within this Adjacent line. And then sideways move or the moves between HMA & Adjacent line can be traded
Stop:
Dotted lines in Red and Green colors are used as very tight stop. This can be also used as first level of profit booking when very strong move happens.
Trend View:
There is an optional 'Trend View' which can be used to determined the trend.
Disclaimer:
//This script/indicator published with the idea of finding the strength of any instruments. Trade decisions and execution are up to the traders/users as per their understanding
//Courtesy: Thanks to Alan Hull and Richard Donchian as some of the concepts are inspired from them
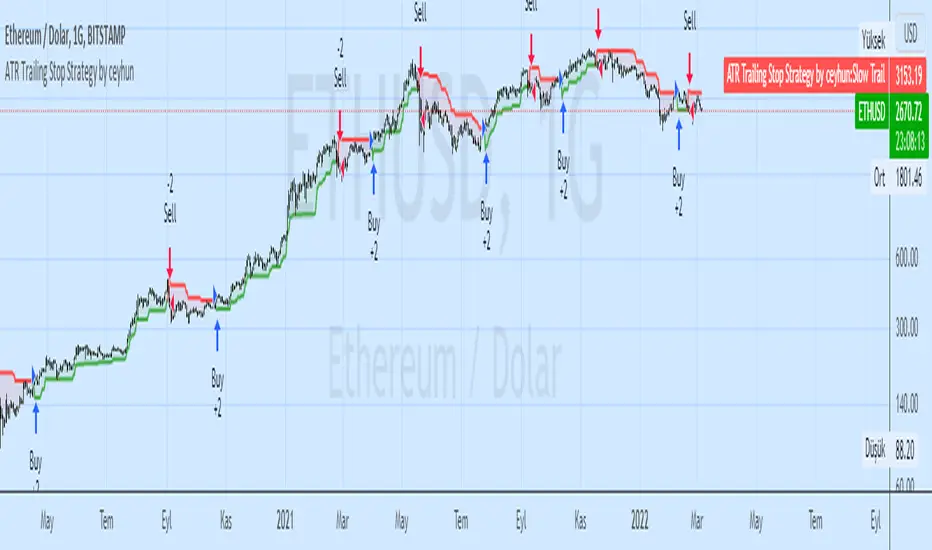
ATR Trailing Stop Strategy by ceyhunSame coding only coloring and strategy version added
//Barcolor
Green = Trail1 > Trail2 and close > Trail2 and low > Trail2
Blue = Trail1 > Trail2 and close > Trail2 and low < Trail2
Red = Trail2 > Trail1 and close < Trail2 and high < Trail2
Yellow = Trail2 > Trail1 and close < Trail2 and high > Trail2
//It gives White color where there is deterioration.
Let's not use InfoPanel in strategy, it would be wrong as it signals the next day.
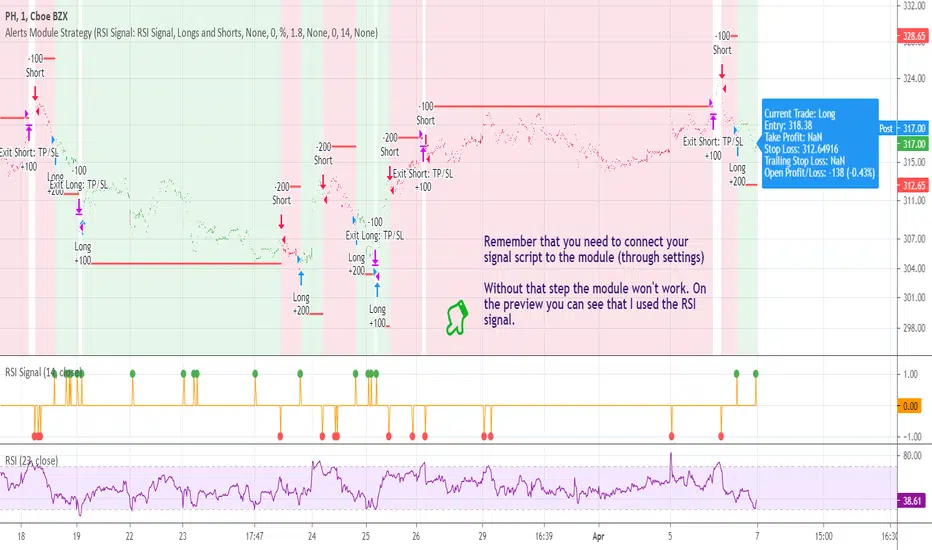
[STRATEGY] Buy/Sell/TP/SL/TSL Alerts ModuleA strategy version of the Buy/Sell/TP/SL/TSL Alerts Module .
It works the same way:
1) You choose a specific indicator and apply it to your chart
2) You create a special signal form of that indicator
3) You connect that form to the module
4) Bob's your uncle
If you have any questions don't hesitate to ask and contact me either via private messages on TradingView or via Telegram.
Thanks!
Tilson T3 and MavilimW Triple Combined StrategyInspired by truly greatful Kivanç Ozbilgic (www.tradingview.com).
The strategy tries to combined three different moving average strategies into one.
Strategies covered are:
1. Tillson T3 Moving Average Strategy
Developed by Tim Tillson, the T3 Moving Average is considered superior to traditional moving averages as it is smoother, more responsive and thus performs better in ranging market conditions as well. However, it bears the disadvantage of overshooting the price as it attempts to realign itself to current market conditions.
It incorporates a smoothing technique which allows it to plot curves more gradual than ordinary moving averages and with a smaller lag. Its smoothness is derived from the fact that it is a weighted sum of a single EMA, double EMA, triple EMA and so on. When a trend is formed, the price action will stay above or below the trend during most of its progression and will hardly be touched by any swings. Thus, a confirmed penetration of the T3 MA and the lack of a following reversal often indicates the end of a trend. Here is what the calculation looks like:
T3 = c1*e6 + c2*e5 + c3*e4 + c4*e3, where:
– e1 = EMA (Close, Period)
– e2 = EMA (e1, Period)
– e3 = EMA (e2, Period)
– e4 = EMA (e3, Period)
– e5 = EMA (e4, Period)
– e6 = EMA (e5, Period)
– a is the volume factor, default value is 0.7 but 0.618 can also be used
– c1 = – a^3
– c2 = 3*a^2 + 3*a^3
– c3 = – 6*a^2 – 3*a – 3*a^3
– c4 = 1 + 3*a + a^3 + 3*a^2
T3 MovingThe T3 Moving Average generally produces entry signals similar to other moving averages and thus is traded largely in the same manner.
Strategy for Tillson T3 is if the close crossovers T3 line and for at least five bars the close was under the T3
2. Tillson T3 Fibonacci Cross
Kivanc Ozbilgic added a second T3 line with a volume factor of 0.618 (Fibonacci Ratio) and length of 3 (fibonacci number) which can be added by selecting the T3 Fibonacci Strategy input box.
Strategy for Tillson T3 Fibo is when the Fibo Line crossover the T3 it gives long signal vice versa.
3. MavilimW
MavilimW is originally a support and resistance indicator based on fibonacci injected weighted moving averages.
Strategy for MavilimW is is if the close crossovers T3 line and for at least five bars the close was under the T3
Hope you enjoy

Stop Loss PanelHere is a label panel that shows the stop-loss number for Long or Short trades based on volatility using average true range and and a mult of that.

Triple ATR multiplier - 3 ATR Values in OneHere you can choose to plot 3 different ATR values in 1 window. I use this indicator to get the values of my stop loss and take profits.
You can change the multiplier value for each ATR Line and the length of the base ATR.
Ty

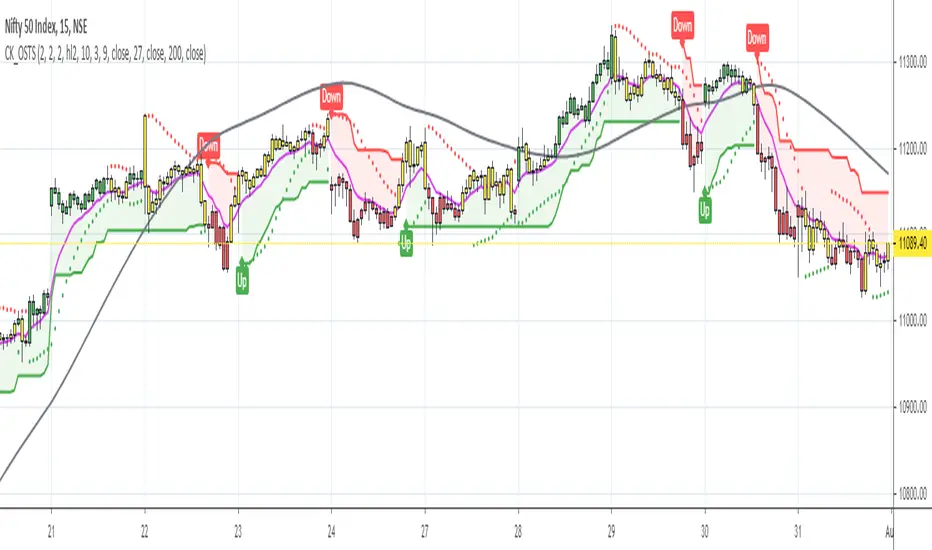
One-Stop Trading SetupOne-Stop Trading Setup:
This script designed to identify up, down, and sideways trends. 200 HMA, 9 EMA, PSAR, and ATR are used to identify the strength of any instrument.
Candle Colors - Simpler approach to follow:
Green color indicates for up side trade signals
Red color indicates for down side trade signals
Yellow color can be interpreted for stop, sideways, and counter trade trade signals
Multiple Trade Setups:
Green Zone - Trading green candles within green zone has better odds of long trades
Red Zone - Trading red candles within red zone has better odds of short trades
200 HMA - Candles above 200 HMA mostly for long trades. Candles below 200 HMA usually for short trades. But the zone also very important to consider
9 EMA - Cross over above 200 HMA in Green zone, look for long trades. Cross over below 200 HMA in red zone, look for short trades
PSAR - This can be used as potential initial warning sign. Also can be used to exit partial or wait for it goes to opposite side for taking trade decisions
Candle Above all - If Green candle and above all the indicators, then very good sign of long side. If red candle and below all indicators, then very good sign of short side.
Multiple Time Frame:
This works very well with any instrument and on any time frame. Always its better to do analysis on multi time frame before entry, exit, and trade execution. Back test it with this setup and also observe it on live market. That will give edge in taking trade decisions. All the best and happy trading.
Disclaimer:
This script and setup is written with the sole purpose of identifying the strength of any instrument. Interpretation, trade decisions, and changing inputs are up to each individual users/trades.
ATR with Take and StopThis simple indicator will plot the take profit and stop loss values based on the ATR indicator.
It's possible to set how many times the ATR value will be applied to the closing price and
what trade type is used, Long or Short.

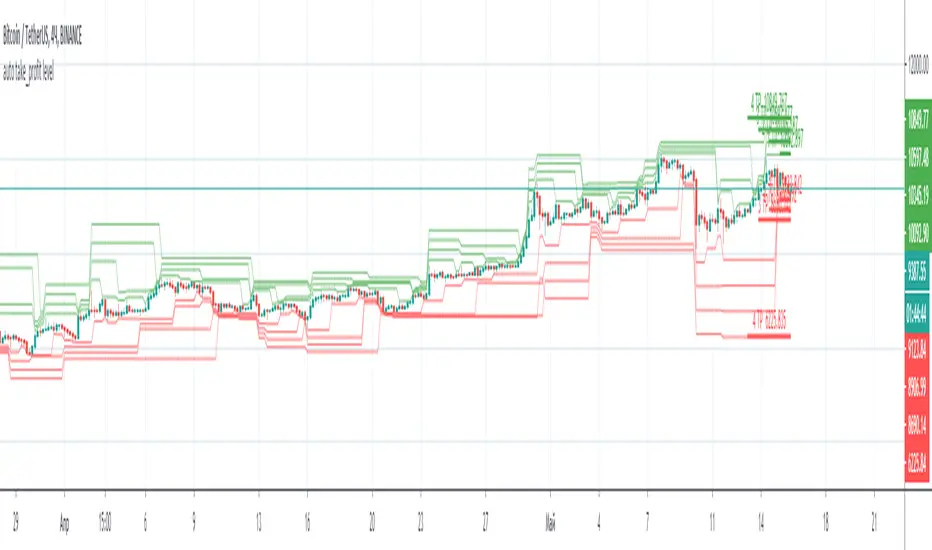
auto take_profit levelAutomatic indicator of take profit levels for any time frame.
It can be used as a visualization of resistance levels, when the lines are located next to each other, the price goes to the side where the levels are located more freely.
If you have an indicator with signals, you can set take profit by levels.
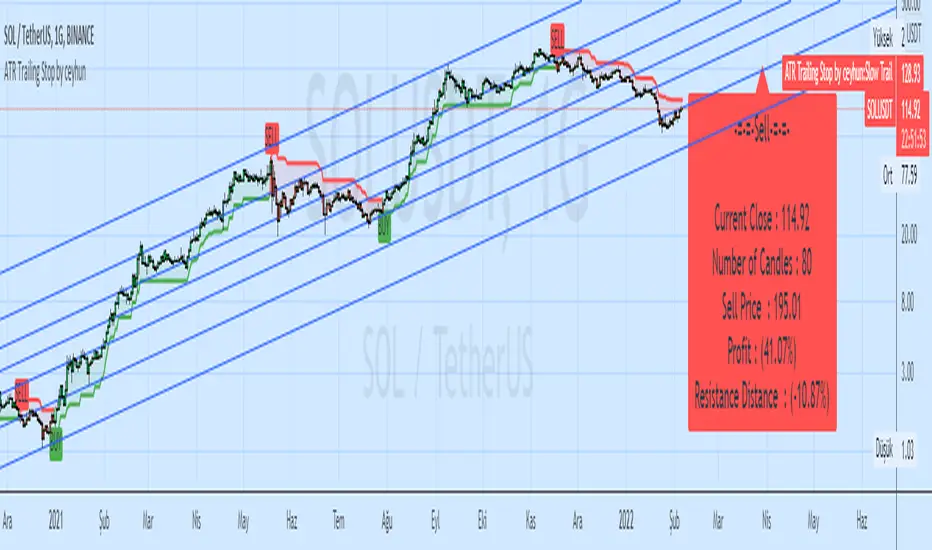
ATR Trailing Stop by ceyhunSame coding only coloring and information panel was added.
CDC ATR Trailing Stop V2.1 (2013)
//Barcolor
Green = Trail1 > Trail2 and close > Trail2 and low > Trail2
Blue = Trail1 > Trail2 and close > Trail2 and low < Trail2
Red = Trail2 > Trail1 and close < Trail2 and high < Trail2
Yellow = Trail2 > Trail1 and close < Trail2 and high > Trail2
//It gives White color where there is deterioration.
//InfoPanel
Buy Price = Blue draws the circles at the purchase price.
Profit Long>20 = Risk level taken as a percentage, I got the highest 20%, you can determine as you wish.
Sell Price = Red draws the circles at the purchase price.
Profit Short>20 = Risk level taken as a percentage, I got the highest 20%, you can determine as you wish.
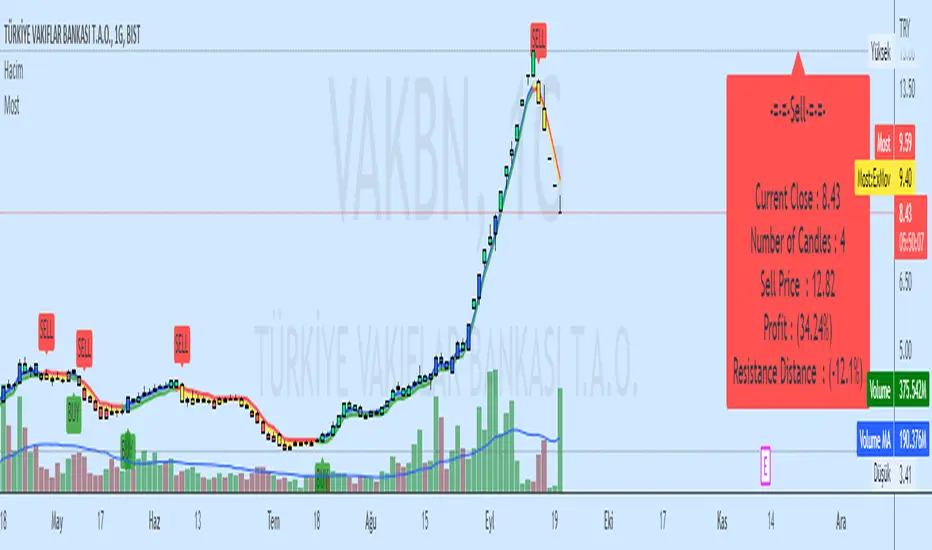
Moving Stop Loss (Most) by ceyhunATR is an indicator that has been removed and replaced with a moving average.Bar colors and infopanel have been added.
//Barcolor
Green = ExMov > Most and close > Most and low > Most
Blue = ExMov > Most and close > Most and low < Most
Red = Most > ExMov and close < Most and high < Most
Yellow = Most > ExMov and close < Most and high > Most
//It gives White color where there is deterioration.
//InfoPanel
Buy Price = Blue draws the circles at the purchase price.
Profit Long>20 = Risk level taken as a percentage, I got the highest 20%, you can determine as you wish.
Sell Price = Red draws the circles at the purchase price.
Profit Short>20 = Risk level taken as a percentage, I got the highest 20%, you can determine as you wish.
==Atr Original Code==
CDC ATR Trailing Stop V2.1 (2013)
==Most Code==
MOST by Anıl ÖZEKŞİ
Barcolor
Barcolor
Percent Trailing Stop (%) - For Study Scripts===========
Percent Trailing Stop (%) - { FOR STUDY SCRIPTS }
===========
Wow - this is an example of how to implement Alerts relating to a Trailing Stop (%) within your Study Script. It's taken a bit of effort to get this working but I think we got there!
Alerts include Open Long/Short, Trailing Stop Hit, and (the most important one) Movement of Trailing Stop! <- this is actually really quite good, by the way! :)
You can ignore the actual entry/exit orders - they're based on a simple MA cross and are therefore NOT relevant, NOT profitable and NOT recommended!
You should be using this code as a way of adding a Trailing Stop to your own scripts - hope it helps!
Set your "Open Long/Short" Alert to "Once per Bar Close" - Set your "Trailing Stop Hit" Alert to "Once per Bar" - Set your "Move TSL" Alert to "Once per Bar Close". - You're all done! Enjoy.
-----------
Good Luck and Happy Trading!

Fixed Percent Stop Loss & Take Profit % - For Study Scripts===========
Fixed Percent Stop Loss & Take Profit % - { FOR STUDY SCRIPTS! }
===========
A neat example of how to set up Fixed Stops and Take Profit as a percent of the entry price - This is for setting Alerts within your own Study Script for when either your SL or TP get hit.
Yup, that's about it!
You can ignore the actual entry/exit orders - they're based on a simple MA cross and are therefore NOT relevant, NOT profitable and NOT recommended!
You should be using this code as a way of adding Stops and Takes to your own scripts - hope it helps!
Set your "Open Long/Short" Alerts to be triggered "Once per Bar Close" - Set your "SL/TP" Alerts to trigger "Once per Bar".
--
We wrote this with a bit of a rush on! ~ If you spot any mistakes/bugs just let us know and we'll get round to them asap!
-----------
Good Luck and Happy Trading!

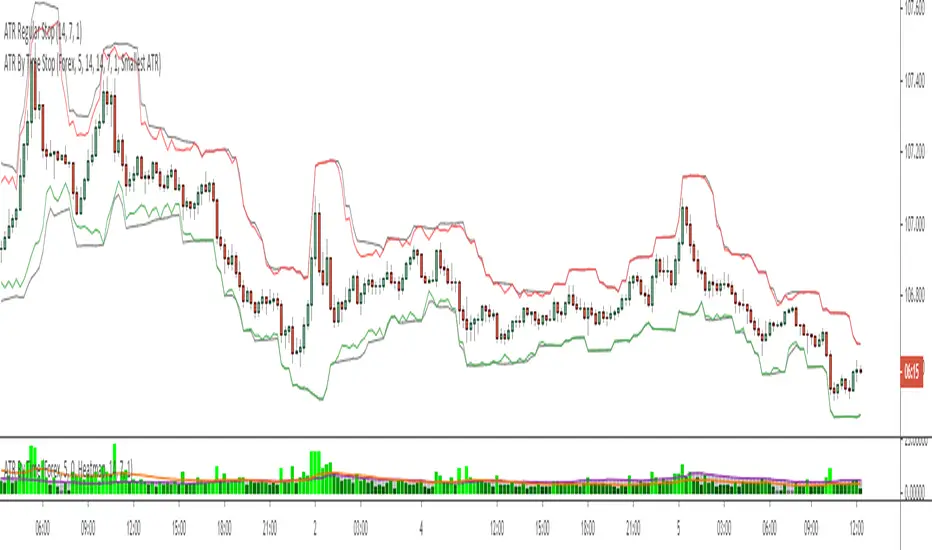
ATR By Time [Chart]What is ATR By Time (Chart)?
This premium indicator is a companion script to my ATR By Time indicator.
This companion script draws your stop loss price to the chart directly. In the above example, the black line represents a regular 1x ATR stop loss above and below price action, while the colored lines are the 1x ATR By Time indicator values when set to use the "Smallest ATR" in the settings menu.
When set to "Smallest ATR", the script calculates the regular ATR and the ATR By Time of Day and compares the distance of the two values. It then selects whichever value is smaller to be used as the stop loss, and adds or subtracts it to the most recent swing high or low (or the closing price if desired).
This allows for tighter stops and larger position sizing during certain times of day for aggressive traders when set to Smallest ATR, or wider stop losses during more volatile periods of the day for conservative traders when set to Largest ATR.
Stop Loss Distance Options:
- Regular ATR
- ATR By Time
- Smallest ATR
- Largest ATR
More Information
Similar to my RVOL By Time indicator, the ATR By Time indicator works on any market that has consistent trading session lengths . So it works best on Forex & Crypto, but also works on some Stock and Futures markets.
Instead of calculating the ATR based on recent price data like the regular ATR indicator, it calculates an ATR value for each candle based on that candle’s time of day .
For example, if you set the Lookback setting on this indicator to 14, then instead of calculating the ATR based on the past 14 candles, it will calculate an ATR value based on the past 14 trading sessions for each candle (as an average).
So in other words, your 10:00AM candle will show the average of the past 14 10:00AM candles rather than the past 14 candles leading up to that 10:00AM candle.
This is extremely useful for day traders in particular as it allows you to gauge the average range of candles during certain times of day instead of only by the most recent price action.
It also draws a regular ATR (optional) – so this is essentially an enhanced ATR script that gives you multiple readings on price volatility.
If you are interested in trying the script or you want more information on how the script works, there is more information available on my website including instructions on how to apply for a free trial: ATR By Time Feature Page .
Good luck with your trading!
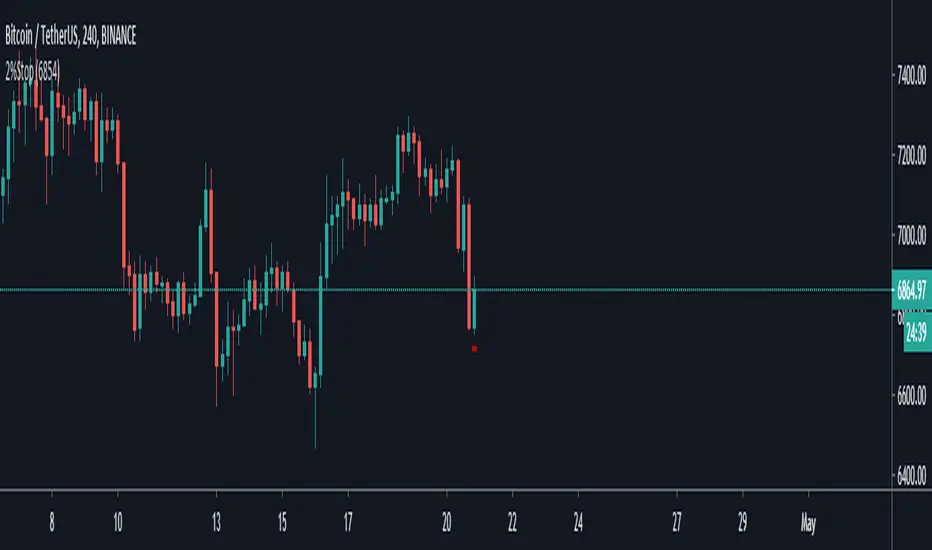
2% StopThis indicator is simply based on the 2% rule, you must insert the entry point (the price at what you bought) by clicking the gear on the top left.
If you see the chart different is becouse the default entry is set to 1 and but it fixes if you set the proper entry price.
a little bit about the 2% rule :
Following the 2% Rule will keep any loss in your account to a rela-
tively small, livable size.
The 2% Rule prohibits you from risking more than 2% of your account
equity on any single trade.
This Rule does
not limit your position size—it only limits your risk.
Of course, if you are planning to hold your position down to zero,
then its maximum size would have to be capped at 2%. On the
other hand, if you do a much more sensible thing and use a stop, your
risk per share will decrease, and your permitted size will increase.
The distance from your entry price to the stop level defines your
maximum dollar risk per coin.
The 2% Rule defines your maximum risk for the entire position.
Knowing the risk per share and the total permitted risk makes it
easy to calculate the maximum number of coins /shares you may trade.
Credit about this idea goes to Dr Elder Alexander.
High/Low stopFirst of all let me quote some important points :
• You need stops; a trade without a stop is a gamble.
• You need to know where you’ll put your stop before you enter
a trade.
• Everybody needs hard stops.
• Whenever you change a stop, you may move it only in the direc-
tion of the trade.
There is a variety of techniques available to traders who like to use
trailing stops:
• You can use a multibar low as a trailing stop; for example, you
can keep moving your stop to the lowest low of the last three
bars (but never against your trade).
• You can trail prices with a very short moving average and use its
level for a trailing stop.
• You can use a Chandelier stop—every time the market makes a
new high, move the stop within a certain distance from the top—
either a specific price range or a number based on an ATR (aver-
age true range). Any time your stock makes a new high, you place
your stop within that distance from the top, like hanging a chan-
delier (this method is described in Come into My Trading Room).
• You can use a Parabolic stop .
• You can use a SafeZone stop .
• You can use a Volatility-Drop stop (described below, for the first
time in trading literature).
• You can use a Time Stop to get out of your trade if it does not
move within a certain time. For example, if you enter a day-trade
and the stock does not move within 10 or 15 minutes, it is clearly
not doing what you expected and it is best to scratch that trade.
If you put on a swing trade which you expect to last several
days, but then a week goes by and the stock is still flat, it is
clearly not confirming your analysis and the safest action would
be to get out.
This is a summary taken from Dr Elder book and this indicator i coded from one of his book where he briefly mention this trailing stop technique but don't dive a lot into it, but still i found to be very effective.
You can use even the short stop (the green dots) as an entry point.

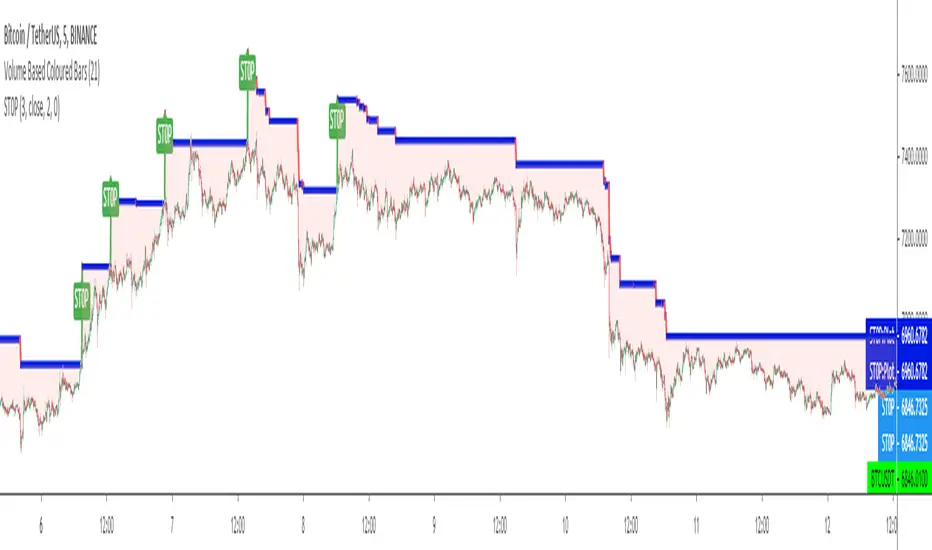
ST0PST0P is a kind of a TRAILING STOP LOSS INDICATOR in which users can set up LONG or SHORT trade versions and also can set up a STOP LOSS level by percent % or unit difference.
It tries to solve the problem of stop loss indicators' default BUY or SELL settings and non adjustable stop levels of % and difference change in price levels.
(Will try to make updates to add user defined start bars.)
Kıvanç Özbilgiç
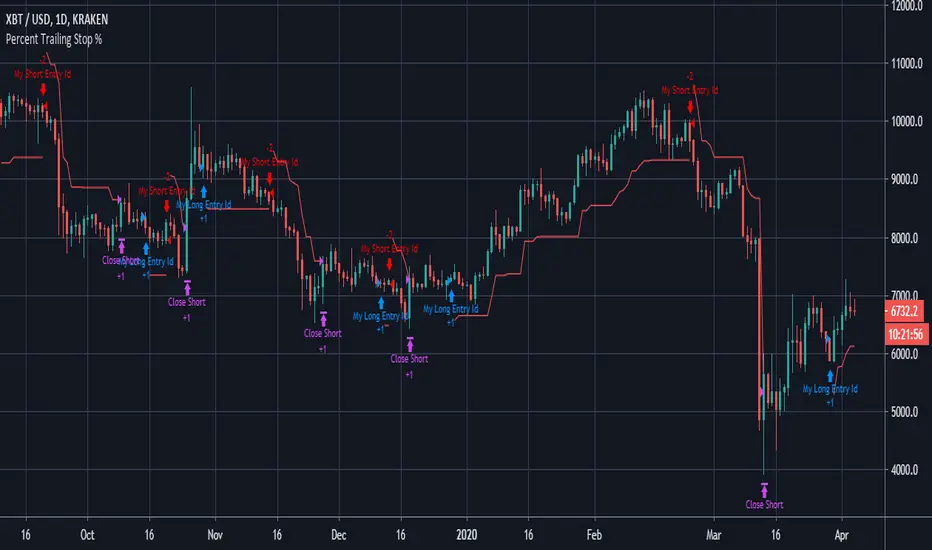
Percent Trailing Stop %===========
Percent Trailing Stop %
===========
Another Stop Loss Indicator today - our last Fixed SL/TP script went down quite well, this one is for adding a Percent Trailing Stop from Entry Price to your own strategy.
You can ignore the actual entry/exit orders - they're based on a simple MA cross and are therefore NOT relevant, NOT profitable and NOT recommended!
You should be using this code as a way of adding a % Trailing Stop to your own scripts - hope it helps!
You should also notice that a generally considered losing strategy (a simple MA cross) could actually become profitable with careful money management - try combining this Trailing Stop script with our Fixed Stop/Take Profit script for really accurate management of your capital.
-----------
Good Luck and Happy Trading!
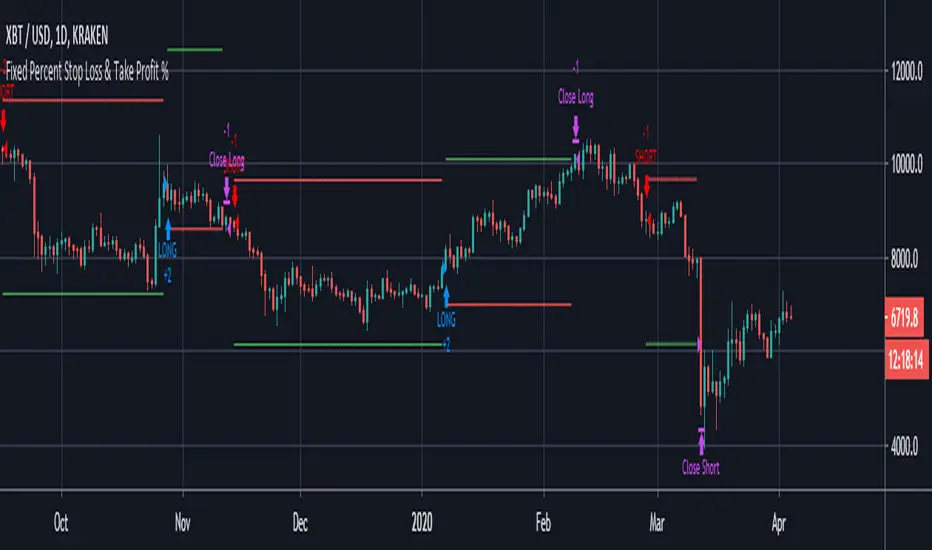
Fixed Percent Stop Loss & Take Profit %===========
Fixed Percent Stop Loss & Take Profit %
===========
A neat example of how to set up Fixed Stops and Take Profit as a percent of the entry price.
Yup, that's about it!
You can ignore the actual entry/exit orders - they're based on a simple MA cross and are therefore NOT relevant, NOT really profitable and NOT recommended!
You should be using this code as a way of adding Stops and Takes to your own scripts - hope it helps!
-----------
Good Luck and Happy Trading!
XPloRR S&P500 Stock Market Crash Detection Strategy v2XPloRR S&P500 Stock Market Crash Detection Strategy v2
Long-Term Trailing-Stop strategy detecting S&P500 Stock Market Crashes/Corrections and showing Volatility as warning signal for upcoming crashes
Detecting or avoiding stock market crashes seems to be the 'Holy Grail' of strategies.
Since none of the strategies that I tested can beat the long term Buy&Hold strategy, the purpose was to detect a stock market crash on the S&P500 and step out in time to minimize losses and beat the Buy&Hold strategy. So beat the Buy&Hold strategy with around 10 trades. 100% capitalize sold trade into new trade.
With the default parameters the strategy generates 10262% profit (starting at 01/01/1962 until release date), with 10 closed trades, 100% profitable, while the Buy&Hold strategy only generates 3633% profit, so this strategy beats the Buy&Hold strategy by 2.82 times !
Also the strategy detects all major S&P500 stock market crashes and corrections since 1962 depending on the Trailing Stop Smoothness parameter, and steps out in time to cut losses and steps in again after the bottom has been reached. The 5 major crashes/corrections of 1987, 1990, 2001, 2008 and 2010 were successfully detected with the default parameters.
The script was first released on November 03 2019 and detected the Corona Crash on March 04 2020 with a Volatility crash-alert and a Sell crash-alert.
I have also created an Alerter Study Script based on the engine of this script, which generates Buy, Sell and Volatility signals.
If you are interested in this Alerter version script, please drop me a mail.
The script shows a lot of graphical information:
the Close value is shown in light-green. When the Close value is temporarily lower than the Buy value, the Close value is shown in light-red. This way it is possible to evaluate the virtual losses during the current trade.
the Trailing Stop value is shown in dark-green. When the Sell value is lower than the Buy value, the last color of the trade will be red (best viewed when zoomed)
the EMA and SMA values for both Buy and Sell signals are shown as colored graphs
the Buy signals are labeled in blue and the Sell signals are labeled in purple
the Volatility is shown below in green and red. The Alert Threshold (red) is default set to 2 (see Volatility Threshold parameter below)
How to use this Strategy?
Select the SPX (S&P500) graph and add this script to the graph.
Look in the strategy tester overview to optimize the values Percent Profitable and Net Profit (using the strategy settings icon, you can increase/decrease the parameters), then keep using these parameters for future Buy/Sell signals on the S&P500.
More trades don't necessarily generate more overall profit. It is important to detect only the major crashes and avoid closing trades on the smaller corrections. Bearing the smaller corrections generates a higher profit.
Watch out for the Volatility Alerts generated at the bottom (red). The Threshold can by changed by the Volatility Threshold parameter (default=2% ATR). In almost all crashes/corrections there is an alert ahead of the crash.
Although the signal doesn't predict the exact timing of the crash/correction, it is a clear warning signal that bearish times are ahead!
The correction in December 2018 was not a major crash but there was already a red Volatility warning alert. If the Volatility Alert repeats the next weeks/months, chances are higher that a bigger crash or correction is near. As can be seen in the graphic, the deeper the crash is, the higher and wider the red Volatility signal goes. So keep an eye on the red flag!
Here are the parameters:
Fast MA Buy: buy trigger when Fast MA Buy crosses over the Slow MA Buy value (use values between 10-20)
Slow MA Buy: buy trigger when Fast MA Buy crosses over the Slow MA Buy value (use values between 21-50)
Minimum Buy Strength: minimum upward trend value of the Fast MA Buy value (directional coefficient)(use values between 10-100)
Fast MA Sell: sell trigger when Fast MA Sell crosses under the Slow MA Sell value (use values between 10-20)
Slow MA Sell: sell trigger when Fast MA Sell crosses under the Slow MA Sell value (use values between 21-50)
Minimum Sell Strength: minimum downward trend value of the Fast MA Sell value (directional coefficient)(use values between 10-100)
Trailing Stop ATR: trailing stop % distance from the smoothed Close value (use values between 2-20)
Trailing Stop Smoothness: MA value for smoothing out the Trailing Stop close value
Buy On Start Date: force Buy on start date even without Buy signal (default: true)
Sell On End Date: force Sell on end date even without Sell signal (default: true)
Volatility EMA Period: MA value of the Volatility value (default 15)
Volatility Threshold: Threshold value to change volatility graph to red (default 2)
Volatility Graph Scaler: Scaling of the volatility graph (default 5)
Important : optimizing and using these parameters is no guarantee for future winning trades!

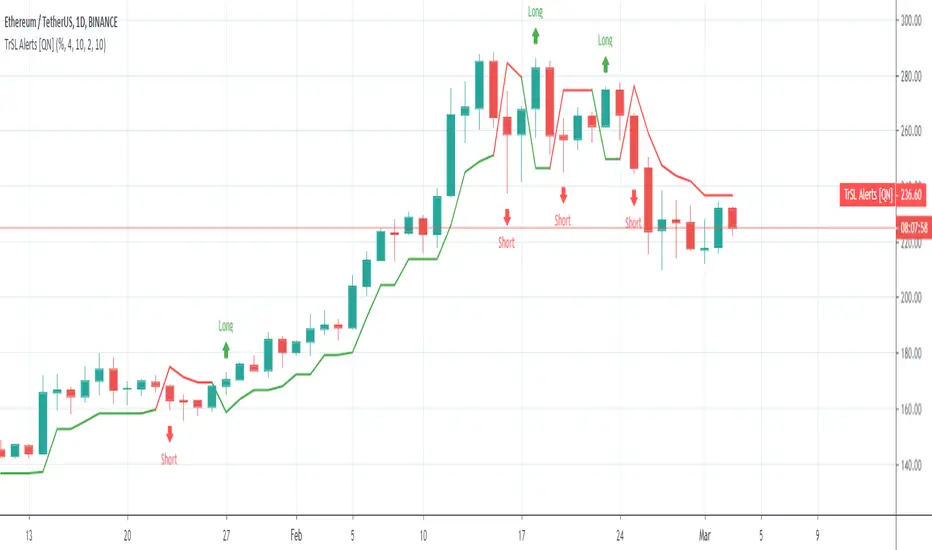
Trailing SL Alerts [QuantNomad]It's alerts version of my Trailing SL strategy:
Use "Once Per Bar" param when creating alerts.
Profit and Stoploss CalculatorThis script is designed to display three stop loss areas to assist either with automation of risk management or identify and alert when price is in a range of a trade for risk to reward ratio.
In this version there are three stop losses and 1 PT. Mainly because i will most likely only be using 1 of the SL to pair with the PT.
Stoploss areas are displayed on both sides of the price for long and short calculations along with the two profit factors but the settings in the indicator it self apply to both sides in terms of percentage.
