AWSA "Level Indicator with ATR" isn't a single, defined indicator but typically refers to a trading strategy or indicator that uses the Average True Range (ATR) to create dynamic levels on a price chart, such as support, resistance, or stop-loss levels. The ATR is a volatility indicator that measures market volatility; when high, it suggests the market has large price swings, and when low, small price swings. By using the ATR value with a multiplier, traders can set price levels that adapt to changing market volatility, providing more objective and dynamic trading signals than fixed-price levels.
Statistics

Aggregated OI (Binance + Bybit + OKX)RU
Агрегатор Open Interest для крипты по трём биржам: Binance, Bybit, OKX/OKEX.
Показывает OI-свечи или дельту OI, есть мини-легенда (Open Interest, Rekt Longs/Shorts, Aggressive Longs/Shorts). Можно переключать биржи и единицы отображения (USD / COIN).
Данные зависят от доступности OI-тикеров в TradingView (…USDT.P_OI). Если по паре нет фида на бирже — она игнорируется. Основано на скрипте LeviathanCapital (MPL-2.0), модификация — SaneQ. Не является финсоветом.
EN
Aggregated Open Interest for crypto across Binance, Bybit, OKX/OKEX.
Plots OI candles or OI delta, plus a compact legend (Open Interest, Rekt Longs/Shorts, Aggressive Longs/Shorts). You can toggle exchanges and display units (USD / COIN).
Data depends on TV OI feeds (…USDT.P_OI). If a pair lacks a feed on an exchange, that source is skipped. Based on LeviathanCapital’s script (MPL-2.0), modified by SaneQ. Not financial advice.

OG OHLC MarkerDraws, OHLC for Previous day and Today with options to add alerts when any PD Array is swept
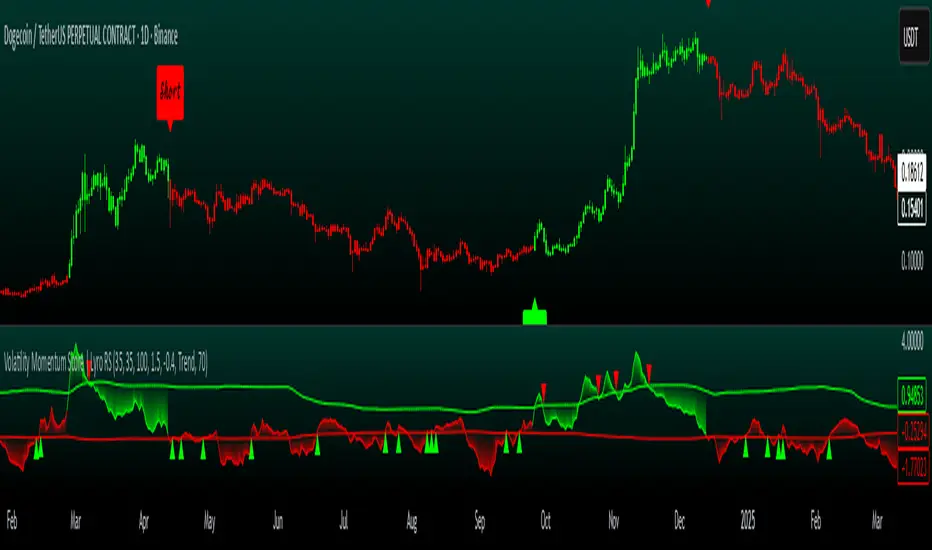
Volatility Momentum Score | Lyro RSVolatility Momentum Score | Lyro RS
Overview
The Volatility Momentum Score (VMS) combines price movement and volatility into a single, easy-to-read signal. Using z-scores, standard deviation bands, and flexible display modes, it helps traders identify trends, overbought/oversold conditions, and potential reversals quickly and effectively.
Key Features
Price + Volatility Blend
Tracks price action and volatility with separate z-scores and merges them into a unified momentum score.
Standard Deviation Bands
Upper and lower bands highlight extreme readings.
Adjustable multipliers allow for fine-tuning sensitivity.
Two Signal Modes
Trend Mode: Plots “Long” and “Short” signals when momentum crosses bands.
Reversion Mode: Colors the chart background when the score indicates stretched conditions.
Overbought & Oversold Alerts
▲ markers indicate oversold conditions.
▼ markers indicate overbought conditions.
Custom Colors
Four preset color themes or fully customizable bullish/bearish colors.
Clear Visuals
Dynamic line coloring based on momentum.
Candles recolored at signal points.
Background shading for quick visual assessment.
How It Works
Calculates z-scores for both price and volatility.
Blends the z-scores into a single average score.
Compares the score against dynamic upper and lower bands.
Triggers signals, markers, or background shading depending on the chosen display mode.
Practical Use
Ride trends: Follow Trend Mode signals to align with momentum.
Spot reversals: Watch ▲ and ▼ markers when markets are overextended.
Stay aware: Background shading highlights potentially overheated conditions.
Customization
Set lookback lengths for price, volatility, and bands.
Adjust band multipliers for more or less sensitive signals.
Choose between Trend or Reversion mode based on trading style.
Select color themes or create custom palettes.
⚠️ Disclaimer
This indicator is a technical analysis tool and does not guarantee results. It should be used alongside other methods and proper risk management. The creators are not responsible for any financial decisions based on its signals.
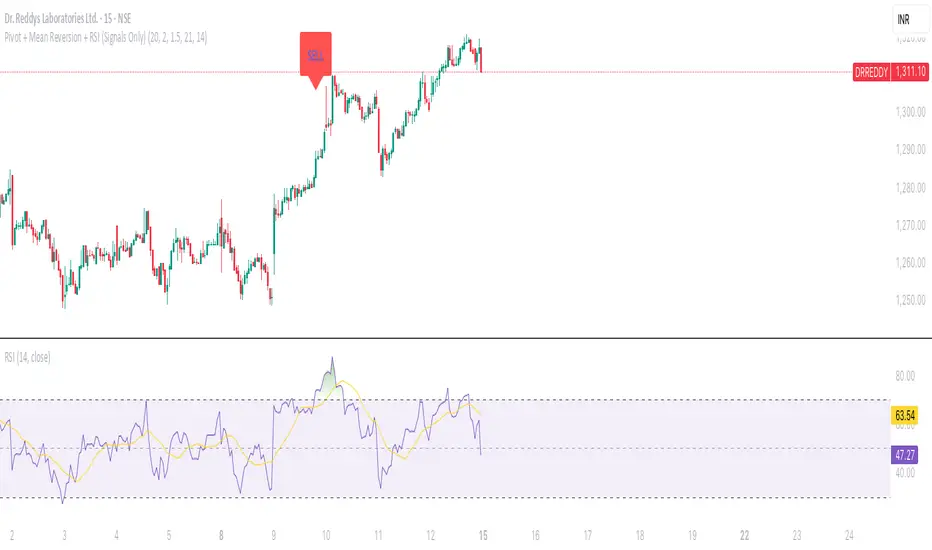
Pivot + Mean Reversion + RSI (Signals Only) by Shashwat KhuranaShow BUY labels below bars when a bullish reversal is detected.
Show SELL labels above bars when a bearish reversal is detected.
Uses pivot levels, mean reversion, big candle, RSI, and volume filters.
Moon Phase & Celestial Events TrackerMoon Phase & Celestial Events Tracker
Overview
A comprehensive astronomical and celestial event indicator that tracks and projects major cosmic events from 2011 to 2040. This indicator overlays important astronomical phenomena directly on your charts, allowing traders and researchers to analyze potential correlations between celestial events and market movements.
Key Features
Eclipse Tracking 🌑
Blood Moons (Total Lunar Eclipses) including 2014-2015 tetrad
Partial Lunar Eclipses with distinctive yellow markers
Solar Eclipses: Total, Annular, Partial, and Hybrid types with unique symbols
Optional eclipse season background highlighting
Moon Cycles 🌕
Supermoons at perigee (closest Earth approach)
Regular moon phases: New, First Quarter, Full, Last Quarter
Adjustable phase marking with day-offset capability
Mercury Retrograde ☿
Start and end dates clearly marked
Optional period highlighting for entire retrograde duration
Complete cycle tracking through 2040
Seasonal Transitions ✨
Spring Equinox, Summer Solstice, Autumn Equinox, Winter Solstice
Precise astronomical season changes
Future Projections 📊
Event forecasting up to 5 years ahead
Customizable projection range (30-1825 days)
Selective projection by event type
Adjustable visual styles and transparency
Interpretation Guide
Blood Moons
Total lunar eclipses where Earth's atmosphere creates the red appearance. In financial astrology, these are often watched as potential reversal or volatility periods, though correlations vary significantly.
Eclipse Seasons
Twice-yearly windows when Sun-Earth-Moon alignment allows eclipses. Some market practitioners note increased volatility during these periods, though empirical evidence remains debated.
Mercury Retrograde
The apparent backward motion of Mercury occurs 3-4 times yearly. In trading folklore, it's associated with communication issues, technical problems, and false signals. Many practitioners suggest extra caution with new positions during these periods.
Supermoons
Full or new moons at closest Earth approach. Some traders track these for potential short-term highs/lows, particularly in commodities and currencies, though effects are subtle if present.
Seasonal Markers
Astronomical season changes have been incorporated into various market timing systems, with some analysts noting clustering of trend changes around these dates.
Use Cases
Historical pattern analysis
Event-based research
Educational astronomy tracking
Market cycle studies
Long-term planning and observation
Technical Details ⚙️
Data Coverage: 2011-2040 (30 years of precise astronomical events)
Compatibility: All timeframes with smart filtering (Weekly/Monthly show only major events)
Performance: Lightweight with efficient calculations and minimal chart impact
Data Source: Based on NASA ephemeris data for precise event timing
Customization Options 🎨
Individual colors for each event type
Transparency controls for projections
Event visibility toggles
Optional date labels on events
Alert Options 🔔
Set custom alerts for any tracked event including all eclipse types, moon phases, Mercury retrograde start/end, and seasonal transitions.
⚠️ Important Note
This indicator displays astronomical events for research and educational purposes. Any perceived correlations with market movements should be thoroughly backtested. Financial astrology interpretations are included for historical context only and should not be considered trading advice. Always use proper risk management and multiple forms of analysis in trading decisions.
Best Suited For
Market researchers and analysts
Students of market cycles
Those interested in astronomical timing
Educational and observational purposes
Long-term pattern analysis

Position Sizing Calculator with ADR%, Account %, and RSILET ME KNOW IN COMMENTS IF YOU HAVE ANY ISSUES!
Overview
The Position Sizing Calculator with ADR% + RSI is a indicator that helps traders calculate position sizes based on risk management parameters (stop loss at low of day). It uses a fixed percentage of the account size, risk per trade, and stop loss distance (current price minus daily low) to determine the number of shares or contracts to trade. Additionally, it displays the Average Daily Range (ADR) as a percentage, the Relative Strength Index (RSI), and the price’s percentage distance from the daily low in a real-time table.
Features
Position Sizing: Calculates position size based on a fixed account percentage, risk per trade, and stop loss distance, ensuring the position value stays within the allocated capital.
ADR% Display: Shows the ADR as a percentage of the daily low, colored green if >5% or red if ≤5%.
RSI Display: Shows the RSI, colored green if oversold (<30), red if overbought (>70), or gray otherwise.
Distance from Low: Displays the current price’s percentage distance from the daily low for context.
Real-Time Table: Presents all metrics in a top-right table, updating in real-time.
Position Value Cap: Ensures the position value doesn’t exceed the allocated capital.
Minimum Stop Loss: Prevents oversized positions due to very small stop loss distances.
Customizable Parameters
Account Size ($): Set the total account balance (default: $1,000, min: $100, step: $100).
Risk Per Trade (%): The percentage of allocated capital to risk per trade (default: 1%, range: 0.1% to 10%, step: 0.1%).
Max % of Account: The fixed percentage of the account to allocate for the trade (default: 50%, range: 10% to 100%, step: 1%).
ADR Period: The number of days to calculate the ADR (default: 14, min: 1, step: 1).
RSI Length: The period for RSI calculation (default: 14, min: 1, step: 1).
Min Stop Loss Distance ($): The minimum stop loss distance to prevent oversized positions (default: $0.01, min: $0.001, step: $0.001).
Calculations
Stop Loss Distance: Current price minus daily low, with a minimum value set by the user.
Position Size: (Account Size * Max % of Account * Risk Per Trade %) / Stop Loss Distance, capped so the position value doesn’t exceed the allocated capital.
ADR%: 100 * (SMA(daily high / daily low, ADR Period) - 1), reflecting the average daily range relative to the low.
RSI: Calculated using the smoothed average of gains and losses over the RSI period, with special handling for zero gains or losses.
Distance from Low: (Current Price - Daily Low) / Daily Low * 100.
Table Display
Account Size: The input account balance.
Risk Per Trade: The risk percentage.
Stop Loss Distance: The price difference between the current price and daily low.
Distance from Low: The percentage distance from the daily low.
Account % Used: The fixed percentage of the account allocated.
Position Size: The calculated number of shares or contracts.
Position Value: The position size multiplied by the current price.
ADR %: The ADR percentage, colored green (>5%) or red (≤5%).
RSI: The RSI value, colored green (<30), red (>70), or gray (30–70).
Usage
Ideal for traders managing risk by allocating a fixed portion of their account and sizing positions based on stop loss distance.
The ADR% and RSI provide market context, with color coding to highlight high volatility or overbought/oversold conditions.
Adjust the customizable parameters to fit your trading style, such as increasing the risk percentage for aggressive trades or adjusting the ADR/RSI periods for different time horizons.

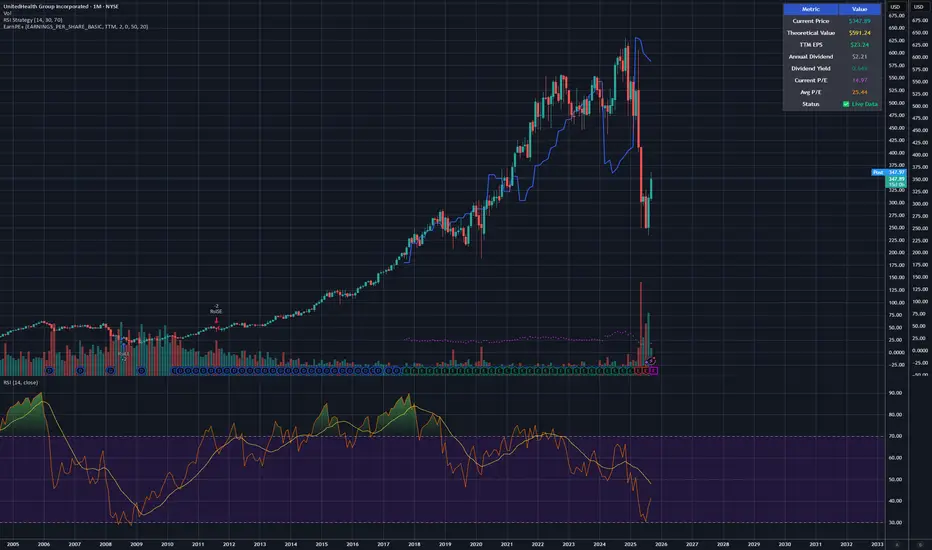
Earnings line & P/E Tracker# Earnings line & P/E Tracker
**A comprehensive fundamental analysis indicator that overlays earnings data and P/E ratios directly on your price charts.**
## 📊 Key Features
### Automatic Data Retrieval
- **Real-time financial data** pulled directly from TradingView's financial database
- **Multiple data sources**: Earnings Per Share (Basic/Diluted), Total Revenue, Net Income
- **Flexible periods**: TTM (Trailing Twelve Months), FQ (Quarterly), FY (Annual)
- **Live P/E ratio calculation** based on current price and TTM earnings
### Visual Display Options
- **Earnings progression line** overlaid on price chart for easy comparison
- **P/E ratio plot** with distinctive circle markers
- **Comprehensive data table** showing all key metrics in real-time
- **Dark mode optimized** with high-contrast colors for excellent readability
### Optional Event Tracking
- **Custom earnings dates** input for upcoming releases
- **Visual markers** on earnings announcement dates
- **Background highlighting** during earnings weeks
- **Smart alerts** for significant P/E changes and data updates
## 🎯 Perfect For
- **Fundamental analysts** comparing earnings growth vs stock price movement
- **Value investors** tracking P/E ratios and earnings trends
- **Earnings season trading** with visual release date markers
- **Long-term investors** monitoring fundamental health alongside technical analysis
## ⚙️ Customization Options
### Data Selection
- Choose between EPS Basic, EPS Diluted, Total Revenue, or Net Income
- Select TTM, quarterly, or annual reporting periods
- Toggle individual display elements on/off
### Visual Styling
- Customizable colors for earnings line, P/E ratio, and event markers
- Adjustable line width and styling options
- Moveable data table with size and position controls
### Event Management
- Input custom earnings release dates
- Enable/disable earnings event markers
- Background highlighting for earnings periods
- Configurable alert thresholds
## 📈 How It Works
1. **Automatic Detection**: The indicator automatically detects available fundamental data for your selected symbol
2. **Real-time Updates**: Financial metrics update as new data becomes available
3. **Visual Integration**: Earnings data is scaled and overlaid directly on your price chart
4. **Status Monitoring**: Clear indicators show data availability and freshness
## 🔧 Setup Instructions
1. Add the indicator to your chart
2. Select your preferred data source (EPS recommended for P/E tracking)
3. Choose time period (TTM recommended for most analyses)
4. Customize colors and display options to your preference
5. Optionally add upcoming earnings dates for event tracking
## 💡 Pro Tips
- **Use TTM EPS** for the most accurate P/E ratio calculations
- **Compare earnings line slope** with price movement to spot divergences
- **Enable earnings events** to prepare for volatility around announcements
- **Works best on daily/weekly timeframes** for fundamental analysis
## ⚠️ Data Availability
- Requires stocks with available fundamental data in TradingView's database
- Most major US stocks, ETFs, and international equities supported
- Limited data may be available for small-cap or recently listed companies
- Clear "No Data" indicator when fundamental data is unavailable
## 🎨 Display Features
- **High contrast colors** optimized for both light and dark chart themes
- **Clean, professional table** displaying all key metrics
- **Intuitive visual markers** for earnings events and data points
- **Responsive design** that adapts to different chart sizes
---
**Perfect for traders and investors who want to combine fundamental analysis with technical charting in a single, comprehensive view.**
## ⚠️ Important Disclaimer
**This indicator is provided for educational and informational purposes only. The author (raptor2030) is not responsible for:**
- **Data accuracy or completeness** - Financial data is sourced from TradingView's database and may contain errors, delays, or omissions
- **Trading decisions** - This tool should not be used as the sole basis for investment decisions
- **Financial losses** - Past performance does not guarantee future results
- **Data reliability** - Third-party data sources may experience outages or provide incorrect information
- **Market timing** - Earnings dates and projections may be inaccurate or outdated
**Always verify critical information from official company sources and consult with qualified financial professionals before making investment decisions.**
**Use this indicator at your own risk. The author disclaims all liability for any direct, indirect, or consequential damages arising from the use of this script.**
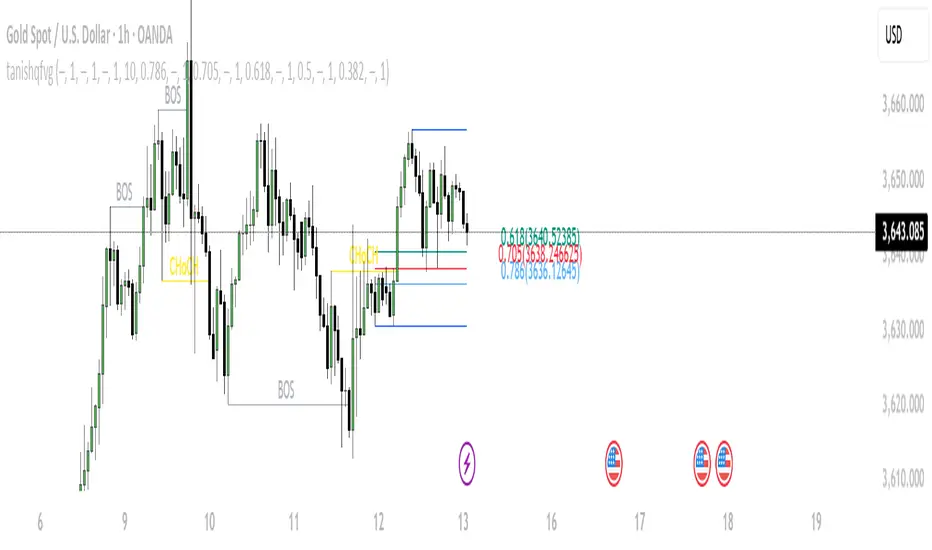
tanishqfvgThis indicator is designed for swing traders who want to combine market structure, Optimal Trade Entry (OTE), and Fibonacci levels into one simple tool.
🔹 Swing Detection – Automatically identifies swing highs and lows to highlight key turning points.
🔹 OTE Zone – Marks the optimal trade entry zone between 62%–79% retracement for high-probability setups.
🔹 Fibonacci Levels – Dynamic Fibonacci retracements are plotted to show confluence with swing structure.
🔹 Smart Visualization – Clear zones and levels that help traders quickly spot potential entries and targets.
✅ Works on any timeframe and market (forex, indices, crypto, stocks).
✅ Ideal for structure-based traders who rely on precision entries and confluence setups.
Extended Majors Rotation System | AlphaNattExtended Majors Rotation System | AlphaNatt
A sophisticated cryptocurrency rotation system that dynamically allocates capital to the strongest trending major cryptocurrencies using multi-layered relative strength analysis and adaptive filtering techniques.
"In crypto markets, the strongest get stronger. This system identifies and rides the leaders while avoiding the laggards through mathematical precision."
━━━━━━━━━━━━━━━━━━━━━━━━━━━━━━━━━━━━━━━━
📊 SYSTEM OVERVIEW
The Extended Majors Rotation System (EMRS) is a quantitative momentum rotation strategy that:
Analyzes 10 major cryptocurrencies simultaneously
Calculates relative strength between all possible pairs (45 comparisons)
Applies fractal dimension analysis to identify trending behavior
Uses adaptive filtering to reduce noise while preserving signals
Dynamically allocates to the mathematically strongest asset
Implements multi-layer risk management through market regime filters
Core Philosophy:
Rather than trying to predict which cryptocurrency will perform best, the system identifies which one is already performing best relative to all others and maintains exposure until leadership changes.
━━━━━━━━━━━━━━━━━━━━━━━━━━━━━━━━━━━━━━━━
🎯 WHAT MAKES THIS SYSTEM UNEQUIVOCALLY UNIQUE
1. True Relative Strength Matrix
Unlike simple momentum strategies that look at individual asset performance, EMRS calculates the complete relative strength matrix between all assets. Each asset is compared against every other asset using fractal analysis, creating a comprehensive strength map of the entire crypto market.
2. Hurst Exponent Integration
The system employs the Hurst Exponent to distinguish between:
Trending behavior (H > 0.5) - where momentum is likely to persist
Mean-reverting behavior (H < 0.5) - where reversals are likely
Random walk (H ≈ 0.5) - where no edge exists
This ensures the system only takes positions when mathematical evidence of persistence exists.
3. Dual-Layer Filtering Architecture
Combines two advanced filtering techniques:
Laguerre Polynomial Filters: Provides low-lag smoothing with minimal distortion
Kalman-like Adaptive Smoothing: Adjusts filter parameters based on market volatility
This dual approach preserves important price features while eliminating noise.
4. Market Regime Awareness
The system monitors overall crypto market conditions through multiple lenses and only operates when:
The broad crypto market shows positive technical structure
Sufficient trending behavior exists across major assets
Risk conditions are favorable
5. Rank-Based Selection with Trend Confirmation
Rather than simply choosing the top-ranked asset, the system requires:
High relative strength ranking
Positive individual trend confirmation
Alignment with market regime
This multi-factor approach reduces false signals and whipsaws.
━━━━━━━━━━━━━━━━━━━━━━━━━━━━━━━━━━━━━━━━
🛡️ SYSTEM ROBUSTNESS & DEVELOPMENT METHODOLOGY
Pre-Coding Design Philosophy
This system was completely designed before any code was written . The mathematical framework, indicator selection, and parameter ranges were determined through:
Theoretical analysis of market microstructure
Study of persistence and mean reversion in crypto markets
Mathematical modeling of relative strength dynamics
Risk framework development based on regime theory
No Post-Optimization
Zero parameter fitting: All parameters remain at their originally designed values
No curve fitting: The system uses the same settings across all market conditions
No cherry-picking: Parameters were not adjusted after seeing results
This approach ensures the system captures genuine market dynamics rather than historical noise
Parameter Robustness Testing
Extensive testing was conducted to ensure stability:
Sensitivity Analysis: System maintains positive expectancy across wide parameter ranges
Walk-Forward Analysis: Consistent performance across different time periods
Regime Testing: Performs in both trending and choppy conditions
Out-of-Sample Validation
System was designed on a selection of 10 assets
System was tested on multiple baskets of 10 other random tokens, to simualte forwards testing
Performance remains consistent across baskets
No adjustments made based on out-of-sample results
━━━━━━━━━━━━━━━━━━━━━━━━━━━━━━━━━━━━━━━━
📈 PERFORMANCE METRICS DISPLAYED
The system provides real-time performance analytics:
Risk-Adjusted Returns:
Sharpe Ratio: Measures return per unit of total risk
Sortino Ratio: Measures return per unit of downside risk
Omega Ratio: Probability-weighted ratio of gains vs losses
Maximum Drawdown: Largest peak-to-trough decline
Benchmark Comparison:
Live comparison against Bitcoin buy-and-hold strategy
Both equity curves displayed with gradient effects
Performance metrics shown for both strategies
Visual representation of outperformance/underperformance
━━━━━━━━━━━━━━━━━━━━━━━━━━━━━━━━━━━━━━━━
🔧 OPERATIONAL MECHANICS
Asset Universe:
The system analyzes 10 major cryptocurrencies, customizable through inputs:
Bitcoin (BTC)
Ethereum (ETH)
Solana (SOL)
XRP
BNB
Dogecoin (DOGE)
Cardano (ADA)
Chainlink (LINK)
Additional majors
Signal Generation Process:
Calculate relative strength matrix
Apply Hurst Exponent analysis to each ratio
Rank assets by aggregate relative strength
Confirm individual asset trend
Verify market regime conditions
Allocate to highest-ranking qualified asset
Position Management:
Single asset allocation (no diversification)
100% in strongest trending asset or 100% cash
Daily rebalancing at close
No leverage employed in base system
━━━━━━━━━━━━━━━━━━━━━━━━━━━━━━━━━━━━━━━━
📊 VISUAL INTERFACE
Information Dashboard:
System state indicator (ON/OFF)
Current allocation display
Real-time performance metrics
Sharpe, Sortino, Omega ratios
Maximum drawdown tracking
Net profit multiplier
Equity Curves:
Cyan curve: System performance with gradient glow effect
Magenta curve: Bitcoin HODL benchmark with gradient
Visual comparison of both strategies
Labels indicating current values
Alert System:
Alerts fire when allocation changes
Displays selected asset symbol
"CASH" alert when system goes defensive
━━━━━━━━━━━━━━━━━━━━━━━━━━━━━━━━━━━━━━━━
⚠️ IMPORTANT CONSIDERATIONS
Appropriate Use Cases:
Medium to long-term crypto allocation
Systematic approach to crypto investing
Risk-managed exposure to cryptocurrency markets
Alternative to buy-and-hold strategies
Limitations:
Daily rebalancing required
Not suitable for high-frequency trading
Requires liquid markets for all assets
Best suited for spot trading (no derivatives)
Risk Factors:
Cryptocurrency markets are highly volatile
Past performance does not guarantee future results
System can underperform in certain market conditions
Not financial advice - for educational purposes only
━━━━━━━━━━━━━━━━━━━━━━━━━━━━━━━━━━━━━━━━
🎓 THEORETICAL FOUNDATION
The system is built on several academic principles:
1. Momentum Anomaly
Extensive research shows that assets exhibiting strong relative momentum tend to continue outperforming in the medium term (Jegadeesh & Titman, 1993).
2. Fractal Market Hypothesis
Markets exhibit fractal properties with periods of persistence and mean reversion (Peters, 1994). The Hurst Exponent quantifies these regimes.
3. Adaptive Market Hypothesis
Market efficiency varies over time, creating periods where momentum strategies excel (Lo, 2004).
4. Cross-Sectional Momentum
Relative strength strategies outperform time-series momentum in cryptocurrency markets due to the high correlation structure.
━━━━━━━━━━━━━━━━━━━━━━━━━━━━━━━━━━━━━━━━
💡 USAGE GUIDELINES
Capital Requirements:
Suitable for any account size
No minimum capital requirement
Scales linearly with account size
Implementation:
Can be traded manually with daily signals
Suitable for automation via alerts
Works with any broker supporting crypto
━━━━━━━━━━━━━━━━━━━━━━━━━━━━━━━━━━━━━━━━
📝 FINAL NOTES
The Extended Majors Rotation System represents a systematic, mathematically-driven approach to cryptocurrency allocation. By combining relative strength analysis with fractal market theory and adaptive filtering, it aims to capture the persistent trends that characterize crypto bull markets while avoiding the drawdowns of buy-and-hold strategies.
The system's robustness comes not from optimization, but from sound mathematical principles applied consistently. Every component was chosen for its theoretical merit before any backtesting occurred, ensuring the system captures genuine market dynamics rather than historical artifacts.
"In the race between cryptocurrencies, bet on the horse that's already winning - but only while the track conditions favour racing."
━━━━━━━━━━━━━━━━━━━━━━━━━━━━━━━━━━━━━━━━
Developed by AlphaNatt | Quantitative Rotation Systems
Version: 1.0
Strategy Type: Momentum Rotation
Classification: Systematic Trend Following
Not financial advice. Always DYOR.

Pivot + OHLC【Pivot + OHLC|使い方(日本語)】
■ 概要
前日のOHLCラインと、当日の高値/安値(点線)を表示しつつ、標準ピボット(複数方式)を同一チャートに描画するインジケーターです。デイトレ~スイングでの当日レンジ把握、前日基準の反発/ブレイク確認、ピボット到達の可視化に向きます。
■ 主な機能
- 前日OHLC:前日の「Open/High/Low/Close」を水平ステップラインで描画(色変更可)
- 当日H/L:当日の「高値/安値」を点線のライン&ラベルで表示(最終バーのみ)
- ピボット:Traditional / Fibonacci / Woodie / Classic / DM / Camarilla に対応
- 表示制御:ピボット各レベル(P, R1~R5, S1~S5)の個別ON/OFF、色、ラベル位置を設定可
- パフォーマンス:古いピボットは自動削除(件数を設定可能)
■ 基本の使い方
1) チャートに追加したら、時間軸を普段の取引足に設定します。
2) 「OHLC Resolution」で前日の参照解像度(通常は1D)を選択。
3) 「Hide past OHLC」をONにすると、前日のOHLCは“表示用解像度の最終バー”付近のみ表示され、過去の混雑を抑えます。
4) 「Display resolution (for OHLC)」はOHLCラベルの表示基準となる時間足(通常は1D)です。
5) 「Line Width」で前日OHLC&当日H/L&ピボットの線幅を共通で調整します。
6) ピボットは「Pivot Type」「Pivots Timeframe」「Use Daily-based Values」等で調整します。
- デイトレ用途:Pivot Timeframe=“Auto or Daily”、Use Daily-based Values=ON が手堅い構成です。
7) 「labels」グループで「Show Labels」「Show Prices」「Labels Position(Left/Right)」を調整します。
■ パラメータ早見表
- OHLC Resolution:前日データの参照足(既定:1D)
- Hide past OHLC:過去の前日OHLCを非表示(既定:ON)
- Display resolution (for OHLC):OHLCラベルの表示基準足(既定:1D)
- Open/High/Low/Close:前日ライン色
- Line Width:全ライン共通の太さ
- Show Labels / Show Prices:ラベルの名称/価格の表示切替
- Pivot Type:ピボット方式(Traditional / Fibonacci / Woodie / Classic / DM / Camarilla)
- Pivots Timeframe:ピボット計算のアンカー(Auto / Daily / Weekly / … / Yearly派生)
- Number of Pivots Back:履歴ピボット保持数(古いものは自動削除)
- Use Daily-based Values:日足ベースで安定描画(短期足での未確定ずれを抑制)
- Labels Position:ピボットラベルの左右
■ 表示仕様のポイント
- 当日H/Lは点線ライン+ラベル(日本語表記:当日高値/当日安値)。最新バー時のみ表示・更新。
- 前日OHLCはステップライン。色を変更すると対応するラベル色も自動で連動。
- ピボットは方式により有効なレベル数が異なります(例:DMは少なめ、Traditional/CamarillaはR5/S5まで可)。
- レベルの個別トグル(Show P, Show R1 …)で混雑を抑えられます。
■ 注意事項 / ヒント
- 低スペック環境や極端に長い履歴では「Number of Pivots Back」を下げると安定します。
- 取引所/銘柄のセッションや休日によっては、1日の切替タイミングと当日H/Lの更新に差異が出る場合があります。
- Intradayでの“開場直後~日足切替前後”はリフレッシュによりH/Lやラベル位置が追随します。
- 「Use Daily-based Values」をONにすると、短期足でのピボット再計算による細かなズレを抑制できます。
■ 使いどころ
- 前日安値→当日戻り高値→ピボットR1の順に到達など、日内の“基準面”を連結して相場の節目を確認。
- ブレイク判定時に当日H/Lとピボット到達を併読して、利確/押し目候補を素早く評価。
- 指値戦略では、前日値幅(H-L)とピボット帯の重なりで「厚い」価格帯を抽出。
■ Overview
This indicator overlays prior-day OHLC lines, today’s high/low (dotted), and standard Pivot Points on the same chart. It’s built for quick intraday context: prior-day anchors, current-day range, and pivot confluence.
■ Key Features
- Yesterday’s OHLC: horizontal step-lines with customizable colors
- Today’s High/Low: dynamic dotted lines + labels (shown/updated on the latest bar)
- Pivot Points: Traditional / Fibonacci / Woodie / Classic / DM / Camarilla
- Fine control: per-level toggles (P, R1–R5, S1–S5), colors, label side
- Performance-aware: old pivots are auto-pruned by “Number of Pivots Back”
■ Quick Start
1) Add to your chart and choose your working timeframe.
2) Set “OHLC Resolution” (usually 1D).
3) Turn ON “Hide past OHLC” to keep charts clean by only showing recent prior-day OHLC.
4) “Display resolution (for OHLC)” defines the baseline timeframe for OHLC label placement (usually 1D).
5) Adjust “Line Width” to control all line thicknesses at once.
6) Configure pivots via “Pivot Type”, “Pivots Timeframe”, and “Use Daily-based Values”.
- For day trading, “Auto or Daily” + “Use Daily-based Values = ON” is a robust setup.
7) In “labels”, toggle “Show Labels”, “Show Prices”, and choose “Labels Position (Left/Right)”.
■ Parameter Cheatsheet
- OHLC Resolution: timeframe used for prior-day data (default 1D)
- Hide past OHLC: hide historical prior-day OHLC (default ON)
- Display resolution (for OHLC): baseline for OHLC label placement (default 1D)
- Open/High/Low/Close: colors for the four prior-day lines
- Line Width: global thickness for OHLC / Today H/L / Pivots
- Show Labels / Show Prices: text/price display for labels
- Pivot Type: Traditional / Fibonacci / Woodie / Classic / DM / Camarilla
- Pivots Timeframe: anchor timeframe (Auto / Daily / Weekly / … / Yearly variants)
- Number of Pivots Back: how many historical pivot sets to keep (older ones are deleted)
- Use Daily-based Values: stabilize pivot drawing on intraday charts
- Labels Position: left or right for pivot labels
■ Display Notes
- Today’s H/L are dotted lines with labels (“Today’s High” / “Today’s Low”); they update only on the latest bar.
- Prior-day OHLC uses step-lines; label color automatically follows line color.
- Available pivot levels depend on the chosen type (e.g., DM has fewer, Traditional/Camarilla support up to R5/S5).
- Use per-level toggles (Show P, Show R1, …) to reduce clutter.
■ Tips / Caveats
- On modest hardware or very long histories, reduce “Number of Pivots Back” for stability.
- Exchange sessions/holidays can slightly shift the daily roll and when Today’s H/L updates.
- Around the daily roll, intraday charts may refresh H/L/labels as new data confirms.
- “Use Daily-based Values = ON” helps avoid micro-shifts from frequent intraday recalculations.
■ Practical Use
- Chain prior-day low → intraday pullback high → pivot R1 to frame day structure.
- On breakouts, read Today’s H/L with pivot reaches to judge take-profit / pullback zones.
- For limit orders, intersect prior-day range (H–L) with pivot bands to find “thick” price zones.

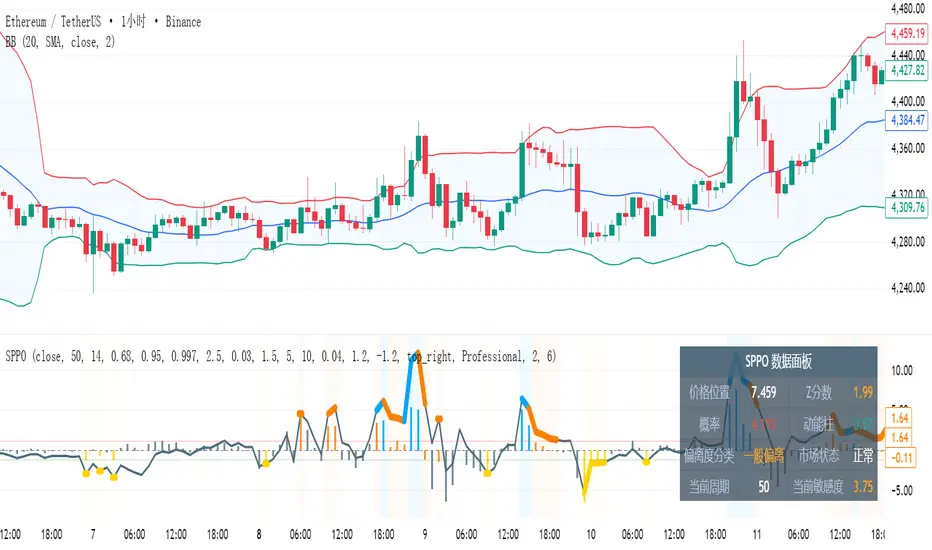
SPPO - Statistical Price Position OscillatorSPPO - Statistical Price Position Oscillator - Time-Weighted
Based on a time-weighted statistical model, this indicator quantifies price deviation from its recent mean. It uses a Z-Score to normalize price position and calculates the statistical probability of its occurrence, helping traders identify over-extended market conditions and mean-reversion opportunities with greater sensitivity.
- Time-Weighted Model: Reacts more quickly to recent price changes by using a Weighted Moving Average (WMA) and a weighted standard deviation.
- Statistical Foundation: Utilizes Z-Score standardization and a probability calculation to provide an objective measure of risk and price extremity.
- Dynamic Adaptation: Automatically adjusts its calculation period and sensitivity based on market volatility, making it versatile across different market conditions.
- Intelligent Visuals: Dynamic line thickness and gradient color-coding intuitively display the intensity of price deviations.
- Multi-Dimensional Analysis: Combines the main line's position (Z-Score), a momentum histogram, and real-time probability for a comprehensive view.
1. Time-Weighted Statistical Model (Z-Score Calculation)
- Weighted Mean (μ_w): Instead of a simple average, the indicator uses a Weighted Moving Average (ta.wma) to calculate the price mean, giving more weight to recent data points.
- Weighted Standard Deviation (σ_w): A custom weighted_std function calculates the standard deviation, also prioritizing recent prices. This ensures that the measure of dispersion is more responsive to the latest market behavior.
- Z-Score: The core of the indicator is the Z-Score, calculated as Z = (Price - μ_w) / σ_w. This value represents how many weighted standard deviations the current price is from its weighted mean. A higher absolute Z-Score indicates a more statistically significant price deviation.
2. Probability Calculation
- The indicator uses an approximation of the Normal Cumulative Distribution Function (normal_cdf_approx) to calculate the probability of a Z-Score occurring.
- The final price_probability is a two-tailed probability, calculated as 2 * (1 - CDF(|Z-Score|)). This value quantifies the statistical rarity of the current price deviation. For example, a probability of 0.05 (or 5%) means that a deviation of this magnitude or greater is expected to occur only 5% of the time, signaling a potential market extreme.
3. Dynamic Parameter Adjustment
- Volatility Measurement: The system measures market volatility using the standard deviation of price changes (ta.stdev(ta.change(src))) over a specific lookback period.
- Volatility Percentile: It then calculates the percentile rank (ta.percentrank) of the current volatility relative to its history. This contextualizes whether the market is in a high-volatility or low-volatility state.
- Adaptive Adjustment:
- If volatility is high (e.g., >75th percentile), the indicator can shorten its distribution_period and increase its position_sensitivity. This makes it more responsive to fast-moving markets.
- If volatility is low (e.g., <25th percentile), it can lengthen the period and decrease sensitivity, making it more stable in calmer markets. This adaptive mechanism helps maintain the indicator's relevance across different market regimes.
4. Momentum and Cycle Analysis (Histogram)
- The indicator does not use a Hilbert Transform. Instead, it analyzes momentum cycles by calculating a histogram: Histogram = (Z-Score - EMA(Z-Score)) * Sensitivity.
- This histogram represents the rate of change of the Z-Score. A positive and rising histogram indicates accelerating upward deviation, while a negative and falling histogram indicates accelerating downward deviation. Divergences between the price and the histogram can signal a potential exhaustion of the current deviation trend, often preceding a reversal.
- Reversal Signals: Look for the main line in extreme zones (e.g., Z-Score > 2 or < -2), probability below a threshold (e.g., 5%), and divergence or contraction in the momentum histogram.
- Trend Filtering: The main line's direction indicates the trend of price deviation, while the histogram confirms its momentum.
- Risk Management: Enter a high-alert state when probability drops below 5%; consider risk control when |Z-Score| > 2.
- Gray, thin line: Price is within a normal statistical range (~1 sigma, ~68% probability).
- Orange/Yellow, thick line: Price is moderately deviated (1 to 2 sigma).
- Cyan/Purple, thick line: Price is extremely deviated (>2 sigma, typically <5% probability).
- Distribution Period: 50 (for weighted calculation)
- Position Sensitivity: 2.5
- Volatility Lookback: 10
- Probability Threshold: 0.03
Suitable for all financial markets and timeframes, especially in markets that exhibit mean-reverting tendencies.
This indicator is a technical analysis tool and does not constitute investment advice. Always use in conjunction with other analysis methods and a strict risk management strategy.
Copyright (c) 2025 | Pine Script v6 Compatible
---
统计价格位置振荡器 (SPPO) - 时间加权版
基于时间加权统计学模型,该指标量化了当前价格与其近期均值的偏离程度。它使用Z分数对价格位置进行标准化,并计算其出现的统计概率,帮助交易者更灵敏地识别市场过度延伸和均值回归的机会。
- 时间加权模型:通过使用加权移动平均(WMA)和加权标准差,对近期价格变化反应更迅速。
- 统计学基础:利用Z分数标准化和概率计算,为风险和价格极端性提供了客观的衡量标准。
- 动态自适应:根据市场波动率自动调整其计算周期和敏感度,使其在不同市场条件下都具有通用性。
- 智能视觉:动态线条粗细和渐变颜色编码,直观地展示价格偏离的强度。
- 多维分析:结合了主线位置(Z分数)、动能柱和实时概率,提供了全面的市场视角。
1. 时间加权统计模型 (Z分数计算)
- 加权均值 (μ_w):指标使用加权移动平均 (ta.wma) 而非简单平均来计算价格均值,赋予近期数据点更高的权重。
- 加权标准差 (σ_w):通过一个自定义的 weighted_std 函数计算标准差,同样优先考虑近期价格。这确保了离散度的衡量对最新的市场行为更敏感。
- Z分数:指标的核心是Z分数,计算公式为 Z = (价格 - μ_w) / σ_w。该值表示当前价格偏离其加权均值的加权标准差倍数。Z分数的绝对值越高,表示价格偏离在统计上越显著。
2. 概率计算
- 指标使用正态累积分布函数 (normal_cdf_approx) 的近似值来计算特定Z分数出现的概率。
- 最终的 price_probability 是一个双尾概率,计算公式为 2 * (1 - CDF(|Z分数|))。该值量化了当前价格偏离的统计稀有性。例如,0.05(或5%)的概率意味着这种幅度或更大的偏离预计只在5%的时间内发生,这预示着一个潜在的市场极端。
3. 动态参数调整
- 波动率测量:系统通过计算特定回溯期内价格变化的标准差 (ta.stdev(ta.change(src))) 来测量市场波动率。
- 波动率百分位:然后,它计算当前波动率相对于其历史的百分位排名 (ta.percentrank)。这将当前市场背景定义为高波动率或低波动率状态。
- 自适应调整:
- 如果波动率高(例如,>75百分位),指标可以缩短其 distribution_period(分布周期)并增加其 position_sensitivity(位置敏感度),使其对快速变化的市场反应更灵敏。
- 如果波动率低(例如,<25百分位),它可以延长周期并降低敏感度,使其在较平静的市场中更稳定。这种自适应机制有助于保持指标在不同市场制度下的有效性。
4. 动能与周期分析 (动能柱)
- 该指标不使用希尔伯特变换。相反,它通过计算一个动能柱来分析动量周期:动能柱 = (Z分数 - Z分数的EMA) * 敏感度。
- 该动能柱代表Z分数的变化率。一个正向且不断增长的动能柱表示向上的偏离正在加速,而一个负向且不断下降的动能柱表示向下的偏离正在加速。价格与动能柱之间的背离可以预示当前偏离趋势的衰竭,通常发生在反转之前。
- 反转信号:寻找主线进入极端区域(如Z分数 > 2 或 < -2)、概率低于阈值(如5%)以及动能柱出现背离或收缩。
- 趋势过滤:主线的方向指示价格偏离的趋势,而动能柱确认其动量。
- 风险管理:当概率降至5%以下时进入高度警惕状态;当|Z分数| > 2时考虑风险控制。
- 灰色细线:价格处于正常统计范围内(约1个标准差,约68%概率)。
- 橙色/黄色粗线:价格中度偏离(1到2个标准差)。
- 青色/紫色粗线:价格极端偏离(>2个标准差,通常概率<5%)。
- 分布周期:50(用于加权计算)
- 位置敏感度:2.5
- 波动率回溯期:10
- 概率阈值:0.03
适用于所有金融市场和时间框架,尤其是在表现出均值回归特性的市场中。
本指标为技术分析辅助工具,不构成任何投资建议。请务必结合其他分析方法和严格的风险管理策略使用。
版权所有 (c) 2025 | Pine Script v6 兼容
SPPO - Statistical Price Position OscillatorSPPO - Statistical Price Position Oscillator
=== INDICATOR OVERVIEW ===
The Statistical Price Position Oscillator (SPPO) is an innovative technical analysis tool built on rigorous statistical principles. Unlike traditional oscillators that rely on fixed periods or subjective thresholds, SPPO uses dynamic statistical modeling to assess where current prices stand within their historical distribution.
=== KEY FEATURES ===
• Statistical Foundation: Based on normal distribution theory and Z-Score standardization
• Dynamic Parameter Adjustment: Automatically adapts to market volatility conditions
• Probability Quantification: Provides objective probability assessments for price levels
• Multi-Layer Visual System: Six layers of information encoding (line position, color intensity, line width, background, histogram, data panel)
• Professional Color Schemes: Multiple themes optimized for different trading environments
• Real-time Risk Assessment: Quantifies the statistical significance of current price positions
=== CORE COMPONENTS ===
1. SPPO Main Line
- Represents the standardized price position (Z-Score × Sensitivity)
- Dynamic line width: Normal (2px) for |Z| ≤ 1.0, Bold (6px) for extreme deviations
- Color coding: Neutral (gray) for normal range, Orange/Yellow for moderate deviation, Blue/Purple for extreme deviation
2. SPPO Histogram (Momentum Bars)
- Measures the momentum of statistical deviation, not price momentum
- Calculated as: (Current Z-Score - EMA of Z-Score) × Sensitivity
- Helps identify momentum divergences and trend continuation/reversal signals
3. Intelligent Data Panel
- Real-time display of key statistical metrics
- Shows: Price Position, Z-Score, Probability, Momentum, Deviation Classification, Market Regime
- Dynamic parameter display for transparency
4. Adaptive Background System
- Visual representation of market regimes
- Color intensity based on statistical significance
- Helps quickly identify extreme market conditions
=== PARAMETER SETTINGS ===
Core Parameters:
• Distribution Period (30-120, default 50): Statistical calculation window based on Central Limit Theorem
• Range Evaluation Period (10-100, default 14): Price range assessment window
• Position Sensitivity (0.5-4.0, default 2.5): Indicator responsiveness factor
• Probability Threshold (0.01-0.2, default 0.03): Signal trigger threshold
Confidence Intervals:
• 1σ Confidence (60%-75%, default 68%): Normal range boundary
• 2σ Confidence (90%-98%, default 95%): Significant deviation boundary
• 3σ Confidence (99.5%-99.9%, default 99.7%): Extreme deviation boundary
Dynamic Adjustment:
• Enable Dynamic Adjustment: Automatically optimizes parameters based on market volatility
• Volatility Lookback (10-50, default 10): Period for volatility assessment
• Dynamic Sensitivity Multiplier (0.5-3.0, default 1.5): Volatility-based sensitivity adjustment
=== MATHEMATICAL FOUNDATION ===
SPPO is built on several key mathematical concepts:
1. Z-Score Standardization: Z = (X - μ) / σ
Where X = current price, μ = mean, σ = standard deviation
2. Normal Distribution Theory: Assumes prices follow normal distribution within rolling windows
3. Probability Density Function: PDF(z) = e^(-z²/2) / √(2π)
4. Cumulative Distribution Function: Approximates tail probabilities for extreme events
5. Dynamic Parameter Optimization: Adjusts calculation parameters based on market volatility percentiles
=== TRADING APPLICATIONS ===
1. Mean Reversion Strategy
- Entry: SPPO > +8 or < -8 with probability < 5%
- Confirmation: Momentum histogram showing divergence
- Exit: SPPO returns to ±3 range
2. Trend Confirmation
- Trend continuation: SPPO and histogram aligned
- Trend exhaustion: Extreme SPPO with weakening histogram
- Breakout validation: SPPO breaking confidence intervals with volume
3. Risk Management
- Position sizing based on probability inverse
- Stop-loss when SPPO extends beyond ±12
- Take-profit at statistical mean reversion levels
=== MARKET REGIME CLASSIFICATION ===
• Normal Range (|SPPO| < 3): Trend-following strategies preferred
• Moderate Deviation (3 < |SPPO| < 8): Cautious mean reversion with partial positions
• Extreme Deviation (|SPPO| > 8): Aggressive mean reversion with strict risk management
=== TIMEFRAME RECOMMENDATIONS ===
• Short-term Trading (30-50 period): Intraday scalping, high sensitivity
• Medium-term Analysis (50-80 period): Swing trading, balanced sensitivity
• Long-term Trends (80-120 period): Position trading, statistical stability focus
=== UNIQUE ADVANTAGES ===
1. Objective Signal Generation: Every signal backed by statistical probability
2. Self-Adaptive System: Automatically adjusts to changing market conditions
3. Multi-Dimensional Information: Six layers of visual information in single indicator
4. Universal Application: Works across all markets and timeframes
5. Risk Quantification: Provides probability-based risk assessment
6. Professional Visualization: Institutional-grade color schemes and data presentation
=== TECHNICAL SPECIFICATIONS ===
• Pine Script Version: v6 compatible
• Maximum Bars Back: 500 (optimized for performance)
• Calculation Efficiency: Incremental updates with caching
• Memory Management: Dynamic array sizing with intelligent cleanup
• Rendering Optimization: Conditional rendering to reduce resource consumption
=== ALERT CONDITIONS ===
• Extreme Probability Alert: Triggered when probability < extreme threshold
• Buy Signal Alert: Statistical mean reversion buy conditions met
• Sell Signal Alert: Statistical mean reversion sell conditions met
• High Volatility Alert: Market enters high volatility regime (>90th percentile)
=== COMPATIBILITY ===
• Asset Classes: Stocks, Forex, Commodities, Cryptocurrencies, Indices
• Timeframes: All standard timeframes (1m to 1M)
• Market Sessions: 24/7 markets and traditional market hours
• Data Requirements: Minimum 120 bars for optimal statistical accuracy
=== PERFORMANCE OPTIMIZATION ===
• Efficient Algorithms: Uses Pine Script built-in functions for optimal speed
• Memory Management: Limited historical data caching to prevent overflow
• Rendering Optimization: Layered rendering system reduces redraw overhead
• Precision Balance: Optimized balance between calculation accuracy and performance
=== RISK DISCLAIMER ===
SPPO is a statistical analysis tool designed to assist in market analysis. While based on rigorous mathematical principles, it should not be used as the sole basis for trading decisions. Always combine SPPO analysis with:
• Fundamental analysis
• Risk management practices
• Market context awareness
• Position sizing discipline
Past performance does not guarantee future results. Trading involves substantial risk of loss.
=== SUPPORT AND DOCUMENTATION ===
For detailed technical documentation, implementation examples, and advanced strategies, please refer to the comprehensive SPPO Technical Documentation included with this indicator.
=== VERSION INFORMATION ===
Current Version: 2.0
Last Updated: 2024
Compatibility: Pine Script v6
Author:
=== CONCLUSION ===
SPPO represents a significant advancement in technical analysis, bringing institutional-grade statistical modeling to retail traders. Its combination of mathematical rigor, adaptive intelligence, and professional visualization makes it an invaluable tool for traders seeking objective, probability-based market analysis.
The indicator's unique approach to quantifying price position within statistical distributions provides traders with unprecedented insight into market extremes and mean reversion opportunities, while its self-adaptive nature ensures consistent performance across varying market conditions.

Custom WatermarkThis script allows you to display a watermark text on your TradingView chart that:
Stays fixed on the screen (doesn’t move with candles).
Can be turned on/off manually.
Lets you type your own text directly from settings.
Can be placed in different corners or center of the chart.
Supports changing color, size, and visibility easily.

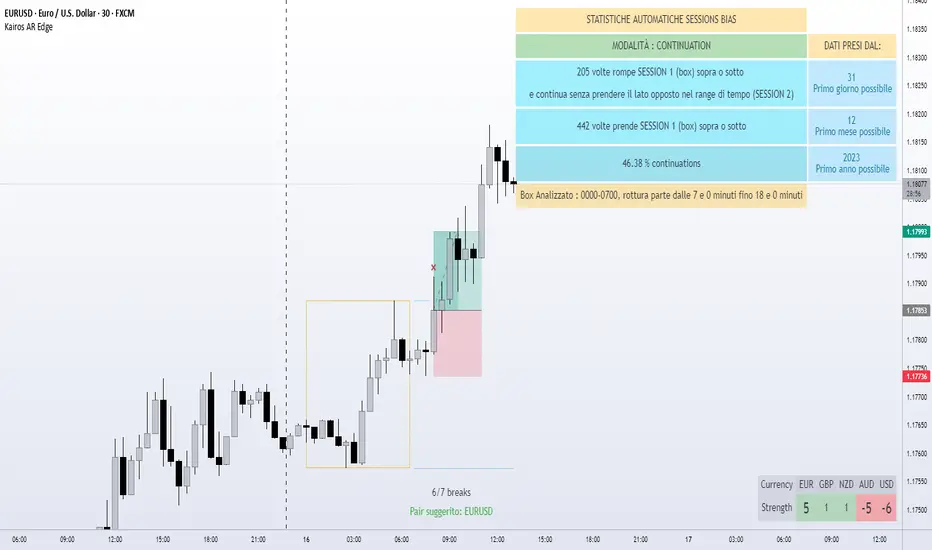
Kairos AR EdgeEN
Kairos AR Edge is a closed-source (invite-only) Forex indicator providing statistical analysis of Asian session box breakouts and relative currency strength across 28 major pairs. Unlike standard breakout or trend-following tools, it consolidates breakout behavior into a single overview, helping traders quickly identify directional bias and strong/weak currencies. This aggregation provides unique insight not easily obtained from separate pair analysis.
Important Clarification:
Reversal and Continuation percentages are calculated for the pair on which the indicator is applied , showing how often a breakout returns (Reversal) or continues (Continuation) within the selected session window.
The Currency Strength Table is independent of these percentages. It scores each currency from -7 to +7 based on participation in Asian box breakouts across all 28 pairs, providing a relative strength overview regardless of the active pair.
The -7/+7 scale is derived from historical breakout occurrences and provides a quick reference for currency strength ranking
Indicator operates on two levels:
Session Bias Statistics: Builds an Asian session box for the active pair and analyzes breakout behavior. Users can select:
Reversal Mode : Percentage of breakouts that return to the opposite side within the selected timeframe
Continuation Mode : Percentage of breakouts that continue in the same direction within the timeframe
Currency Strength Table: Aggregates breakout behavior across all 28 pairs to provide a relative currency strength score (-7 to +7)
Visual Tools: Optional pivot-based bullish/bearish triggers and automatic session box visualization provide additional informational support.
Main Features:
Customizable Asian session box (start/end times and timezone)
Reversal or Continuation statistical mode
Automatic update of high/low levels
Currency Strength Table (-7 to +7)
Statistical table with historical breakout percentages
Optional visual triggers (pivot-based patterns)
Light/Dark theme support
Originality and Value:
Consolidates 28 pairs into a single view for immediate identification of market bias
Provides statistical insight into breakout behavior, not just trend-following or generic breakout alerts
Offers a quick-reference Currency Strength Table to identify strong/weak currencies without tracking multiple pairs individually
Important Notes:
Statistics are based on historical data only – no guarantee of future results
Educational and informational purposes only; not financial or trading advice
Closed-source indicator with invite-only access. Access requests can be made by contacting the author or following the link in the Author’s Instructions field
IT
Kairos AR Edge è un indicatore closed-source (invite-only) che fornisce analisi statistica sulle rotture del box della sessione asiatica e forza relativa delle valute su 28 coppie principali. A differenza dei normali strumenti di breakout o trend-following, consolida il comportamento dei breakout in un’unica panoramica, aiutando i trader a identificare rapidamente bias direzionali e valute forti/deboli. Questa aggregazione offre insight unici non facilmente ottenibili analizzando coppie singole.
Chiarimento importante:
Le percentuali di Reversal e Continuation si riferiscono solo alla coppia su cui l’indicatore è applicato , calcolando quante volte una rottura ritorna (Reversal) o continua (Continuation) entro la finestra di sessione selezionata.
La Tabella di Forza Valute è indipendente da queste percentuali. Assegna a ciascuna valuta un punteggio da -7 a +7 in base alla partecipazione ai breakout del box asiatico su tutte le 28 coppie, fornendo un quadro della forza relativa indipendentemente dalla coppia attiva.
Il punteggio -7/+7 deriva dai breakout storici e fornisce un riferimento rapido per la forza delle valute.
Lo script opera su due livelli:
Statistiche Bias di Sessione: Costruisce il box della sessione asiatica per la coppia attiva e analizza i breakout. Modalità selezionabili:
Reversal : Percentuale di breakout che tornano verso il lato opposto entro la finestra temporale
Continuation : Percentuale di breakout che proseguono nella stessa direzione entro la finestra
Tabella di Forza Valute: Aggrega il comportamento dei breakout su tutte le 28 coppie, assegnando un punteggio da -7 a +7 per ciascuna valuta in base alla sua forza relativa
Strumenti Visivi: Box della sessione asiatica aggiornato automaticamente e trigger opzionali basati su pattern pivot, fornendo supporto informativo aggiuntivo.
Funzionalità principali:
Box della sessione asiatica personalizzabile (orari e timezone)
Modalità statistica: Reversal o Continuation
Aggiornamento automatico dei livelli high/low
Tabella di Forza Valute (-7 a +7)
Tabella statistica con percentuali di rottura storiche
Trigger visivi opzionali (pattern pivot)
Supporto tema chiaro/scuro
Originalità e Valore:
Consolida 28 coppie in un’unica panoramica per identificare immediatamente bias di mercato
Fornisce insight statistico sui breakout, non solo trend-following o alert generici
Tabella di Forza Valute rapida per identificare valute forti/deboli senza controllare molteplici coppie
Nota importante:
Le statistiche si basano solo su dati storici – nessuna garanzia di risultati futuri
Strumento educativo e informativo; non costituisce consiglio finanziario o di trading
Indicatore closed-source con accesso su invito. Le richieste di accesso possono essere fatte contattando l’autore o seguendo il link nelle istruzioni dell’autore
JST & MT5 hourly + Sessions shade (subpanel, v6)このインジケーターは、TradingViewのタイムゾーンをNY時間に設定している際に、日本国内居住者が東京時間(JST)とMetaTraderのサーバー時間(MSK/MT5)を把握しやすくするためのツールです。
チャート下部にJSTとMT5の時間メモリを表示し、取引時間の対応関係を直感的に確認できます。
セッションごとの背景シェード(東京・ロンドン・NY)にも対応しており、時間認識を補助します。
This indicator helps traders based in Japan easily keep track of Tokyo time (JST) and MetaTrader server time (MSK/MT5) when using TradingView with the timezone set to New York (a common choice worldwide).
It displays JST and MT5 time markers along the bottom of the chart, making the relation between trading sessions more intuitive.
Background shading for Tokyo, London, and New York sessions is also included to assist time awareness.

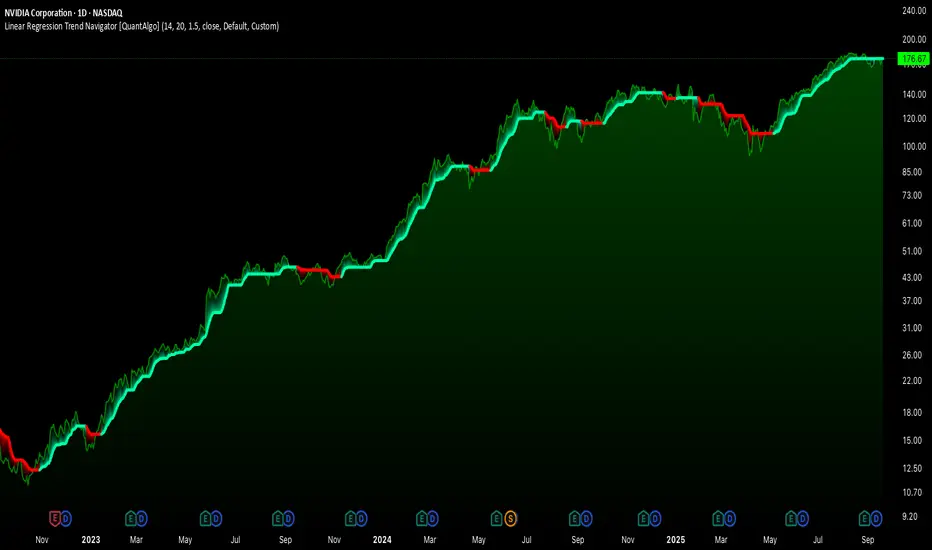
Linear Regression Trend Navigator [QuantAlgo]🟢 Overview
The Linear Regression Trend Navigator is a trend-following indicator that combines statistical regression analysis with adaptive volatility bands to identify and track dominant market trends. It employs linear regression mathematics to establish the underlying trend direction, while dynamically adjusting trend boundaries based on standard deviation calculations to filter market noise and maintain trend continuity. The result is a straightforward visual system where green indicates bullish conditions favoring buy/long positions, and red signals bearish conditions supporting sell/short trades.
🟢 How It Works
The indicator operates through a three-phase computational process that transforms raw price data into adaptive trend signals. In the first phase, it calculates a linear regression line over the specified period, establishing the mathematical best-fit line through recent price action to determine the underlying directional bias. This regression line serves as the foundation for trend analysis by smoothing out short-term price variations while preserving the essential directional characteristics.
The second phase constructs dynamic volatility boundaries by calculating the standard deviation of price movements over the defined period and applying a user-adjustable multiplier. These upper and lower bounds create a volatility-adjusted channel around the regression line, with wider bands during volatile periods and tighter bands during stable conditions. This adaptive boundary system operates entirely behind the scenes, ensuring the trend signal remains relevant across different market volatility regimes without cluttering the visual display.
In the final phase, the system generates a simple trend line that dynamically positions itself within the volatility boundaries. When price action pushes the regression line above the upper bound, the trend line adjusts to the upper boundary level. Conversely, when the regression line falls below the lower bound, the trend line moves to the lower boundary. The result is a single colored line that transitions between green (rising trend line = buy/long) and red (declining trend line = sell/short).
🟢 How to Use
Green Trend Line: Upward momentum indicating favorable conditions for long positions, buy signals, and bullish strategies
Red Trend Line: Downward momentum signaling optimal timing for short positions, sell signals, and bearish approaches
Rising Green Line: Accelerating bullish momentum with steepening angles indicating strengthening upward pressure and potential for trend continuation
Declining Red Line: Intensifying bearish momentum with increasing negative slopes suggesting persistent downward pressure and shorting opportunities
Flattening Trend Lines: Gradual reduction in slope regardless of color may indicate approaching consolidation or momentum exhaustion requiring position review
🟢 Pro Tips for Trading and Investing
→ Entry/Exit Timing: Trade exclusively on band color transitions rather than price patterns, as each color change represents a statistically-confirmed shift that has passed through volatility filtering, providing higher probability setups than traditional technical analysis.
→ Parameter Optimization for Asset Classes: Customize the linear regression period based on your trading style. For example, use 5-10 bars for day trading to capture short-term statistical shifts, 14-20 for swing trading to balance responsiveness with stability, and 25-50 for position trading to filter out medium-term noise.
→ Volatility Calibration Strategy: Adjust the standard deviation multiplier according to market volatility. For instance, increase to 2.0+ during high-volatility periods like earnings or news events to reduce false signals, decrease to 1.0-1.5 during stable market conditions to maintain sensitivity to genuine trends.
→ Cross-Timeframe Statistical Validation: Apply the indicator across multiple timeframes simultaneously, using higher timeframes for directional bias and lower timeframes for entry timing.
→ Alert-Based Systematic Trading: Use built-in alerts to eliminate discretionary decision-making and ensure you capture every statistically-significant trend change, particularly effective for traders who cannot monitor charts continuously.
→ Risk Allocation Based on Signal Strength: Increase position sizes during periods of strong directional movement while reducing exposure during frequent band color changes that indicate statistical uncertainty or ranging conditions.
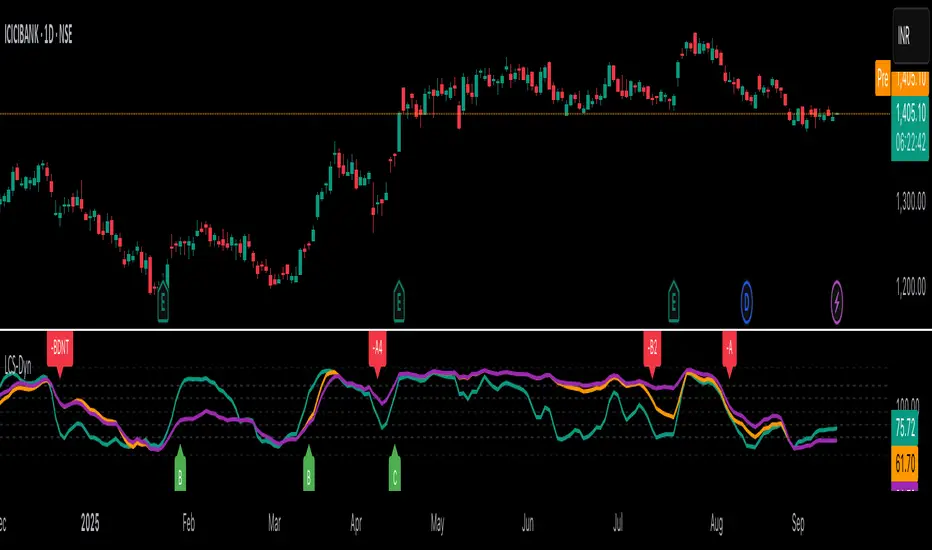
LCS DynamicUses adaptive calculations to generate signals each signal has different rules to trade which will be updated shortly
Z-Score Volume with CVD TrendZ-Score Volume & CVD Trend with Exhaustion Signals
This powerful, all-in-one indicator combines statistical volume analysis, Cumulative Volume Delta (CVD), and a custom clustering algorithm to provide a clear and dynamic view of market sentiment. It is designed to help traders identify the prevailing trend and spot potential reversals or trend exhaustion before they happen.
Important Note: This indicator is specifically designed and optimized for use during the Regular Trading Hours (RTH) New York session, which is typically characterized by high volume and volatility. Its signals may be less reliable in low-volume or overnight sessions.
Core Concepts
1. Volume Z-Score
The script first calculates a Z-score for volume, which measures how many standard deviations a bar's volume is from a moving average. This helps to identify statistically significant volume spikes that may signal institutional activity or a major shift in sentiment.
2. Cumulative Volume Delta (CVD)
CVD plots the net difference between buying and selling volume over time. A rising CVD indicates a surplus of buying pressure, while a falling CVD shows a surplus of selling pressure. This provides a clear look at the direction of momentum.
3. Custom Clustering
By combining the Volume Z-score and CVD delta, the script classifies each bar into one of six distinct "clusters." The purpose is to simplify complex data into actionable signals.
High Conviction Bullish: High Z-score volume with strong CVD buying.
High Conviction Bearish: High Z-score volume with strong CVD selling.
Effort vs. Result: High Z-score volume with no clear CVD bias, indicating indecision or a struggle between buyers and sellers.
Quiet Accumulation: Low volume with subtle CVD buying, suggesting passive accumulation.
Quiet Distribution: Low volume with subtle CVD selling, suggesting passive distribution.
Low Conviction/Noise: Low volume and low CVD, representing general market noise.
Trend and Exhaustion Logic
Trend Establishment: The indicator determines the overall trend (Bullish, Bearish, or Neutral) by analyzing the majority of recent clusters over a configurable lookback period.
A Bullish Trend is confirmed when a majority of recent bars are either "High Conviction Bullish" or "Quiet Accumulation."
A Bearish Trend is confirmed when a majority of recent bars are either "High Conviction Bearish" or "Quiet Distribution."
Trend Exhaustion: This is a key feature for identifying potential reversals. The script looks for a divergence between price action and CVD within a confirmed trend.
Bullish Exhaustion Signal: Occurs during a confirmed "Bullish Trend" when you see a bearish divergence (price makes a higher high, but CVD shows negative delta and a close lower than the open). This is a strong sign the uptrend may be running out of steam.
Bearish Exhaustion Signal: Occurs during a confirmed "Bearish Trend" when you see a bullish divergence (price makes a lower low, but CVD shows positive delta and a close higher than the open). This indicates the downtrend may be exhausted.
How to Interpret the Visuals
Volume Bars: Colored to match the cluster they belong to.
Background Color: Shows the overall trend (light green for bullish, light red for bearish).
Circle Markers (bottom): Green circles indicate a bullish trend, and red circles indicate a bearish trend.
Triangles and Circles (top): Represent the specific cluster of each bar.
Trend Exhaustion Markers: Triangles above/below the bar signal potential trend exhaustion.
Info Table: An optional table provides a real-time summary of all key metrics for the current bar.
Settings
Volume EMA Length: Adjusts the moving average used for the Volume Z-score calculation.
Z-Score Look Back: Defines the number of bars to use for the volume and CVD percentile calculation.
Lower/Upper Cluster Percentile: Use these to adjust the sensitivity of the clustering. Tighter ranges (e.g., 25/75) capture more data, while wider ranges (e.g., 10/90) will only signal truly extreme events.
Trend Lookback Bars: Controls how many recent bars are considered when determining the trend.
This script offers a comprehensive and easy-to-read way to integrate volume, momentum, and trend analysis into your trading.
Happy Trading!

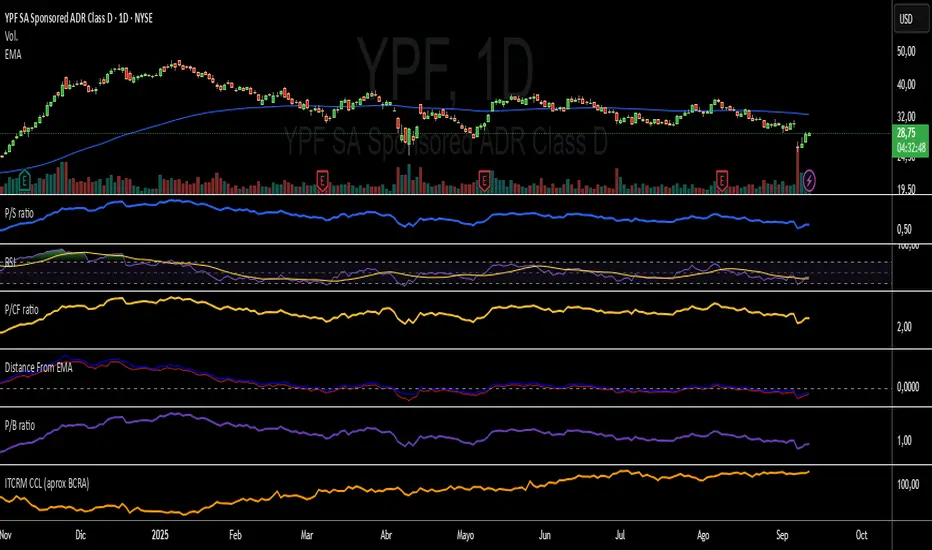
ITCRM CCL (aprox BCRA)This script calculates an approximation of the Real Multilateral Exchange Rate Index (ITCRM) with the CCL dollar, replicating the methodology of the Central Bank of Argentina (BCRA) but using the financial exchange rate (AL30C/AL30D) as a base.
Bilateral ARS/currency rates are built for Argentina’s main trading partners (Brazil, USA, Eurozone, China, etc.).
A weighted geometric average is applied according to trade shares.
The index is normalized to base 100 at the start of the series.
⚠️ This is a reference version, not official.
nATR*ATR Multiplication Indicator - Optimal Selection Tool forThis indicator is specifically designed as an analysis tool for investors using grid bot strategies. It displays both nATR (Normalized Average True Range) and ATR (Average True Range) values on a single chart screen, calculating the multiplication of these two critical volatility measurements.
Primary Purpose of the Indicator:
To facilitate the selection of the most optimal stock and time period for grid bot trading. The nATR*ATR multiplication provides a hybrid measurement that combines both percentage-based return potential (nATR) and absolute volatility magnitude (ATR).
Importance for Grid Bot Strategy:
High nATR: Greater percentage-based return potential
High ATR: Wider price range = Fewer grid levels = More budget allocation per grid
Formula: Price Range/ATR = Theoretical Grid Count
Usage Advantages:
Test different time periods to find the highest multiplication value
Make optimal stock and time frame selections for grid bot setup
Monitor both nATR and ATR values on a single screen
High multiplication values indicate ideal conditions for grid bots
Technical Features:
Adjustable calculation period (1-500 candles)
Visual alert system (high/low multiplication values)
Real-time value tracking table
SMA-based smoothed calculations
This serves as a reliable guide for grid bot investors in optimal timing and stock selection.

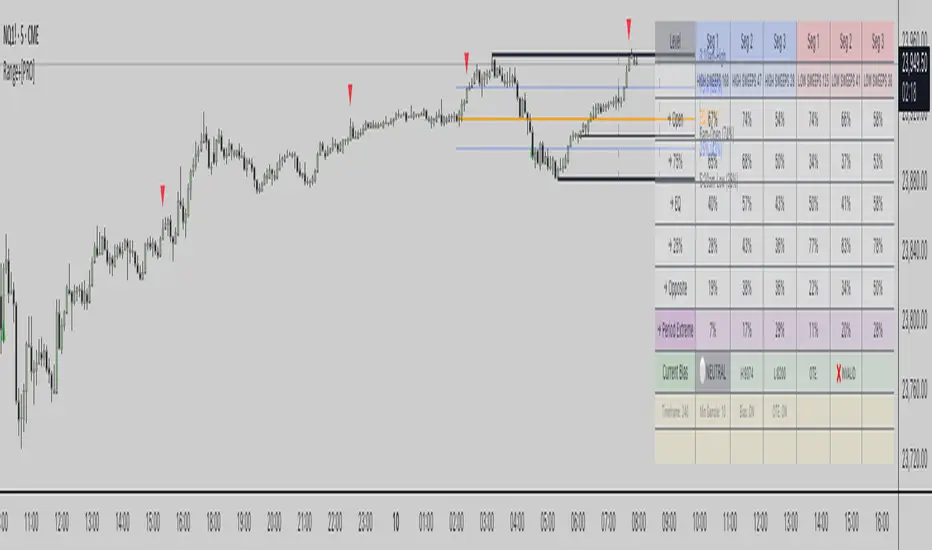
Range Stats with Sweeps + Time Analysis + BiasRange Stats with Sweeps + Time Analysis + Bias
Advanced range-based trading analysis with comprehensive sweep detection, time-based probability modeling, and intelligent bias calculation for institutional-grade market insights.
Overview
Range Stats with Sweeps + Time Analysis + Bias is a sophisticated Pine Script indicator designed for professional traders who demand precision in range-based market analysis. This comprehensive tool combines traditional range level analysis with advanced sweep detection algorithms, time-based probability modeling, and dynamic bias calculation to provide institutional-quality insights into market behavior patterns.
Core Features
Multi-Timeframe Range Analysis
Automatic or manual timeframe selection with intelligent defaults
Comprehensive range level calculation including High, Low, Open, 75%, EQ (50%), and 25% retracements
Dynamic period detection supporting both traditional timeframes and custom session-based analysis
Real-time range updates with historical data preservation
Advanced Sweep Detection System
Configurable sweep validation with customizable bar confirmation periods
Optional wick-based sweep requirements for enhanced precision
Segment-based sweep tracking dividing periods into three analytical zones
Real-time sweep markers with probability-enhanced labeling
Comprehensive Bias Calculation Framework
Intelligent range bias determination based on price action relative to range boundaries
Dynamic bias tracking with bullish, bearish, and neutral state identification
Historical bias performance statistics with hit rate analysis
Optimal Trade Entry (OTE) box generation based on current bias and displacement analysis
Time-Based Probability Analysis
Formation time tracking for high and low levels with customizable time buckets
Sweep probability calculation based on exact formation timing
Multiple time range displays including Full 24H, Extended Trading, US Market, EU Market, and Asia Market sessions
Custom session configuration with intelligent session-based level detection
Professional Visualization System
Customizable line styles, colors, and transparency settings for all range levels
Segment projection lines for period structure visualization
Comprehensive probability tables with real-time statistics
Time-enhanced labels showing formation times and sweep probabilities
Technical Implementation
Range Detection Logic
The system employs sophisticated algorithms to identify range boundaries using either traditional timeframe-based detection or custom session-based analysis. Range levels are calculated with mathematical precision, providing 75%, 50%, and 25% retracement levels based on period high-low ranges.
Sweep Analysis Framework
Advanced sweep detection monitors price action for liquidity grabs above highs and below lows, with configurable validation periods ensuring sweep authenticity. The system tracks sweep occurrences across three distinct period segments, enabling granular probability analysis.
Bias Calculation Engine
The intelligent bias system analyzes price behavior relative to range boundaries, considering factors such as wick interactions, close positioning, and directional momentum. This generates dynamic bias signals that adapt to changing market conditions.
Time-Based Modeling
Sophisticated time bucket analysis tracks formation times for range extremes, building comprehensive probability models that identify optimal trading windows based on historical performance patterns.
Configuration Options
Core Settings
Automatic or manual timeframe selection with comprehensive options
Global timezone support with major market timezone presets
Configurable label sizing and time format preferences
Advanced sweep validation parameters with wick-based options
Range Level Customization
Individual control over all range level displays and styling
Custom color schemes with transparency controls
Line style selection including solid, dashed, and dotted options
Adjustable line widths for enhanced visual hierarchy
Advanced Features
Segment projection line configuration for period structure analysis
Bias calculation toggle with OTE box generation
Sweep extreme probability tracking with period extreme analysis
Comprehensive sweep marker system with probability labeling
Time Analysis Configuration
Multiple time bucket options including 20-minute, 1-hour, 2-hour, and custom session buckets
Flexible time range displays optimized for different trading sessions
Custom session configuration with intelligent session-based level detection
Advanced table positioning and sizing options
Trading Applications
Range-Based Strategy Development
Identify key support and resistance levels within established ranges, analyze retracement probabilities for optimal entry timing, and utilize segment-based analysis for precise trade planning.
Sweep-Based Trading
Monitor liquidity grab events with high-probability retracement targets, track sweep occurrences across different period segments, and leverage time-based sweep probability for enhanced timing.
Bias-Driven Analysis
Utilize dynamic bias calculation for directional trade alignment, implement OTE box strategies for institutional-style entries, and monitor bias shifts for trend change identification.
Time-Based Optimization
Optimize trade timing using formation time probability analysis, focus on high-probability time windows for specific market behaviors, and customize analysis for preferred trading sessions.
Technical Specifications
Built on Pine Script v6 with advanced optimization techniques
Comprehensive data collection with intelligent memory management
Real-time probability calculation with historical data preservation
Multi-session support with custom timezone handling
Professional-grade visualization with institutional styling
Important Considerations
This indicator is designed for experienced traders familiar with range-based analysis and institutional trading concepts. Optimal performance requires adequate historical data for probability calculation accuracy. Users should ensure proper timeframe and session configuration alignment with their trading strategy.
Disclaimer
This indicator is provided for educational and informational purposes only. It does not constitute financial advice, investment recommendations, or trading signals. All trading decisions should be based on your own analysis, risk tolerance, and financial situation. Past performance does not guarantee future results. Trading involves substantial risk of loss and is not suitable for all investors. The probability statistics and bias calculations are based on historical data and may not predict future market behavior. Always conduct thorough research and consider consulting with qualified financial professionals before making trading decisions.
Copyright
© 2025 OmarxQQQ. All rights reserved. This Pine Script indicator and its associated documentation are protected by copyright law. Unauthorized reproduction, distribution, or modification is prohibited. This code is subject to the terms of the Mozilla Public License 2.0.
Range Stats with Sweeps + Time Analysis + Bias - Professional range analysis with institutional-grade probability modeling.