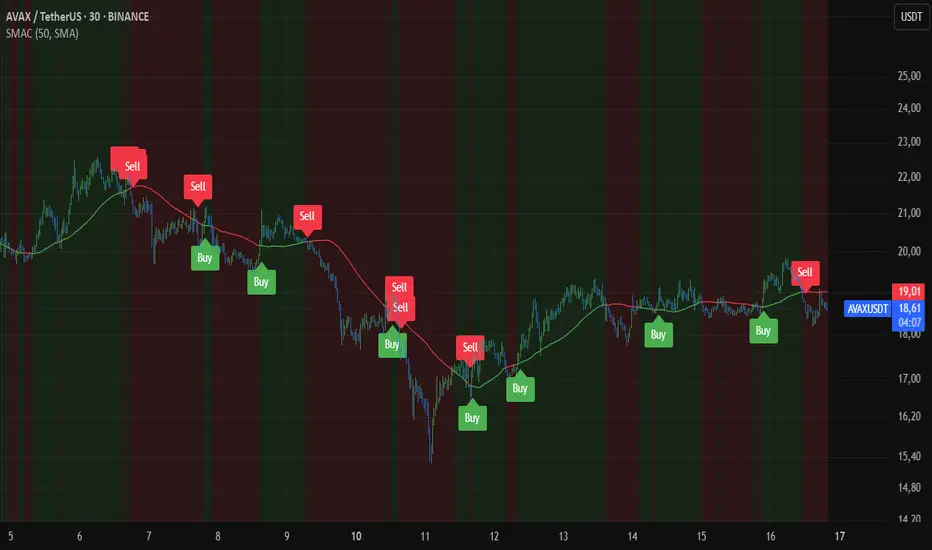
Smart MA CrossoverThe Smart MA Crossover indicator is a trend-following tool designed to help traders identify high-probability buy and sell signals based on a dynamic moving average and volume confirmation.
This indicator allows traders to customize the moving average type (SMA, EMA, HMA, WMA, VWMA, SMMA, or VWAP) while incorporating an ATR-based filter for better signal clarity.
How It Works
The script analyzes price movements in relation to a selected moving average and volume conditions to generate trend-based trade signals:
🟢 Buy Signal:
- Price is trading above the moving average for at least two bars.
- A sudden upward momentum is detected (price > open * 1.005).
- Volume is higher than the 50-period SMA of volume.
- The price was trading below the moving average three bars ago.
🔴 Sell Signal:
- Price is trading below the moving average for at least two bars.
- A sudden downward movement is detected (price < open * 0.995).
- Volume is higher than the 50-period SMA of volume.
- The price was trading above the moving average three bars ago.
- When these conditions are met, a label appears on the chart, marking the potential trade signal.
Key Features
- Customizable Moving Averages – Choose between SMA, EMA, HMA, WMA, VWMA, SMMA, or VWAP.
- Dynamic Trend Detection – Moving average color changes based on trend direction.
- Volume Confirmation – Avoid false signals by filtering trades using SMA-based volume analysis.
- ATR-Based Signal Placement – Labels are positioned dynamically based on ATR values to improve visibility.
- Background Trend Highlighting – The background changes color depending on whether price is above (green) or below (red) the moving average.
- Alerts for Buy & Sell Signals – Get real-time notifications when a trade signal is generated.
How to Use
- This indicator is best suited for trend-following strategies and works across different markets, including stocks, forex, and crypto.
- It can be used on multiple timeframes, but traders should combine it with additional analysis to refine trade decisions.
- ATR-based signal placement ensures that buy/sell labels do not clutter the chart.
Important Notes
- This indicator does not predict future price movements—it is a trend-based tool meant to assist with trade decisions.
- No financial advice – Always use risk management when trading.
- TradingView users who do not read Pine Script can still fully utilize this script thanks to clear labels and alerts.
ค่าเฉลี่ยเคลื่อนที่แบบง่าย (SMA)
Best MA Pair Finder (Crossover Strategy)This indicator automatically identifies the optimal pair of moving averages (MAs) for a crossover strategy using all available historical data. It offers several MA options—including SMA, EMA, and TEMA—allowing users to select the desired type in the settings. The indicator supports two strategy modes: “Long Only” and “Buy & Sell”, which can be chosen via the options.
For each MA pair combination, the indicator performs a backtest and calculates the profit factor, considering only those pairs where the total number of trades meets or exceeds the user-defined "Minimum Trades" threshold. This parameter ensures that the selected optimal pair is based on a statistically meaningful sample rather than on a limited number of trades.
The results provided by this indicator are based on historical data and backtests, which may not guarantee future performance. Users should conduct their own analysis and use proper risk management before making trading decisions.

ROC + SMI Auto Adjust
This indicator combines the Rate of Change (ROC) and the Stochastic Momentum Index (SMI) with automatically adjusted parameters for different time frames (short, medium, long). It normalizes the ROC to match the SMI levels, displays the ROC as a histogram and the SMI as lines, highlights overbought/oversold zones and includes a settings table. Ideal for analyzing momentum on different time frames.
Key Features:
Automatic Parameter Adjustment:
The script detects the current chart time frame (e.g. 1-minute, 1-hour, daily) and adjusts the parameters for the ROC and SMI accordingly.
Parameters such as ROC length, SMI length and smoothing periods are optimized for short, medium and long term time frames.
Rate of Change (ROC):
ROC measures the percentage change in price over a specified period.
The script normalizes the ROC values to match the SMI range, making it easier to compare the two indicators on the same scale.
The ROC is displayed as a histogram, where positive values are colored green and negative values are colored red.
Stochastic Momentum Index (SMI):
SMI is a momentum oscillator that identifies overbought and oversold conditions.
The script calculates the SMI and its signal line, plotting them on the chart.
Overbought and oversold levels are displayed as dotted lines for convenience.
SMI and SMI Signal Crossover:
When the main SMI crosses the signal line from below upwards, it may be a buy signal (bullish signal).
When the SMI crosses the signal line from above downwards, it may be a sell signal (bearish signal).
Configurable Inputs:
Users can use the automatically adjusted settings or manually override the parameters (e.g. ROC length, SMI length, smoothing periods).
Overbought and oversold levels for SMI are also configurable.
Parameter Table:
A table is displayed on the chart showing the current parameters (e.g. timeframe, ROC length, SMI length) for transparency and debugging.
The position of the table is configurable (e.g. top left, bottom right).
How it works:
The script first detects the chart timeframe and classifies it as short-term (e.g. 1M, 5M), medium-term (e.g. 1H, 4H) or long-term (e.g. D1, W1).
Based on the timeframe, it sets default values for the ROC and SMI parameters.
ROC and SMI are calculated and normalized so that they can be compared on the same scale.
ROC is displayed as a histogram, while SMI and its signal line are displayed as lines.
Overbought and oversold levels are displayed as horizontal lines.
Use cases:
Trend identification: ROC helps to identify the strength of the trend, while SMI indicates overbought/oversold conditions.
Momentum analysis: The combination of ROC and SMI provides insight into both price momentum and potential reversals.
Time frame flexibility: The auto-adjustment feature makes the script suitable for scalping (short-term), swing trading (medium-term) and long-term investing.

Trend Zone Moving Averages📈 Trend Zone Moving Averages
The Trend Zone Moving Averages indicator helps traders quickly identify market trends using the 50SMA, 100SMA, and 200SMA. With dynamic background colors, customizable settings, and real-time alerts, this tool provides a clear view of bullish, bearish, and extreme trend conditions.
🔹 Features:
Trend Zones with Dynamic Background Colors
Green → Bullish Trend (50SMA > 100SMA > 200SMA, price above 50SMA)
Red → Bearish Trend (50SMA < 100SMA < 200SMA, price below 50SMA)
Yellow → Neutral Trend (Mixed signals)
Dark Green → Extreme Bullish (Price above all three SMAs)
Dark Red → Extreme Bearish (Price below all three SMAs)
Customizable Moving Averages
Toggle 50SMA, 100SMA, and 200SMA on/off from the settings.
Perfect for traders who prefer a cleaner chart.
Real-Time Trend Alerts
Get instant notifications when the trend changes:
🟢 Bullish Zone Alert – When price enters a bullish trend.
🔴 Bearish Zone Alert – When price enters a bearish trend.
🟡 Neutral Zone Alert – When trend shifts to neutral.
🌟 Extreme Bullish Alert – When price moves above all SMAs.
⚠️ Extreme Bearish Alert – When price drops below all SMAs.
✅ Perfect for Any Market
Works on stocks, forex, crypto, and commodities.
Adaptable for day traders, swing traders, and investors.
⚙️ How to Use: Trend Zone Moving Averages Strategy
This strategy helps traders identify and trade with the trend using the Trend Zone Moving Averages indicator. It works across stocks, forex, crypto, and commodities.
🟢 Bullish Trend Strategy (Green Background)
Objective: Look for buying opportunities when the market is in an uptrend.
Entry Conditions:
✅ Background is Green (Bullish Zone).
✅ Price is above the 50SMA (confirming strength).
✅ Price pulls back to the 50SMA and bounces OR breaks above a key resistance level.
Stop Loss:
🔹 Place below the most recent swing low or just under the 50SMA.
Take Profit:
🔹 First target at the next resistance level or recent swing high.
🔹 Second target if price continues higher—trail stops to lock in profits.
🔴 Bearish Trend Strategy (Red Background)
Objective: Look for shorting opportunities when the market is in a downtrend.
Entry Conditions:
✅ Background is Red (Bearish Zone).
✅ Price is below the 50SMA (confirming weakness).
✅ Price pulls back to the 50SMA and rejects OR breaks below a key support level.
Stop Loss:
🔹 Place above the most recent swing high or just above the 50SMA.
Take Profit:
🔹 First target at the next support level or recent swing low.
🔹 Second target if price keeps falling—trail stops to secure profits.
🌟 Extreme Trend Strategy (Dark Green / Dark Red Background)
Objective: Trade with momentum when the market is in a strong trend.
Entry Conditions:
✅ Dark Green Background → Extreme Bullish: Price is above all three SMAs (strong uptrend).
✅ Dark Red Background → Extreme Bearish: Price is below all three SMAs (strong downtrend).
Trade Execution:
🔹 For longs (Dark Green): Look for breakout entries above resistance or pullbacks to the 50SMA.
🔹 For shorts (Dark Red): Look for breakdown entries below support or rejections at the 50SMA.
Risk Management:
🔹 Use tighter stop losses and trail profits aggressively to maximize gains.
🟡 Neutral Trend Strategy (Yellow Background)
Objective: Avoid trading or wait for a breakout.
What to Do:
🔹 Avoid trading in this zone—price is indecisive.
🔹 Wait for confirmation (background turns green/red) before taking a trade.
🔹 Use alerts to notify you when the trend resumes.
📌 Final Tips
Use this strategy with price action for extra confirmation.
Combine with support/resistance levels to improve accuracy.
Set alerts for trend changes so you never miss an opportunity.
Enjoy!

Panic Drop Stock Market Bull/Bear Market Panic Drop Bull/Bear
What It Does:
This indicator identifies bull and bear markets for the S&P 500 (or any stock/index) using the 50-period and 150-period Simple Moving Averages (SMAs). A green background signals a confirmed bull market when the 50 SMA is above the 150 SMA and the 150 SMA slope is flat or upward. A red background signals a confirmed bear market when the 50 SMA is below the 150 SMA and the 150 SMA slope is downward. The background color persists until a new confirmed state is detected, ensuring no gaps—perfect for spotting long-term market trends whether you’re a beginner, trend trader, or long-term investor.
Key Features:
Plots 50 SMA (default: blue line) and 150 SMA (default: orange line).
Background highlights: green for bull markets, red for bear markets.
Persistent background color—no gaps during unconfirmed periods.
Alerts for confirmed bull and bear market transitions.
Fully adjustable: MA periods, slope lookback, and more.
How to Use It:
Add to your S&P 500 chart (e.g., SPX or SPY) on a daily or weekly timeframe (daily default recommended for long-term trends).
Watch for background color changes:
Green background: Confirmed bull market—consider long positions or holding.
Red background: Confirmed bear market—consider shorting or exiting longs.
Customize via settings:
Adjust MA periods (default: 50 and 150).
Set slope lookback (default: 5 bars) to control slope sensitivity.
Change MA colors if desired.
Set alerts: Right-click on the chart > "Add Alert" > Select "Bull Market Confirmed" or "Bear Market Confirmed."
Trade smart: Use the background to confirm market regimes—e.g., go long during green (bull) phases above key support levels, or protect capital during red (bear) phases.
Why It’s Great:
Beginners: Simple background colors make market trends easy to spot.
Trend Traders: 50/150 SMA crossover with slope confirmation catches major market shifts.
Long-Term Investors: Persistent background ensures you stay in the trend without noise.
Created by Timothy Assi (Panic Drop), eToro’s elite investor. Test it, tweak it, and trade with confidence!

Price / 200 SMA Ratio (Pr)Price / 200 SMA Ratio (Pr) Indicator
The Price / 200 SMA Ratio (Pr) indicator is designed to help traders analyze the relationship between the current price and the 200-period Simple Moving Average (SMA). By calculating the ratio of the close price to the 200 SMA, the indicator provides a visual representation of how the price compares to the long-term trend, giving traders a clear view of potential overbought or oversold conditions.
How It Works:
Ratio Calculation:
The core of this indicator lies in the ratio between the current close price and the 200-period Simple Moving Average (SMA). The formula is straightforward:
Ratio = Close Price / 200 SMA
This ratio indicates whether the current price is above or below the long-term trend (the 200 SMA). A ratio greater than 1 means the price is above the 200 SMA, while a ratio below 1 suggests the price is below the 200 SMA.
Color-Coded Ratio Representation:
The ratio is displayed as a line on the chart with a color that changes dynamically based on the value of the ratio. The color-coding system helps quickly identify key levels:
Black: When the ratio is greater than 5, the price is significantly above the 200 SMA, indicating a highly overbought condition.
Red: When the ratio is greater than 3.5, it signals that the price is significantly above the long-term average but not in extreme territory.
Blue: When the ratio is less than 1, the price is below the 200 SMA, indicating that the market may be in an oversold condition.
Purple: When the ratio is below 0.7, it suggests an extremely oversold market, well below the long-term average.
Green: For values in between, the ratio is considered to be in a more neutral range, showing a balanced market position.
Horizontal Reference Lines:
To make the interpretation of the ratio easier, the indicator includes several reference lines plotted at key ratio levels. These lines help traders visualize specific price zones, giving them clear boundaries for potential trading decisions:
5 Zone (Black line): Marks an extremely high price level, indicating a highly overbought condition.
3.5 Zone (Red line): Represents the upper price zone, where prices are significantly higher than the 200 SMA.
2 Zone (Purple line): This line marks the mid-range of the ratio, providing a visual representation of the transition between overbought and oversold conditions.
1 Zone (Orange line): The 1.0 line is where the price equals the 200 SMA, indicating a balanced market. Prices above 1.0 are considered above average, and prices below 1.0 are below average.
0.7 Zone (Blue line): Represents a very low price level, suggesting an extremely oversold market.
Extra Low Zone (Green line): This line marks an even lower price level, indicating severe oversold conditions.
Background Coloring:
In addition to the ratio line and reference lines, the background color of the chart changes dynamically to provide additional context to the trader:
Red Background: When the ratio is greater than 3.5, the background becomes red, signaling an overbought market condition.
Blue Background: When the ratio is less than 1, the background turns blue, indicating a potential oversold market.
Black Background: If the ratio exceeds 5, the background will be black, signifying an extreme overbought condition.
Green Background: If the ratio drops below 0.7, the background turns green, highlighting an extremely oversold market.
Candle Coloring:
The indicator also changes the color of the individual price bars (candles) based on the ratio value:
Black Candles: When the ratio is greater than 5 or less than 0.7, the price bars are black to emphasize extreme conditions in the market.
White Candles: For all other values, the candles are white, representing a neutral market condition.
What This Indicator Tells You:
Overbought Conditions: When the ratio is significantly above 1 (especially greater than 3.5 or 5), it indicates that the price is far above the 200 SMA, suggesting that the market may be overbought and could experience a correction.
Oversold Conditions: When the ratio is significantly below 1 (especially below 0.7 or 0.5), it suggests that the price is far below the 200 SMA, indicating that the market may be oversold and could be due for a bounce.
Trend and Momentum: The ratio provides insight into the overall trend. If the ratio is consistently above 1, it means the price is generally in an uptrend, and if it’s below 1, it indicates a downtrend.
Why Use This Indicator?
The Price / 200 SMA Ratio indicator is a valuable tool for traders who want to gain insights into the strength or weakness of the price relative to the long-term trend (200 SMA). The color-coding system provides an easy-to-read visual cue, and the reference lines allow traders to identify key price levels where potential reversal or continuation could occur. It helps to spot areas of overbought or oversold conditions, making it ideal for traders looking to enter or exit positions based on extreme price movements.
By combining this indicator with other technical analysis tools, traders can enhance their strategy and make more informed decisions in the market.

SMA Strategy Builder: Create & Prove Profitability📄 Pine Script Strategy Description (For Publishing on TradingView)
🎯 Strategy Title:
SMA Strategy Builder: Create & Prove Profitability
✨ Description:
This tool is designed for traders who want to build, customize, and prove their own SMA-based trading strategies. The strategy tracks capital growth in real-time, providing clear evidence of profitability after each trade. Users can adjust key parameters such as SMA period, take profit levels, and initial capital, making it a flexible solution for backtesting and strategy validation.
🔍 Key Features:
✅ SMA-Based Logic:
Core trading logic revolves around the Simple Moving Average (SMA).
SMA period is fully adjustable to suit various trading styles.
🎯 Customizable Take Profit (TP):
User-defined TP percentages per position.
TP line displayed as a Step Line with Breaks for clear segmentation.
Visual 🎯TP label for quick identification of profit targets.
💵 Capital Tracking (Proof of Profitability):
Initial capital is user-defined.
Capital balance updates after each closed trade.
Shows both absolute profit/loss and percentage changes for every position.
Darker green profit labels for better readability and dark red for losses.
📈 Capital Curve (Performance Visualization):
Capital growth curve available (hidden by default, can be enabled via settings).
📏 Dynamic Label Positioning:
Label positions adjust dynamically based on the price range.
Ensures consistent visibility across low and high-priced assets.
⚡ How It Works:
Long Entry:
Triggered when the price crosses above the SMA.
TP level is calculated as a user-defined percentage above the entry price.
Short Entry:
Triggered when the price crosses below the SMA.
TP level is calculated as a user-defined percentage below the entry price.
TP Execution:
Positions close immediately once the TP level is reached (no candle close confirmation needed).
🔔 Alerts:
🟩 Long Signal Alert: When the price crosses above the SMA.
🟥 Short Signal Alert: When the price crosses below the SMA.
🎯 TP Alert: When the TP target is reached.
⚙️ Customization Options:
📅 SMA Period: Choose the moving average period that best fits your strategy.
🎯 Take Profit (%): Adjust TP percentages for flexible risk management.
💵 Initial Capital: Set the starting capital for realistic backtesting.
📈 Capital Curve Toggle: Enable or disable the capital curve to track overall performance.
🌟 Why Use This Tool?
🔧 Flexible Strategy Creation: Adjust core parameters and create tailored SMA-based strategies.
📈 Performance Proof: Capital tracking acts as real proof of profitability after each trade.
🎯 Immediate TP Execution: No waiting for candle closures; profits lock in as soon as targets are hit.
💹 Comprehensive Performance Insights: Percentage-based and absolute capital tracking with dynamic visualization.
🏦 Clean Visual Indicators: Strategy insights made clear with dynamic labeling and adjustable visuals.
⚠️ Disclaimer:
This script is provided for educational and informational purposes only. Trading financial instruments carries risk, and past performance does not guarantee future results. Always perform your own due diligence before making any trading decisions.

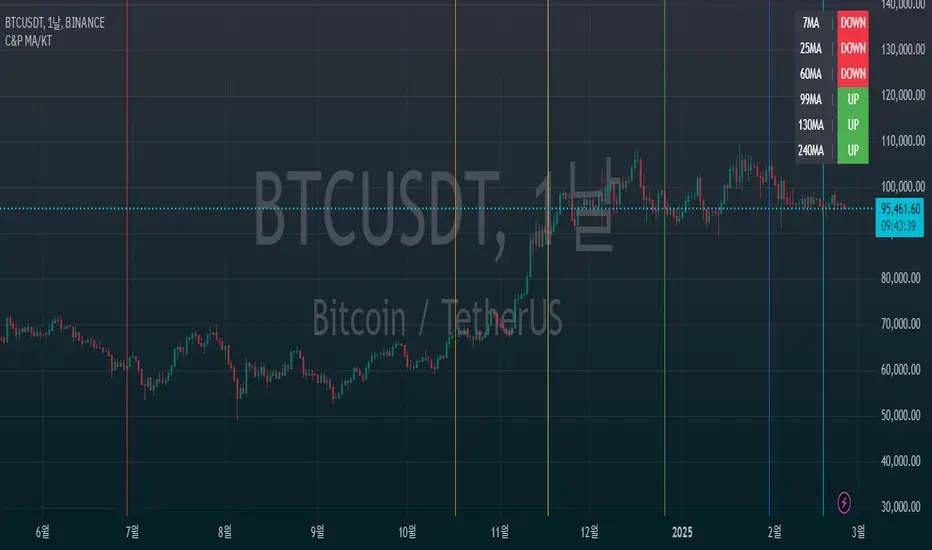
C&P MA/KT Compare & Predict Moving average / Current market price.
This is simple table indicator. Located at right-top of chart. Shows which way will MA's head go.
I made this indicator for automate candle countings & compare price. With this friend, you will be know trend more faster then waiting traditional MA golden / dead crossing.
In factory settings, current market price will be compared with closing price of the candle, corresponding to previous number 7, 25, 60, 99, 130, 240. If Current market price is lower then past, the box for the corresponding MA is highlighted in red and appears as Down. In opposite case, it will be highlighted in green and indicates Up.
MA와 시장가 차이로 MA의 머리 방향을 예측해주는 간단한 지표입니다.
수동으로 캔들 되돌려서 종가와 시장가 비교하는게 너무 번거로워서 자동화를 위해 제작되었습니다. 해당 지표를 이용하시면 MA의 골든/데드 크로스를 기다리는 것보다 더 빠른 예측이 가능합니다.
차트 우측 상단에 예측 값이 표시되며, 기본 설정에선 7, 25, 60, 99, 130, 240개 전 캔들의 종가와 시장가가 비교됩니다. 시장가가 비교 값보다 높을 때는 초록 배경에 Up 텍스트가 출력됩니다. 반대의 경우엔 빨간색 배경에 Down 표기가 나타납니다.
Smart MA Crossover BacktesterSmart MA Crossover Backtester - Strategy Overview
Strategy Name: Smart MA Crossover Backtester
Published on: TradingView
Applicable Markets: Works well on crypto (tested profitably on ETH)
Strategy Concept
The Smart MA Crossover Backtester is an improved Moving Average (MA) crossover strategy that incorporates a trend filter and an ATR-based stop loss & take profit mechanism for better risk management. It aims to capture trends efficiently while reducing false signals by only trading in the direction of the long-term trend.
Core Components & Logic
Moving Averages (MA) for Entry Signals
Fast Moving Average (9-period SMA)
Slow Moving Average (21-period SMA)
A trade signal is generated when the fast MA crosses the slow MA.
Trend Filter (200-period SMA)
Only enters long positions if price is above the 200-period SMA (bullish trend).
Only enters short positions if price is below the 200-period SMA (bearish trend).
This helps in avoiding counter-trend trades, reducing whipsaws.
ATR-Based Stop Loss & Take Profit
Uses the Average True Range (ATR) with a multiplier of 2 to calculate stop loss.
Risk-Reward Ratio = 1:2 (Take profit is set at 2x ATR).
This ensures dynamic stop loss and take profit levels based on market volatility.
Trading Rules
✅ Long Entry (Buy Signal):
Fast MA (9) crosses above Slow MA (21)
Price is above the 200 MA (bullish trend filter active)
Stop Loss: Below entry price by 2× ATR
Take Profit: Above entry price by 4× ATR
✅ Short Entry (Sell Signal):
Fast MA (9) crosses below Slow MA (21)
Price is below the 200 MA (bearish trend filter active)
Stop Loss: Above entry price by 2× ATR
Take Profit: Below entry price by 4× ATR
Why This Strategy Works Well for Crypto (ETH)?
🔹 Crypto markets are highly volatile – ATR-based stop loss adapts dynamically to market conditions.
🔹 Long-term trend filter (200 MA) ensures trading in the dominant direction, reducing false signals.
🔹 Risk-reward ratio of 1:2 allows for profitable trades even with a lower win rate.
This strategy has been tested on Ethereum (ETH) and has shown profitable performance, making it a strong choice for crypto traders looking for trend-following setups with solid risk management. 🚀

MTF Ichimoku Conversion Line SMA with H/L mirrored levelsWelcome to MTF Ichimoku Conversion Line with SMA Highs/Lows Extended Lines!
1. Overview
It is designed to provide a multi-timeframe view of market trends and potential support/resistance levels by obtaining a Simple Moving Average (SMA) of the Conversion Line of Ichimoku Equibilium (Ichimoku Kinko-Hyo), which acts as a substantial trend line on the candlestick chart. The SMA of the conversion line smooths out price fluctuations and indicates the overall trend direction—if the candles are above it, the trend can be read as an uptrend, while below it, the trend can be read as a downtrend.
2. Calculation
The indicator first calculates the Conversion Line (see the description of Ichimoku theory anywhere, e.g., Wikipedia), as the average of the highest high and lowest low over a user-defined period (Conversion Line Length, default is 9, also recommended is 9).
It then retrieves this Conversion Line from a higher timeframe (MTF Timeframe) to add a broader perspective. Using a specified period (SMA Length)., an SMA is computed on this multi-timeframe conversion line. This SMA serves as a trend line that visually represents the prevailing price trend, making it easier to assess market direction.
3. Pivot Highs/low detection and drawing their extensions
In addition, the indicator identifies pivot highs and lows from the SMA data using a defined pivot length. When these pivots occur, horizontal lines are drawn and extended across the chart. These extended lines (drawn in a yellowish color by default) include a full extension, a half extension, and a middle extension line representing the midpoint between the high and low pivot.
4. Mirror lines
The indicator also offers optional mirror line features. When the Mirror Upside option is enabled, five additional lines are drawn above the highest extended yellow line at equal intervals. Similarly, when the Mirror Downside option is enabled, five lines are drawn below the lowest extended yellow line. These light gray mirror lines serve as extra reference levels, which can help identify potential support or resistance zones.
5. Parameters
User parameters include:
- Conversion Line Length: The period used to calculate the conversion line.
- MTF Timeframe: The higher timeframe from which the conversion line is obtained.
- SMA Length: The period over which the SMA is calculated on the conversion line.
- SMA Mode: A toggle to display either the SMA or the raw conversion line (SMA recommended).
- SMA Line Width: The thickness of the SMA line.
- Pivot Length for SMA Highs/Lows: The period used to detect pivot highs and lows in the SMA.
- Horizontal Extension: Number of bars by which the pivot and extended lines are drawn across the chart
- Colors for High and Low Pivot Lines and Extended Lines: Customizable colors are used to draw the lines.
Mirror Upside and Mirror Downside: These options enable drawing additional mirror lines above and below the extended lines.
- Hide Old Lines: An option to hide previous pivot lines once new ones are drawn for a cleaner chart. Turned on by default.
6. Conclusion
Overall, the Conversion Line SMA in this indicator smooths out the conversion line data and effectively functions as a trend line for the candlestick chart, helping traders visually interpret the underlying market trend. The extended and mirror lines provide further context for potential price reversal or continuation areas, making this a powerful tool for multi-timeframe technical analysis.

EMA/SMA Ribbon Pro (AUTO HTF + Labels)This indicator is a multi-timeframe (MTF) moving average ribbon that dynamically adjusts to the next highest timeframe. It provides a visual representation of market trends by stacking multiple EMAs and SMAs with customizable color fills and labels.
Features
✅ Multi-Timeframe (MTF) Support: Automatically detects the next highest time frame or allows for manual selection
✅ Customizable Moving Averages: Supports EMA and SMA with different lengths for flexible configuration
✅ Ribbon Visualization: Smooth color transitions between different moving averages for better trend identification
✅ Crossover Labels: Detects bullish and bearish EMA/SMA crossovers and marks them on the chart
✅ Price Labels & Timeframe Display: Displays moving average values to the right of the price axis with customizable label padding and colors
How It Works
Select the HTF mode: Manual or automatic
Choose EMA/SMA lengths to create different ribbons
Enable/disable price labels for each moving average
Customize colors and transparency for ribbons and labels
Crossover labels appear when faster moving averages cross slower ones and vice versa
Use Cases
📌 Trend Identification: Identify bullish and bearish trends using multiple EMAs and SMAs
📌 Support & Resistance Zones: MAs can act as dynamic support and resistance levels
📌 Reversal & Confirmation Signals: Watch for MTF crossovers to confirm trend changes
Customization
🔹 Standard EMA Lengths: 6, 8, 13, 21, 34, 48, 100, 200, 300, 400
🔹 SMA Lengths: 48, 100, 200
🔹 Color Adjustments: Set custom colors for bullish/bearish ribbons
🔹 Crossovers: Enable/disable custom crossover pairs (e.g., 100/200 EMA, 200 EMA/SMA).
This indicator is perfect for traders who rely on multi-timeframe confluence while seeking to enhance their market analysis and decision-making process.
As always, by combining EMA/SMA Ribbon with other tools, traders ensure that they are not relying on a single indicator. This layered approach can reduce the likelihood of false signals and improve overall trading accuracy.
As always, be sure to use any indicator with price action and volume indicators for better trade confirmation!

Sma Indicator with Ratio (pr)SMA Indicator with Ratio (PR) is a technical analysis tool designed to provide insights into the relationship between multiple Simple Moving Averages (SMAs) across different time frames. This indicator combines three key SMAs: the 111-period SMA, 730-period SMA, and 1400-period SMA. Additionally, it introduces a ratio-based approach, where the 730-period SMA is multiplied by factors of 2, 3, 4, and 5, allowing users to analyze potential market trends and price movements in relation to different SMA levels.
What Does This Indicator Do?
The primary function of this indicator is to track the movement of prices in relation to several SMAs with varying periods. By visualizing these SMAs, users can quickly identify:
Short-term trends (111-period SMA)
Medium-term trends (730-period SMA)
Long-term trends (1400-period SMA)
Additionally, the multiplied versions of the 730-period SMA provide deeper insights into potential price reactions at different levels of market volatility.
How Does It Work?
The 111-period SMA tracks the shorter-term price trend and can be used for identifying quick market movements.
The 730-period SMA represents a longer-term trend, helping users gauge overall market sentiment and direction.
The 1400-period SMA acts as a very long-term trend line, giving users a broad perspective on the market’s movement.
The ratio-based SMAs (2x, 3x, 4x, 5x of the 730-period SMA) allow for an enhanced understanding of how the price reacts to higher or lower volatility levels. These ratios are useful for identifying key support and resistance zones in a dynamic market environment.
Why Use This Indicator?
This indicator is useful for traders and analysts who want to track the interaction of price with different moving averages, enabling them to make more informed decisions about potential trend reversals or continuations. The added ratio-based values enhance the ability to predict how the market might react at different levels.
How to Use It?
Trend Confirmation: Traders can use the indicator to confirm the direction of the market. If the price is above the 111, 730, or 1400-period SMA, it may indicate an uptrend, and if below, a downtrend.
Support/Resistance Levels: The multiplied versions of the 730-period SMA (2x, 3x, 4x, 5x) can be used as dynamic support or resistance levels. When the price approaches or crosses these levels, it might indicate a change in the trend.
Volatility Insights: By observing how the price behaves relative to these SMAs, traders can gauge market volatility. Higher multiples of the 730-period SMA can signal more volatile periods where price movements are more pronounced.

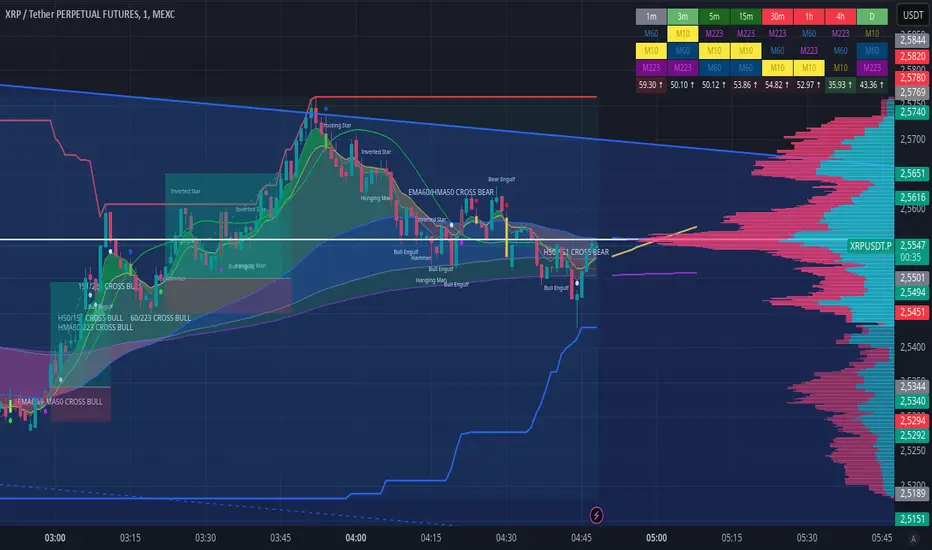
EMA CROSS v1.0 by ScorpioneroIndicator Description: Multi-Timeframe SMA Table & Plot
This indicator displays a structured table of Simple Moving Averages (SMA) across multiple timeframes and plots them directly on the chart for better trend analysis.
Features:
✅ Multi-Timeframe SMA Calculation: Computes SMAs for different periods (10, 60, and 223) across six timeframes (1m, 3m, 5m, 15m, 30m, 60m).
✅ Sorted SMA Table: Displays a table in the bottom-right corner of the chart, showing the three SMAs per timeframe, sorted in descending order.
✅ Color-Coded Cells: Each SMA is highlighted with a specific color:
🟡 Yellow → 10-period SMA
🔵 Blue → 60-period SMA
🟣 Purple → 223-period SMA
⚪ Gray → Other values
✅ SMA Plotting on the Chart: All calculated SMAs are plotted directly on the price chart, allowing users to visualize their interaction with price movements.
How to Use:
The table provides a quick overview of SMA rankings across timeframes, helping identify bullish or bearish trends.
The SMA plots on the chart can be used for dynamic support/resistance analysis and trend confirmation.
This indicator is ideal for traders who rely on multi-timeframe trend analysis to make informed trading decisions! 🚀
by Scorpionero
Custom Length Moving AverageThe Custom Length Moving Average is a dynamic indicator that allows traders to plot a moving average with an adjustable length based on their preferred number of days. Users can choose between Simple Moving Average (SMA), Exponential Moving Average (EMA), or Weighted Moving Average (WMA) to match their trading strategy. The script automatically calculates the moving average length by factoring in the chart’s timeframe and trading session duration, ensuring precision and adaptability. This makes it an ideal tool for traders looking for a flexible moving average that adjusts to different market conditions and timeframes.

AI Volume Breakout for scalpingPurpose of the Indicator
This script is designed for trading, specifically for scalping, which involves making numerous trades within a very short time frame to take advantage of small price movements. The indicator looks for volume breakouts, which are moments when trading volume significantly increases, potentially signaling the start of a new price movement.
Key Components:
Parameters:
Volume Threshold (volumeThreshold): Determines how much volume must increase from one bar to the next for it to be considered significant. Set at 4.0, meaning volume must quadruplicate for a breakout signal.
Price Change Threshold (priceChangeThreshold): Defines the minimum price change required for a breakout signal. Here, it's 1.5% of the bar's opening price.
SMA Length (smaLength): The period for the Simple Moving Average, which helps confirm the trend direction. Here, it's set to 20.
Cooldown Period (cooldownPeriod): Prevents signals from being too close together, set to 10 bars.
ATR Period (atrPeriod): The period for calculating Average True Range (ATR), used to measure market volatility.
Volatility Threshold (volatilityThreshold): If ATR divided by the close price exceeds this, the market is considered too volatile for trading according to this strategy.
Calculations:
SMA (Simple Moving Average): Used for trend confirmation. A bullish signal is more likely if the price is above this average.
ATR (Average True Range): Measures market volatility. Lower volatility (below the threshold) is preferred for this strategy.
Signal Generation:
The indicator checks if:
Volume has increased significantly (volumeDelta > 0 and volume / volume >= volumeThreshold).
There's enough price change (math.abs(priceDelta / open) >= priceChangeThreshold).
The market isn't too volatile (lowVolatility).
The trend supports the direction of the price change (trendUp for bullish, trendDown for bearish).
If all these conditions are met, it predicts:
1 (Bullish) if conditions suggest buying.
0 (Bearish) if conditions suggest selling.
Cooldown Mechanism:
After a signal, the script waits for a number of bars (cooldownPeriod) before considering another signal to avoid over-trading.
Visual Feedback:
Labels are placed on the chart:
Green label for bullish breakouts below the low price.
Red label for bearish breakouts above the high price.
How to Use:
Entry Points: Look for the labels on your chart to decide when to enter trades.
Risk Management: Since this is for scalping, ensure each trade has tight stop-losses to manage risk due to the quick, small movements.
Market Conditions: This strategy might work best in markets with consistent volume and price changes but not extreme volatility.
Caveats:
This isn't real AI; it's a heuristic based on volume and price. Actual AI would involve machine learning algorithms trained on historical data.
Always backtest any strategy, and consider how it behaves in different market conditions, not just the ones it was designed for.

John Bob-Trading-BotDeveloped by Ayebale John Bob with the help of his bestie, this innovative strategy combines advanced Smart Money Concepts with practical risk management tools to help traders identify and capitalize on key market moves.
Key Features:
Smart Money Concepts & Fair Value Gaps (FVG):
The strategy monitors price action for fair value gaps, which are visualized as extremely faint horizontal lines on the chart. These FVGs signal potential areas where institutional traders might have entered or exited positions.
Dynamic Entry Signals:
Buy signals are triggered when the price crosses above the 50-bar lowest low or when a bullish FVG is detected. Conversely, sell signals are generated when the price falls below the 50-bar highest high or a bearish FVG is identified. Each signal is visually marked on the chart with clear buy (green) and sell (red) labels.
Multi-Level Order Execution:
Once an entry signal occurs, the strategy places five separate orders, each with its own take-profit (TP) level. The TP levels are calculated dynamically using the Average True Range (ATR) and a set of predefined multipliers. This allows traders to scale out of positions as the market moves favorably.
Dynamic Risk Management:
A stop-loss is automatically set at a distance determined by the ATR, ensuring that risk is managed in accordance with current market volatility.
Real-Time Trade Information Table:
In the bottom-right corner of the chart, a trade information table displays essential details about the current trade:
Side: Displays "BUY NOW" (with a dark green background) for long entries or "SELL NOW" (with a dark red background) for short entries.
Entry Price & Stop-Loss: Shows the entry price (highlighted in green) and the corresponding stop-loss level (highlighted in red).
Take-Profit Levels: Lists the five TP levels, each of which turns green once the market price reaches that target.
Timer: A live timer in minutes counts from the moment the current trade trigger started, helping traders track the duration of their active trades.
Visual Progress Bar:
A histogram-style progress bar is plotted on the chart, visually representing the percentage gain (or loss) relative to the entry price.
This strategy was meticulously designed to incorporate both technical analysis and smart risk management, offering a robust trading solution that adapts to changing market conditions. Whether you're a seasoned trader or just starting out, the AyebaleJohnBob Trading Bot equips you with the tools and visual cues needed to make well-informed trading decisions. Enjoy a seamless blend of strategy and style—crafted with passion by Ayebale John Bob and his bestie!

Price Imbalance as Consecutive Levels of AveragesOverview
The Price Imbalance as Consecutive Levels of Averages indicator is an advanced technical analysis tool designed to identify and visualize price imbalances in financial markets. Unlike traditional moving average (MA) indicators that update continuously with each new price bar, this indicator employs moving averages calculated over consecutive, non-overlapping historical windows. This unique approach leverages comparative historical data to provide deeper insights into trend strength and potential reversals, offering traders a more nuanced understanding of market dynamics and reducing the likelihood of false signals or fakeouts.
Key Features
Consecutive Rolling Moving Averages: Utilizes three distinct simple moving averages (SMAs) calculated over consecutive, non-overlapping windows to capture different historical segments of price data.
Dynamic Color-Coded Visualization: SMA lines change color and style based on the relationship between the averages, highlighting both extreme and normal market conditions.
Median and Secondary Median Lines: Provides additional layers of price distribution insight during normal trend conditions through the plotting of primary and secondary median lines.
Fakeout Prevention: Filters out short-term volatility and sharp price movements by requiring consistent historical alignment of multiple moving averages.
Customizable Parameters: Offers flexibility to adjust SMA window lengths and line extensions to align with various trading strategies and timeframes.
Real-Time Updates with Historical Context: Continuously recalculates and updates SMA lines based on comparative historical windows, ensuring that the indicator reflects both current and past market conditions.
Inputs & Settings
Rolling Window Lengths:
Window 1 Length (Most Recent) Bars: Number of bars used to calculate the most recent SMA. (Default: 5, Range: 2–300)
Window 2 Length (Preceding) Bars: Number of bars for the second SMA, shifted by Window 1. (Default: 8, Range: 2–300)
Window 3 Length (Third Rolling) Bars: Number of bars for the third SMA, shifted by the combined lengths of Window 1 and Window 2. (Default: 13, Range: 2–300)
Horizontal Line Extension:
Horizontal Line Extension (Bars): Determines how far each SMA line extends horizontally on the chart. (Default: 10 bars, Range: 1–100)
Functionality and Theory
1. Calculating Consecutive Simple Moving Averages (SMAs):
The indicator calculates three SMAs, each based on distinct and consecutive historical windows of price data. This approach contrasts with traditional MAs that continuously update with each new price bar, offering a static view of past trends rather than an ongoing one.
Mean1 (SMA1): Calculated over the most recent Window 1 Length bars. Represents the short-term trend.
Mean1=∑i=1N1CloseiN1
Mean1=N1∑i=1N1Closei
Where N1N1 is the length of Window 1.
Mean2 (SMA2): Calculated over the preceding Window 2 Length bars, shifted back by Window 1 Length bars. Represents the medium-term trend.
\text{Mean2} = \frac{\sum_{i=1}^{N_2} \text{Close}_{i + N_1}}}{N_2}
Where N2N2 is the length of Window 2.
Mean3 (SMA3): Calculated over the third rolling Window 3 Length bars, shifted back by the combined lengths of Window 1 and Window 2 bars. Represents the long-term trend.
\text{Mean3} = \frac{\sum_{i=1}^{N_3} \text{Close}_{i + N_1 + N_2}}}{N_3}
Where N3N3 is the length of Window 3.
2. Determining Market Conditions:
The relationship between the three SMAs categorizes the market condition into either extreme or normal states, enabling traders to quickly assess trend strength and potential reversals.
Extreme Bullish:
Mean3Mean2>Mean1
Mean3>Mean2>Mean1
Indicates a strong and sustained downward trend. SMA lines are colored purple and styled as dashed lines.
Normal Bullish:
Mean1>Mean2andnot in extreme bullish condition
Mean1>Mean2andnot in extreme bullish condition
Indicates a standard upward trend. SMA lines are colored green and styled as solid lines.
Normal Bearish:
Mean1Mean2>Mean1
Mean3>Mean2>Mean1
Normal Bullish:
Mean1>Mean2andnot in Extreme Bullish
Mean1>Mean2andnot in Extreme Bullish
Normal Bearish:
Mean1 Mean2 > Mean3
Visualization: All three SMAs are displayed as gold dashed lines.
Median Lines: Not displayed to maintain chart clarity.
Interpretation: Indicates a strong and sustained upward trend. Traders may consider entering long positions, confident in the trend's strength without the distraction of additional lines.
2. Normal Bullish Condition:
SMAs Alignment: Mean1 > Mean2 (not in extreme condition)
Visualization: Mean1 and Mean2 are green solid lines; Mean3 is gray.
Median Lines: A thin blue dotted median line is plotted between Mean1 and Mean2, with two additional thin blue dashed lines as secondary medians.
Interpretation: Confirms an upward trend while providing deeper insights into price distribution. Traders can use the median and secondary median lines to identify optimal entry points and manage risk more effectively.
3. Extreme Bearish Condition:
SMAs Alignment: Mean3 > Mean2 > Mean1
Visualization: All three SMAs are displayed as purple dashed lines.
Median Lines: Not displayed to maintain chart clarity.
Interpretation: Indicates a strong and sustained downward trend. Traders may consider entering short positions, confident in the trend's strength without the distraction of additional lines.
4. Normal Bearish Condition:
SMAs Alignment: Mean1 < Mean2 (not in extreme condition)
Visualization: Mean1 and Mean2 are red solid lines; Mean3 is gray.
Median Lines: A thin blue dotted median line is plotted between Mean1 and Mean2, with two additional thin blue dashed lines as secondary medians.
Interpretation: Confirms a downward trend while providing deeper insights into price distribution. Traders can use the median and secondary median lines to identify optimal entry points and manage risk more effectively.
Customization and Flexibility
The Price Imbalance as Consecutive Levels of Averages indicator is highly adaptable, allowing traders to tailor it to their specific trading styles and market conditions through adjustable parameters:
SMA Window Lengths: Modify the lengths of Window 1, Window 2, and Window 3 to capture different historical trend segments, whether focusing on short-term fluctuations or long-term movements.
Line Extension: Adjust the horizontal extension of SMA and median lines to align with different trading horizons and chart preferences.
Color and Style Preferences: While default colors and styles are optimized for clarity, traders can customize these elements to match their personal chart aesthetics and enhance visual differentiation.
This flexibility ensures that the indicator remains versatile and applicable across various markets, asset classes, and trading strategies, providing valuable insights tailored to individual trading needs.
Conclusion
The Price Imbalance as Consecutive Levels of Averages indicator offers a comprehensive and innovative approach to analyzing price trends and imbalances within financial markets. By utilizing three consecutive, non-overlapping SMAs and incorporating median lines during normal trend conditions, the indicator provides clear and actionable insights into trend strength and price distribution. Its unique design leverages comparative historical data, distinguishing it from traditional moving averages and enhancing its utility in identifying genuine market movements while minimizing false signals. This dynamic and customizable tool empowers traders to refine their technical analysis, optimize their trading strategies, and navigate the markets with greater confidence and precision.

Ultimate Total MA + ATRIndicator Description (English)
Name: Tendencias FX - Multi-Line with Customizable Offsets (1x..6x)
This script is a multi-purpose trend-following indicator that calculates a central Moving Average (Mid Line) plus a set of 6 different bands (1x to 6x) above and below that average. Each band is determined by a user-defined ATR length and multiplier. Key features include:
Independent MA Types
Choose different moving average methods for the Mid Line and for the ATR calculation.
Available types: SMA, EMA, WMA, RMA, HMA, and ALMA.
Separate Lengths
Configure the length of the Mid Line independently from the ATR length.
This allows fine-tuning of both the central average and the volatility measure.
6 Customizable Multipliers
Bands are calculated for 1x, 2x, 3x, 4x, 5x, and 6x multiples of the chosen ATR.
Each level has its own checkbox in the Inputs tab so you can show or hide them at will.
Color Dynamics
The Mid Line automatically changes color to green when its current value is higher than the previous bar’s value, and red otherwise.
All upper/lower bands are rendered in a neutral gray (#787b86) for easy distinction.
Time Shift (Offset)
An offset parameter allows shifting the entire indicator (Mid Line plus bands) forward (to the right) or backward (to the left) by a certain number of bars.
This can help evaluate leads/lags, or compare the past behavior of these lines against future price developments.
Check Boxes for Visibility
Checkboxes in the Inputs let you toggle 1x..6x band levels.
By default, 1x, 2x, and 3x are visible, while 4x, 5x, and 6x are off.
Overlay with Shared Price Scale
The script is set as overlay=true and uses scale=scale.right, so it draws directly on the main chart and shares the same price axis as your candles.
This indicator is ideal if you want:
A central MA for trend detection.
ATR-based volatility bands (up to 6 multipliers).
Full control over the type and length of both the Mid Line MA and the ATR.
An optional offset to shift the lines in time for backtesting or forward-projection.
Usage Tips
In the Inputs tab, customize:
Mid Line length and ATR length independently.
MA methods for both Mid Line and ATR (SMA, EMA, WMA, RMA, HMA, ALMA).
Band visibility via checkboxes for 1x..6x.
Offset for shifting lines in time.
In the Style tab, you can further customize colors, line widths, and visibility of each element (Mid line, ±1x..±6x).
Enjoy exploring different settings to best match your preferred trading style and timeframe!

Smooth Moving Average (SMA) MTF Trend PanelDescription:
The SMA MTF Trend Panel is a multi-timeframe (MTF) trend visualization tool designed to help traders quickly assess market conditions across multiple timeframes based on the Simple Moving Average (SMA). This script calculates the trend direction (Bullish, Bearish, or Neutral) and the trend strength percentage for each selected timeframe. It displays the information in an intuitive panel that is dynamically updated in real-time.
How It Works:
1. SMA Calculation:
• For each timeframe, the script calculates the SMA based on a user-defined length (default: 50).
2. Trend Identification:
• Compares the current price to the SMA and assigns a label: “Bull,” “Bear,” or “Neutral.”
3. Panel Display:
• Displays trends, strengths, and shifts for each timeframe in an interactive table.
4. Real-Time Updates:
• Continuously monitors price movements and updates the panel to reflect the latest data.
Customizable Inputs:
1. Panel Settings:
• Orientation: Choose vertical or horizontal layout.
• Position: Select panel location on the chart.
• Border Width/Color: Adjust panel borders for better visualization.
2. Trend Colors:
• Define custom colors for bullish, bearish, neutral, and shift conditions.
3. SMA Length:
• Adjust the SMA period to suit your trading style (e.g., short-term scalping or long-term trend following).
4. Timeframes:
• Set specific timeframes to analyze based on your trading strategy.

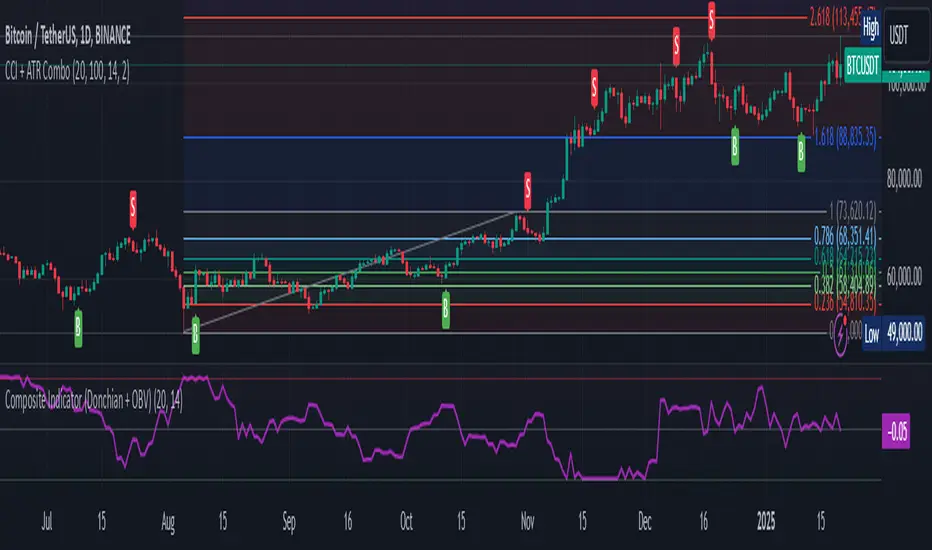
Composite Indicator (CCI + ATR)Composite Indicator (CCI + ATR)
The Composite Indicator (CCI + ATR) combines the Commodity Channel Index (CCI) with the Average True Range (ATR) , providing traders with a dynamic tool for identifying entry and exit points based on momentum and volatility. This indicator is particularly useful for markets like cryptocurrencies, which often exhibit sharp sell-offs and gradual upward trends.
Key Features
Momentum Analysis with CCI: The CCI calculates price momentum by comparing the current price level to its average over a specific period. The indicator generates signals when CCI crosses predefined thresholds.
- Buy Signal: Triggered when CCI crosses above the lower threshold (e.g., -100).
- Sell Signal: Triggered when CCI crosses below the upper threshold (e.g., +100).
Volatility Filtering with ATR: The ATR measures market volatility, ensuring signals occur only during significant price movements.
Separate multipliers for buy and sell signals allow tailored filtering based on market behavior.
Stop Loss Calculation: Dynamic stop loss levels are calculated using the ATR multiplier to adapt to market volatility, offering better risk management.
How It Works
CCI Calculation: The CCI is calculated using the typical price ((High + Low + Close) / 3) and a user-defined length. It detects momentum changes by measuring deviations from the average price.
ATR Calculation: The ATR determines the average price range over a specified period, identifying the market’s volatility. The ATR SMA acts as a baseline to filter signals.
Buy Signal: A buy signal is triggered when:
- CCI crosses above the lower threshold (e.g., -100).
- ATR exceeds its SMA multiplied by the buy multiplier (e.g., 1.0).
Sell Signal: A sell signal is triggered when:
- CCI crosses below the upper threshold (e.g., +100).
- ATR exceeds its SMA multiplied by the sell multiplier (e.g., 0.95).
Stop Loss Integration:
- Long positions: Stop loss = Low – (ATR * ATR Multiplier)
- Short positions: Stop loss = High + (ATR * ATR Multiplier)
Advantages
Combines momentum (CCI) and volatility (ATR) for precise signal generation.
Customizable thresholds and multipliers for different market conditions.
Dynamic stop loss ensures better risk management in volatile markets.
Suggested Parameter Settings
CCI Length: 20 (default). Adjust as follows:
- 10–15: Shorter timeframes (e.g., 5-15 minutes).
- 20: General use for 1-hour timeframes.
- 30–50: Longer timeframes (e.g., 4-hour or daily charts).
CCI Threshold: 100 (default). Adjust as follows:
- 50–75: For more frequent signals in ranging markets.
- 100: Balanced for most trading conditions.
- 150–200: For strong trends to reduce noise.
ATR Length: 14 (default). Adjust as follows:
- 10–14: For assets with moderate volatility.
- 20: For assets with lower volatility.
ATR Buy Multiplier: 1.0 (default). Adjust as follows:
- 0.9–1.0: For gradual uptrends in crypto markets.
- 1.1–1.2: For stronger trend filtering.
ATR Sell Multiplier: 0.95 (default). Adjust as follows:
- 0.8–0.95: For sharp sell-offs.
- 1.0–1.1: For stable downward trends.
ATR Multiplier (Stop Loss): 1.5 (default). Adjust as follows:
- 1.0–1.2: For shorter timeframes or less volatile markets.
- 2.0–2.5: For highly volatile markets like cryptocurrencies.
Example Use Cases
Scalping (5-15 minute charts): Use CCI Length = 10, CCI Threshold = 75, ATR Buy Multiplier = 0.9, ATR Sell Multiplier = 0.8.
Day Trading (1-hour charts): Use CCI Length = 20, CCI Threshold = 100, ATR Buy Multiplier = 1.0, ATR Sell Multiplier = 0.95.
Swing Trading (4-hour or daily charts): Use CCI Length = 30, CCI Threshold = 150, ATR Buy Multiplier = 1.2, ATR Sell Multiplier = 1.0.
Final Thoughts The Composite Indicator (CCI + ATR) is a versatile tool designed to enhance trading decisions by combining momentum analysis with volatility filtering. Whether scalping or swing trading, this indicator provides actionable insights and robust risk management to navigate complex markets effectively.

Composite Indicator (Donchian + OBV)Composite Indicator (Donchian + OBV)
The Composite Indicator (Donchian + OBV) is a powerful tool designed to evaluate the strength of market breakouts and momentum trends , offering traders a comprehensive perspective on price action. This indicator combines the Donchian Channel with On-Balance Volume (OBV) to create a dynamic and easy-to-interpret metric scaled between -1 and 1 .
Key Features
Breakout Strength Analysis:
- The indicator assesses the strength of price breakouts relative to the upper and lower bounds of the Donchian Channel.
- Positive values close to 1 indicate a strong bullish breakout.
- Negative values close to -1 indicate a strong bearish breakout.
Momentum Detection with OBV:
- On-Balance Volume (OBV) tracks the cumulative buying and selling volume to gauge market momentum.
- The smoothed OBV trend ensures the momentum component aligns with price action, reducing noise.
Integrated Composite Value:
- Combines breakout strength and OBV momentum into a single metric for enhanced clarity.
- The final composite value highlights whether the market is bullish, bearish, or neutral.
Divergence Detection:
- Spot bullish divergences when the indicator rises while price falls, suggesting a potential upward reversal.
- Identify bearish divergences when the indicator falls while price rises, hinting at a potential downward reversal.
How It Works
Donchian Channel Analysis:
- Calculates the highest high and lowest low over a user-defined period to establish the upper and lower channels .
- Breakouts beyond these channels contribute to the breakout strength component.
OBV Momentum:
- Measures cumulative volume trends to validate price movements.
- Momentum is derived from the rate of change in smoothed OBV values.
Composite Calculation:
- Combines breakout strength and OBV momentum, normalized and scaled to -1 to 1 for clarity.
How to Use
Bullish Breakout:
- When the indicator value approaches 1 , it signals a strong upward breakout supported by positive OBV momentum.
- Example Action: Consider a Buy if price breaks the upper Donchian Channel with increasing OBV.
Bearish Breakout:
- When the indicator value approaches -1 , it indicates a strong downward breakout supported by negative OBV momentum.
- Example Action: Consider a Sell if price breaks the lower Donchian Channel with decreasing OBV.
Neutral Market:
- When the value is near 0 , the market is likely balanced with no significant breakout or momentum detected.
Divergence Opportunities:
- Bullish Divergence: Price makes lower lows, but the indicator trends upward → Potential upward reversal.
- Bearish Divergence: Price makes higher highs, but the indicator trends downward → Potential downward reversal.
Customization Options
Donchian Channel Length: Adjust the period for the upper and lower bounds.
OBV Smoothing Length: Modify the smoothing period for OBV to fine-tune momentum detection.
Scaling Adjustments: The composite value is automatically normalized for consistency across timeframes.
Ideal Use Cases
Breakout Trading: Identify and confirm strong breakouts in volatile markets.
Momentum Confirmation: Validate price movements with volume-based momentum.
Reversal Detection: Leverage divergences to spot potential market reversals.
Example Applications
Strong Bullish Signal:
- Price breaks the upper channel , and OBV shows increasing volume → Composite value near 1 .
- Action: Enter a Buy position and set a Stop Loss below the upper channel.
Strong Bearish Signal:
- Price breaks the lower channel , and OBV shows decreasing volume → Composite value near -1 .
- Action: Enter a Sell position and set a Stop Loss above the lower channel.
Neutral Market:
- Composite value near 0 suggests indecision or consolidation. Wait for a breakout.
Limitations
Best used alongside additional tools like RSI or MACD for filtering noise and improving decision-making.
Requires careful parameter tuning based on the asset and timeframe.
Final Thoughts
The Composite Indicator (Donchian + OBV) offers traders a versatile tool to navigate complex markets. By blending breakout analysis with volume-based momentum, this indicator provides an actionable edge for identifying high-probability opportunities and potential reversals.
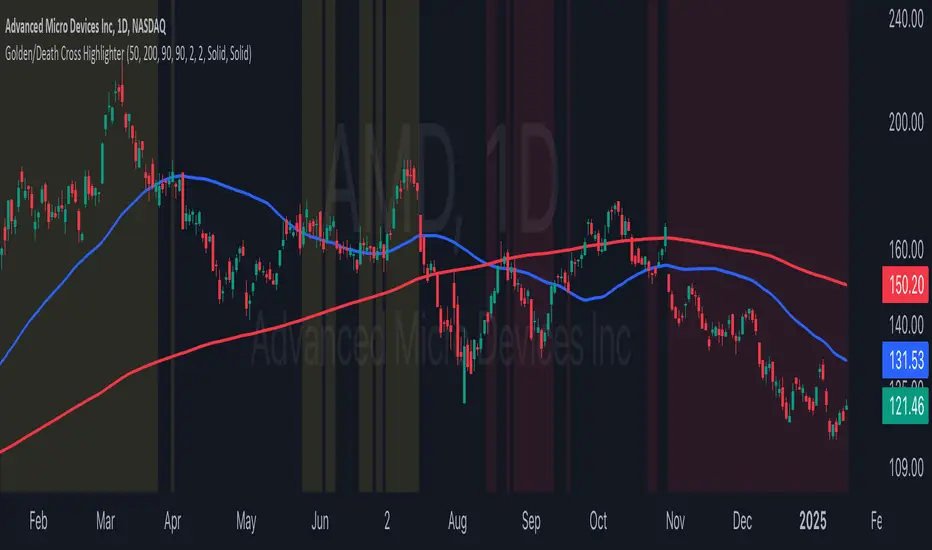
Golden/Death Cross HighlighterThis indicator helps you easily identify and visualize Golden Cross and Death Cross patterns combined with price action confirmation. It highlights chart backgrounds when specific conditions are met, making it easy to spot potential trend changes.
🔑 Key Features:
Highlights Golden Cross conditions (50 SMA crosses above 200 SMA) when price closes above both MAs
Highlights Death Cross conditions (50 SMA crosses below 200 SMA) when price closes below both MAs
Customizable MA lengths (default: 50 and 200)
Adjustable highlight opacity
Built-in alerts for cross events
Clear visualization of both moving averages
📈 Color Guide:
Yellow Background: Golden Cross active + price above both MAs
Red Background: Death Cross active + price below both MAs
⚙️ Settings:
Fast MA Length: Length of faster moving average (default 50)
Slow MA Length: Length of slower moving average (default 200)
Golden Cross Highlight Opacity: Adjust visibility of bullish highlights
Death Cross Highlight Opacity: Adjust visibility of bearish highlights
💡 Usage Tips:
Use in combination with other indicators for confirmation
Set up alerts for potential trend changes
Adjust opacity to match your chart style
Works best on higher timeframes (4H, Daily, Weekly)
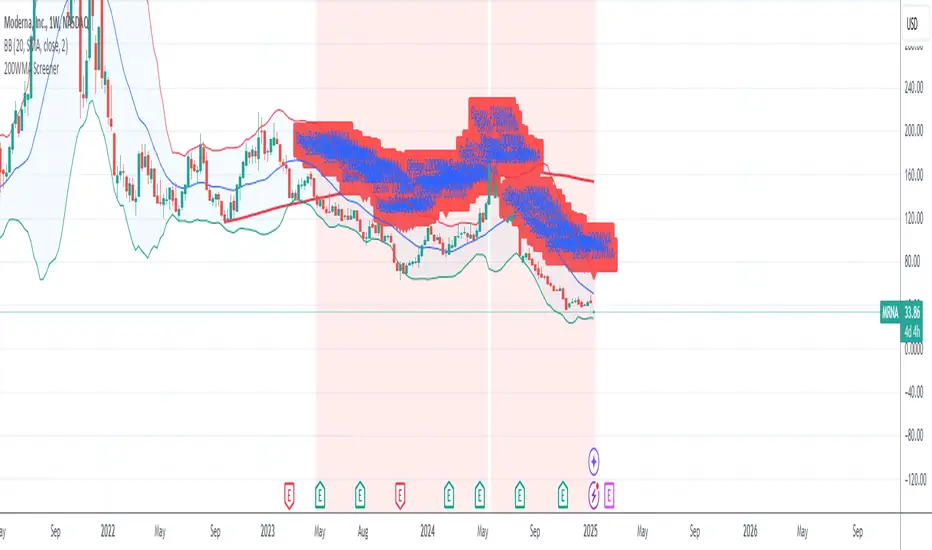
200WMA ScreenerDescription:
This custom indicator helps identify stocks trading below their 200-week moving average (200WMA), a key technical indicator often used to analyze long-term trends. The script calculates the 200WMA using weekly close prices and provides the following features:
Visual Plot: Displays the 200WMA as a smooth line on the chart for easy trend analysis.
Background Highlight: Automatically highlights the chart background when the current price is below the 200WMA, signaling a potential bearish trend or undervalued stock.
Alert System: Includes an alert condition to notify you when a stock trades below its 200WMA, so you never miss an opportunity.
Compatibility: Works across all assets (stocks, forex, crypto) and automatically adapts to the selected ticker.
This script is ideal for traders and investors looking for long-term opportunities, identifying potential trend reversals, or spotting undervalued stocks.